Master s thesis. Geography. Geoinformatics
|
|
|
- Ismo Lahti
- 6 vuotta sitten
- Katselukertoja:
Transkriptio
 FIN-00014 Helsingin yliopisto i")
1 Master s thesis Geography Geoinformatics BIKE SHARING AS PART OF URBAN MOBILITY IN HELSINKI A USER PERSPECTIVE Elias Willberg February 2019 Supervisors: Tuuli Toivonen, Maria Salonen UNIVERSITY OF HELSINKI DEPARTMENT OF GEOSCIENCES AND GEOGRAPHY DIVISION OF GEOGRAPHY P.O. Box 64 (Gustaf Hällströmin katu 2) FIN Helsingin yliopisto i
2 HELSINGIN YLIOPISTO HELSINGFORS UNIVERSITET UNIVERSITY OF HELSINKI Tiedekunta/Osasto Fakultet/Sektion Faculty Laitos Institution Department Faculty of Science Department of Geosciences and Geography Tekijä Författare Author Elias Willberg Työn nimi Arbetets title Title Bike sharing as part of urban mobility in Helsinki a user perspective Oppiaine Läroämne Subject Geoinformatics Työn laji Arbetets art Level Master's Thesis Tiivistelmä Referat Abstract Aika Datum Month and Year February 2019 Sivumäärä Sidoantal Number of Pages 94 pp + appendices The number of bike-sharing systems has increased rapidly during the last decade. These systems expand urban mobility options and provide a solution to the so-called last-mile problem. While new bike-sharing systems are opened and current ones expanded in Finland and elsewhere in large numbers, it is important to understand how these systems are used and by whom. Despite the wealth of bike-sharing literature, usage patterns by different user groups are still not yet well studied. This knowledge is needed to ensure that the benefits of bike-sharing systems distribute as evenly as possible to the citizens. In this study, I have employed a person-based approach to study mobility patterns of bike-sharing users in Helsinki. The system in Helsinki was opened in 2016 and the urban bikes quickly became popular among citizens. I have aimed to understand how equally the bike-sharing system in Helsinki is serving the citizens and how different user groups have differed from each other in their use. I have also studied how the system is linking to public transport in Helsinki and compared the bike-sharing system usage and users in Helsinki to other systems internationally. These specific questions stem from the systematic literature review on bike-sharing (n=799), which I carried out before the empirical study. In this study, I have used a dataset provided by Helsinki Region Transport, which contained all the bike-sharing trips (~1.5 million) from Besides the trip information, the dataset contained the basic demographic information of the user. The results of literature review show bike-sharing systems have been an active and extensive study topic even though the study areas are mostly concentrated to certain cities. Based on the empirical data-analysis, majority of bike-sharing users are young adults between years old whereas the share of over 50 year olds is only 12 %. Both men and women use urban bikes actively but men are overrepresented both in the number of users and trips. The use of bikes is not equal but a small minority of users have generated the majority of trips. The users who live inside the bike station coverage area make around 80 % of the trips implying that the proximity of a station has a considerable impact on the use. Trip profiles of those living inside the system coverage area differ considerably from those who live outside the area. For example, the users living inside the area seem to combine urban bikes less with public transport and they use urban bikes relatively more on weekends compared to the other group. The subscription type and use activity are also important factors shaping usage patterns. Then again, age and gender are more important in determining whether someone chooses to become a user than in shaping usage patterns. The use of bike-sharing system in Helsinki has been high even when compared internationally. The results of this study show that the high usage rates still do not necessarily mean that the system would be equally used by citizens. Based on the systematic review, equity is a critical topic to address in relation to bike-sharing users. The user profiles in Helsinki seem to follow similar patterns of bike sharing as found in other cities with an overrepresentation of certain population groups. The use of young adults might promise well for the change of urban mobility. However, it is important to keep promoting cycling to a wider range of the population. The bike-sharing system in Helsinki will expand in 2019 to new areas. Based on the results of this study the expansion seems reasonable as a large part of the users live close to a bikesharing station. The expansion will then bring the full benefits of bike sharing accessible to a larger group of people in Helsinki. The system seems both to replace and extend the public transport system, which is common to bike-sharing systems in many cities. From the data perspective, the origin-destination type of trip data, which was used in this study, provided a great deal of useful information about users and usage profiles. Even when accounting for limitations in this data type, it is still an excellent addition complementing existing cycling data sources. Avainsanat Nyckelord Keywords bike sharing, bike-sharing systems, mobility, cycling, Helsinki. GIS Säilytyspaikka Förvaringställe Where deposited Muita tietoja Övriga uppgifter Additional information ii
3 HELSINGIN YLIOPISTO HELSINGFORS UNIVERSITET UNIVERSITY OF HELSINKI Tiedekunta/Osasto Fakultet/Sektion Faculty Laitos Institution Department Geotieteiden ja maantieteen osasto Matemaattis-luonnontieteellinen Tekijä Författare Author Elias Willberg Työn nimi Arbetets title Title Kaupunkipyörät osana kaupunkiliikkumista Helsingissä käyttäjänäkökulma Oppiaine Läroämne Subject Geoinformatiikka Työn laji Arbetets art Level Pro gradu -tutkielma Tiivistelmä Referat Abstract Aika Datum Month and Year Helmikuu 2019 Sivumäärä Sidoantal Number of Pages 94 s + liitteet Kaupunkipyöräjärjestelmien määrä globaalisti on kasvanut vauhdilla viimeisen vuosikymmenen aikana ja ne ovat nousseet varteenotettavaksi kaupunkiliikenteen täydentäjäksi monissa kaupungeissa. Järjestelmät tarjoavat vastauksen niin sanottuun viimeisen kilometrin ongelmaan. Samalla kun kaupunkipyöräjärjestelmien määrä lisääntyy ja olemassa olevien laajennusta pohditaan Suomessa ja maailmalla, on tärkeää tietää miten ja ennen kaikkea ketkä olemassa olevia järjestelmiä käyttävät? Huolimatta kaupunkipyöriä käsittelevän kirjallisuuden määrästä, eri käyttäjäryhmien käyttötottumuksia ja -profiileja ei ole vielä paljon tutkittu. Ymmärrys erilaisista käyttöprofiileista on tarpeen, jota voidaan varmistua, että kaupunkipyörien tuomat edut jakaantuvat mahdollisimman tasaisesti kaupunkilaisille. Tässä tutkimuksessa olen analysoinut Helsingin seudun liikenteen (HSL) kaupunkipyöräaineistoa ymmärtääkseni kuinka tasapuolisesti kaupunkipyöräjärjestelmä palvelee kaupunkilaisia ja miten eri käyttäjäryhmien matkaprofiilit eroavat toisistaan. Helsingin kaupunkipyöräjärjestelmä avattiin vuonna 2016 ja se on nopeasti noussut suosituksi kaupunkilaisten keskuudessa. Tämän lisäksi olen tutkinut, miten järjestelmä linkittyy Helsingin joukkoliikennejärjestelmään sekä miten kaupunkipyöräjärjestelmän käyttö vertautuu kansainvälisesti muiden saman tyyppisten kaupunkien järjestelmiin. Kyseiset tutkimusaiheet nousivat toistuvasti esiin tekemässäni systemaattisessa kirjallisuuskatsauksessa kaupunkipyöristä (n = 799). Käyttämäni kaupunkipyöräaineisto sisälsi kaikki vuonna 2017 Helsingin kaupunkipyöräjärjestelmällä tehdyt kaupunkipyörämatkat (~1,5 miljoonaa matkaa) sekä perustiedot kunkin matkan tekijästä. Kirjallisuuskatsauksen perusteella kaupunkipyöriä on tutkittu viimeisen kahden vuoden aikana erittäin aktiivisesti ja kattavasti, vaikka tutkimukset ovat olleet alueellisesti keskittyneitä tiettyihin kaupunkeihin. Empiirinen aineistoanalyysi puolestaan osoittaa, että kaupunkipyörien käyttäjistä suuri osa on nuoria noin vuotiaita, kun esimerkiksi yli 50- vuotiaita on vain noin 12 %. Sekä naiset että miehet käyttävät kaupunkipyöriä aktiivisesti, mutta miehet ovat yliedustettuina sekä käyttäjissä että tehtyjen matkojen lukumäärässä. Käyttö ei jakaudu tasaisesti vaan pienehkö ryhmä käyttäjiä on tehnyt enemmistön matkoista. Noin 80 % matkoista on kaupunkipyöräasemien alueella asuvien tekemiä, eli aseman läheisyydellä on merkittävä vaikutus käyttöön. Kantakaupungissa asuvien käyttäjien matkaprofiilit myös poikkeavat selkeästi asemaverkon ulkopuolella asuvien tekemistä matkoista. Asemaverkon sisällä asuvien matkat linkittyvät harvemmin joukkoliikenteeseen ja ne tehdään useammin viikonloppuna. Myös kaupunkipyörätilauksen tyypillä ja käyttöaktiivisudella on selkeä vaikutus käyttäjien matkaprofiileihin. Sen sijaan, ikä ja sukupuoli vaikuttavat enemmän kaupunkipyöräkäyttäjäksi tulemiseen kuin matkaprofiileihin. Kaupunkipyöräjärjestelmän käyttö Helsingissä on ollut kansainvälisesti korkealla tasolla. Tämän tutkimuksen tulosten perusteella järjestelmän suosio matkoissa mitattuna ei kuitenkaan välttämättä tarkoita, että käyttö jakautuisi tasaisesti kaupunkilaisten välillä. Systemaattiseen kirjallisuuskatsaukseen perustuen, käytön tasapuolisuutta on kriittistä tarkastella kaupunkipyöräkäyttäjien osalta. Käyttäjäkunta on selkeästi nuorta, kantakaupunkilaista ja miehet ovat käyttäjissä yliedustettuina. Kansainvälisessä tutkimuksessa juuri nämä ryhmät ovat tyypillisiä kaupunkipyöräkäyttäjiä. Nuorten aktiivisuus kaupunkipyörien käyttäjinä saattaa luvata hyvää kaupunkiliikenteen muutokselle, mutta toisaalta olisi tärkeää edistää pyöräilyn houkuttelevuutta myös laajemman väestönosan keskuudessa. Helsingin kaupunkipyöräjärjestelmä laajenee vuonna 2019, mikä tulosten kannalta näyttää perustellulta, sillä suuri osa käyttäjistä tulee läheltä asemia ja laajennos tuo järjestelmän tuomat hyödyt paremmin useamman kaupunkilaisen ulottuville. Järjestelmä näyttäisi sekä korvaavan että täydentävän julkista liikennettä, mikä on tyypillistä kansainvälisestikin. Aineiston näkökulmasta, tutkimuksessa käytetty OD-tyyppinen matka-aineisto pystyy tarjoamaan paljon hyödyllistä tietoa käyttäjistä ja käyttöprofiileista puutteistaan huolimatta. Se täydentää näin ollen oivallisesti olemassa olevia pyöräilyn aineistolähteitä. Avainsanat Nyckelord Keywords kaupunkipyörät, kaupunkipyöräjärjestelmät, liikkuminen, pyöräily, Helsinki, paikkatietojärjestelmät Säilytyspaikka Förvaringställe Where deposited Muita tietoja Övriga uppgifter Additional information iii
4 Table of Contents LIST OF FIGURES... vi LIST OF TABLES... vii 1. Introduction... 1 The study context... 1 The research problem Background... 6 Spatial Mobility... 6 Concept of spatial mobility... 6 Spatial mobility in urban areas... 7 Mobility data revolution... 8 Extracting insights from broad-scale mobility data... 8 Cycling as a form of mobility Factors affecting the use of bicycle Equity of cycling Integration with public transport Bike-sharing systems as part of urban mobility Principle History User profiles Trip patterns of different user groups Relationship of bike sharing and public transport Study area Cycling as part of daily mobility in Helsinki Modal share Cyclists demographics and cycling patterns in Helsinki Cycling promotion in Helsinki Public Transport system in Helsinki Helsinki bike-sharing system Coverage area System operation and use Public reception of bike-sharing system Bike-sharing user survey Data & Methods Data Characteristics of the bike sharing dataset Characteristics of other datasets iv
5 Methods Systematic literature review Bike sharing data processing Literature review on bike-sharing systems Current trends Temporal and disciplinary trends in bike sharing literature Topical trends in bike sharing studies Study areas in bike sharing studies Data types and variation in bike sharing studies Bike sharing trips in Helsinki Descriptive trip statistics Temporal trip patterns Most popular routes / stations Bike sharing users and variation among user groups in Helsinki User demographics Spatial distribution of users Trip generation by users Trip pattern variation by user groups Trip pattern variation by home area Trip pattern variation by age Trip pattern variation by gender Trip pattern variation by subscription type Trip pattern variation by the activity of use Discussion Bike-sharing systems are actively and extensively studied but study areas are concentrated System popularity does not necessarily mean equal use Spatiality matters User s home area is decisive in bike-sharing usage Active users and day users have distinctive usage patterns Bike sharing both complements and replaces public transport in Helsinki Origin-Destination trip data on bike sharing is a useful but limited data source 83 Future directions for bike-sharing planning and research Acknowledgemets Bibliography Appendices v
6 Figures Figure 1. Cycling trips by weekday in Helsinki based on Strava sport application and cycling counts data. Original figure presented in Tarnanen et al. (2017) in Finnish. Translated to English. 24 Figure 2. Cycling trips by hour in Helsinki based on Strava sport application data.. Original figure presented in Tarnanen et al. (2017) in Finnish. Translated to English. 24 Figure 3. Bike sharing station network in Helsinki in Figure 4 & Figure 5. The left photo is showing the handlebar of a shared bike while the right photo shows a bike rack where shared bikes are locked. Photos by: Elias Willberg 28 Figure 6: A sample from the bike sharing dataset from Helsinki from Descriptive information on the trip is combined with the basic user demographic information. 30 Figure 7. The workflow of this study 32 Figure 8. The original search terms and date for the Scopus search.. 33 Figure 9. The narrowed search terms and date for the Scopus search. The results of this query were selected for the systematic literature review. 33 Figure 10. Scientific literature on bike sharing by the publication year. The number of publications has become manifold during the last decade. The search was made in Scopus on Figure 11. Published scientific literature on bike sharing by subject area. The publications are being made by multiple disciplines showing the multidisciplinary nature of bike sharing as a study topic. 39 Figure 12. The country of the institution, which has conducted the bike sharing study. The studies included are being published between 1/2016-2/ Figure 13. Variation of the trip count per day per bike by month and week during the system operating season of Figure 14. Variation of mean covered distance, mean duration and mean distance difference of bike sharing trips by week in Helsinki (2017). 48 Figure 15. Trip time variation by minute in Almost 97 % of the trips are at maximum 30 minutes, which is the single hire time limit for the user to use the bike without additional costs. 49 Figure 16. The lowest 20 % and the fastest 20 % by median speed between two bike-sharing stations in Helsinki (2017). 50 Figure 17: Distribution of bike sharing trips in Helsinki in 2017 by month, week and day. Note: The last week of the October was not a full week but the bikes were in operation only from Monday to Wednesday 52 Figure 18. Percentages of bike sharing trips by weekdday in Helsinki in Figure 19. Hourly fluctuation of bike-sharing trips by weekday in Helsinki (2017). Weekdays typical patterns is different compared to weekend days. 54 Figure 20. Bike-sharing trips in Helsinki (2017). The most popular trips are either departing or returning to the central railway station. 55 Figure 21 & Figure 22: The maps are showing bike sharing departures and returns by station. 56 Figure 23: Share of bike sharing users in Helsinki by age group and gender (2017). 58 vi
7 Figure 24: Share of bike sharing trips in Helsinki by age group and gender (2017). 58 Figure 25: Share of population by age group in Helsinki (2017). Source: Statistics Finland (2017) 59 Figure 26. Bike-sharing users share of the total postal area population in Helsinki (2017). 60 Figure 27. Bike-sharing trips per person by postal area in Helsinki (2017). 62 Figure 28. Distribution of trip count, unique user days and trips per day variables in Helsinki (2017). Majority of users have taken a trip only occasionally. 63 Figure 29. Cumulative use of bike-sharing system in Helsinki (2017). A small minority of users have made the majority of trips. 64 Figure 30. Box plots show the variation of user age, potential public transport trips, weekday vs weekend relative use ratio and median route distance difference between the two home-area based user groups. 65 Figure 31. Bike-sharing users potential public transport trip share by postal area. The map shows the median share of potential public transport trips of all bike-sharing trips by postal area. The users, who are living close to a train or metro station, have higher shares in general. 67 Figure 32. Box plots show the variation of trip count, median trip distance difference, median trip duration and median trip speed between the age-groups. 69 Figure 33. Box plots show the variation of trip count, median trip duration, median trip distance and the share of potential public transport trips between the gender groups. 70 Figure 34. Box plots show the variation of median trip duration, median trip distance, median trip distance difference, and median number of trips per day between the subscription type groups. 72 Figure 35. Box plots show the variation of round trips days share, chained trips share, standard deviation of station usage, and median trip duration between the use activity groups. 74 Figure 36. Correlation matrix for the continuous user variables (see appendix 1 for the variable explanations). The blue color implies positive correlation and the red color negative correlation. Statistically not significant correlations are marked with x. 75 vii
8 Tables Table 1. Cyclists shares in Helsinki by gender, age and area. Original table presented in Cycling barometer 2016 in Finnish (Helsinki City Planning Department, 2016) Translated to English. 23 Table 2. Descriptions of the original columns in the bike-sharing dataset. 31 Table 3 Applied trip filters to bike-sharing data 35 Table 4. Classification of bike-sharing studies by the focus area of the study. The studies included are being published between 1/2016-2/ Table 5. The city/region, the country and the continent of the study area in the frequency order. The studies included are being published between 1/2016-2/ Table 6. Classification of datasets by type and size that were used in the reviewed bike sharing studies. 44 Table 7. Descriptive trip statistics for the Helsinki bike sharing in Table 8. Most common postal areas of those bike sharing users who are living inside the system coverage area. 61 Table 9. Most common postal areas of those bike sharing users who are living outside the system coverage area. Notable here is that seven out of the ten postal areas have a train station. 61 Table 10. Most common home cities of bike-sharing users in Helsinki. 62 Table 11. Descriptive statistics of bike-sharing user groups in Helsinki classified by home area. 64 Table 12. Temporal variation of potential public transport trips shares by inside users and outside users. The results suggest that outside users combine bike sharing with public transport especially in commuting trips. 66 Table 13. Descriptive statistics of bike-sharing user groups in Helsinki classified by the age group. 68 Table 14. Descriptive statistics of bike-sharing user groups in Helsinki classified by gender. 70 Table 15. Descriptive statistics of bike-sharing user groups in Helsinki classified by the subscription type. _ 71 Table 16. Descriptive statistics of bike-sharing user groups in Helsinki classified by the activity of use 73 viii
9 1. INTRODUCTION THE STUDY CONTEXT Interest in cycling is growing within societies for several reasons. Transportation is one of the major sources of carbon emissions. To mitigate the impacts of climate change and to meet the carbon reduction targets set in the Paris Agreement in 2015 (UNFCCC, 2015), drastic changes and emissions cuts are needed throughout society including transportation (Banister, 2011). The challenge is enormous considering that currently transportation is still heavily reliant on fossil fuels. In urban areas, where most of the population are living, the need for change in transport is even more evident. Problems related to car-dependency in cities such as congestion, parking, pollution and emissions have contributed to the aim to reduce the modal share of car transportation in urban areas around the world. Increasingly cities are now striving towards a low carbon economy or even to a carbon neutrality within the next few decades (EEA, 2016). Consequently, cycling has seen a revival of interest both academically and among decision-makers and urban planners and is now widely promoted as a sustainable transport solution (Martens, 2007; Pucher and Buehler, 2008; Fishman et al., 2013). It is not hard to see why cycling is promoted considering it is a zero-pollution, zero-emission and, at least at its current levels in most cities, zero-congestion mode of travel. The space needed by bikes is a fraction of the space needed by cars. Active cycling has also been showed to promote health benefits, which clearly outweigh health risks (e.g. traffic accidents) although direct health impacts of cycling are difficult to quantify (de Hartog et al., 2010; Handy et al., 2014; Götschi et al., 2016). Moreover, cycling-related costs are smaller compared to public transport let alone car transport, which makes cycling a fairly equitable transport mode (Pucher and Buehler, 2008). Indeed, as Pucher and Buehler (2008) put it, it is hard to beat cycling when it comes to environmental, social and economic sustainability. One of the most visible developments concerning urban cycling has been the rapid rise of bike-sharing systems. The first system appeared already in the 1960 s but during the recent decade, the number of bike-sharing systems in cities around the world has exploded. The recent boom has followed the success of Lyon and Paris where the local bike-sharing systems were launched in 2005 and 2007 (DeMaio, 2009). As at December 2018, the number 1
10 of operational systems worldwide is over 2100 (Meddin, 2018). The systems provide an easy to use alternative for other transport modes and for bicycle ownership complementing urban transport. Shared bikes have been promoted as a solution to the last-mile problem, which refers to a short journey at the beginning or at the end of a trip, for example to a bus stop, that may still be too long to walk (Shaheen et al., 2010). This way, integration of bike-sharing schemes into urban transportation systems holds potential to improve the attractiveness of public transport as a whole. Bike-sharing systems have been promoted to contribute to many targets. These include promoting modal shift, decreasing carbon emissions, enhancing accessibility, improving the health of users and decreasing congestion. However, it is not all positive. As Ricci (2015) shows, there is often a lack of evidence whether the promoted impacts were achieved after the system establishment. Bike-sharing systems have indisputable benefits such as improved accessibility and lowered barrier to urban cycling (Médard de Chardon et al., 2017). However, some of the benefits have shown to be exaggerated, especially those linked to environmental sustainability such as modal shift from car transport and reduced emissions (Ricci, 2015; Médard de Chardon et al., 2017). Studies focusing on linkages between bikesharing systems and the public transport have not been consistent either (Ricci, 2015). One of the key issues is equality. Multiple studies have shown that most bike-sharing systems tend to be disproportionately used by younger people and male more than female or elderly (Beecham and Wood, 2014; Vogel et al., 2014; Ricci, 2015). Moreover, bike-sharing systems station coverage areas often tend to cover disproportionately richer and more affluent neighborhoods in the central areas of cities (Goodman and Cheshire, 2014; Ricci, 2015). These characteristics raise questions such as do the benefits of these systems divide equally? Especially when bike sharing schemes are publicly funded, the benefits should distribute evenly to the citizens. The equality issue also relates to objectives of increasing overall popularity of cycling. It has been shown that the countries with the highest cycling modal share are those where different demographic groups are the most evenly represented among cyclists (Pucher and Buehler, 2008; Aldred et al., 2015). Bike-sharing systems are in any case evolving rapidly. Maybe the most disrupting change to the traditional systems, where the bike rental and the return happens through fixed bike stations, has been the rise of dockless bike-sharing systems. Dockless systems, used with a mobile application, have challenged traditional systems as they allow users to leave their 2
11 bikes anywhere inside the system borders instead of a fixed location docking station. These dockless systems became first popular in major cities in China and are now launched in increasing numbers in cities worldwide (Shen et al., 2018). Another change, which is already reaching bike-sharing systems, has been the rise of e-bikes. Increasingly cities are launching systems with electronic shared bikes (Fishman, 2015). These bikes are usually pedal assisted, which make the physical effort of pedaling easier. The third change has come along with the advancements of sensing technologies as the number of sensors that can be integrated to shared bikes have increased significantly. Different sensors can produce a wealth of data of cycling trips and cyclists themselves by sensing, for example, weather, air quality or heart rate during the ride. (Romanillos et al., 2016). Wide deployment of bike-sharing systems by cities, improved availability and variety of data, and the fast-paced evolution of these systems has not gone unnoticed in research. Academic interest towards bike sharing has been remarkable. As the literature statistics in this study show, the amount of academic literature relevant to bike-sharing systems has soared almost exponentially in recent years. Great need for information both globally and locally has been combined with an improved access to operators trip datasets. This development has led researchers from many fields to engage with bike sharing and has contributed to improved understanding of bike-sharing systems. Understanding of how different user groups use bike-sharing systems is still inadequate. According to Vogel (2014), there are very few studies that use operators trip databases to uncover systems user behavior. Consequently, there is still a need for contributions related to bike-sharing systems users and especially how different users trip profiles differ. Not only can this information help traffic and urban planners to better understand bike-sharing systems, but it can also provide hints what might be the reasons why some systems are more popular than other systems and to determine are systems used evenly by citizens. Applying a user-centric perspective is also helpful in shifting the focus from the system-wide perspective to those who are using the system and to their characteristics (Vogel et al., 2014) In Helsinki, the current bike-sharing system was only opened in The system has appeared to be very popular among the citizens in terms of how many trips are done every day and it is widely considered as a success by the operator and public opinion. The experiences from the Helsinki system have also led many other cities in Finland to launch or at least consider launching their own systems. However, as the system in Helsinki, has 3
12 not been in operation for long, the user demographics and the usage patterns are not well studied yet. Out of the academic works, there has been only the master s thesis work by Raninen (2018), which has used the journey data from the Helsinki system. The work focused to the spatio-temporal patterns of rentals from the bike-sharing stations during the operating season of Furthermore, in 2013 before the system was launched, Jäppinen et al. (2013) studied the potential effect of bike-sharing system to public transport travel times. THE RESEARCH PROBLEM In this study, I try to reduce user-related knowledge gaps by studying the bike-sharing system users in Helsinki. My primary research questions in this study are the following: 1) How does the international scientific literature recognize and discuss bike sharing systems? - 1.1) What are the main topics of study? In which research fields and in which geographical areas bike-sharing systems has been studied? - 1.2) What kind of data has been used in the analyses? 2) Stemming from the literature review, how equally the bike-sharing system of Helsinki is serving the citizens? 3) How different user groups use the bike-sharing system in Helsinki in terms of spatial and temporal patterns? To what extent do these patterns differ? To answer these research questions concretely, I carried out first an extensive and systematic literature review which follows up the two earlier literature reviews on bike sharing published by Fishman et al. (2013) and Fishman (2015), but which also extends the scope of the two earlier works. To the author s knowledge, this study is the first effort, which has extensively quantified bike-sharing study topics. The systematic literature review allows me to identify critical and relevant discussions on bike-sharing users and address these issues in the empirical part of this study from the context of Helsinki. The system in Helsinki has been undeniably a success based on the usual metrics such as how many trips are taken per bike per day. But how equal is the use, and is 4
13 the most usage generated by a larger or smaller group of people? My aim is to uncover user patterns and find out who and which groups have used shared bicycles in the city. To reach this aim, I have analyzed a dataset containing all the bike-sharing trips in Helsinki in By uncovering the user and usage patterns with the data, I seek to understand how equally the system has been used and how well the system has connected to public transport, which have both been very topical issues in the scientific discussion on bike-sharing systems. This knowledge can also help further developing the system in Helsinki. The rest of this thesis is structured as follows. Chapter two will set out the theoretical background and the framework for this thesis. In the third part, the study area and the local cycling conditions in Helsinki are introduced, which will be followed by the fourth section focusing on the data and the methods of this work. The fifth chapter presents the results of the systematic literature review while the following sixth and seventh chapters focus on the results of data analysis, first by providing an overview of the trip dynamics (chapter 6) and then moving on to users and their usage patterns (chapter 7). The last part concludes the work by placing the results into a wider context and discussing the importance of findings, giving also suggestions for bike-sharing planning and further research. 5
14 2. BACKGROUND SPATIAL MOBILITY Concept of spatial mobility A central concept of this work is spatial mobility, which Kaufmann et al (2004) has described as geographic displacement, i.e. the movement of entities from an origin to a destination along a specific trajectory that can be described in terms of space and time. In the 21 st century, the role of mobility for contemporary societies has increased dramatically as everything from people and goods to information seems to be mobile and the new mobilities paradigm has become prevailing in social sciences. (Sheller and Urry, 2006; Bertolini et al., 2008). Spatial mobility of humans has been studied for a long time, and this work places on the continuum of person-based mobility studies, the theory background of which originates from Torsten Hägerstrand s time geography (Hägerstrand, 1970). People move daily in time and space within certain constraints. These constraints limiting individuals possibilities include: 1) capability constraints i.e. how far and long one can go in time and space, which relates to available transportation options, 2) coupling constraints i.e. which activities one can participate in as it is only possible to be physically present in one location at a time and 3) authority constraints i.e. where one is allowed to go as some locations might be restricted by public or private authorities (Hägerstrand, 1970; Miller, 2005). An individual s personal time budget also limits how far the movement can extend (Miller, 2017). Movements or paths can then only happen within the individual s potential path space, which represents the accessible area for an individual s movement accounting constrains and time limitations (Miller, 2017). Potential path spaces can be visualized with space-time prisms introduced by Hägerstrand (1970), which are still widely used today in mobility studies (see e.g. Neutens et al., 2008; Miller, 2017). When considering a time period longer than a single day, it becomes clear that the movements of an individual are usually not random but highly predictable across populations (Song et al., 2010). The daily movement of humans shows high regularity both temporally and spatially with significant probability to return to a few frequent locations typically related to home and work (González et al., 2008). In fact, studies have shown that clear temporal patterns of human activity can be distinguished at different intervals of time (e.g. 6
15 hourly, daily, weekly, monthly) (Sevtsuk and Ratti, 2010; Järv et al., 2014). However, human mobility patterns exhibit strong intrapersonal variability, meaning that individuals movement patterns are always unique and to some extent explained by their personal attributes (Pas and Koppelman, 1987; Järv et al., 2014). The mobility patterns of individuals seem also to fluctuate both in shorter and longer time periods due to reasons attributed to nature (e.g. time of the day or season) and society (e.g. opening hours of services, public transport timetables) (Schoenfelder and Axhausen, 2010; Järv et al., 2014). Variability in mobility patterns not only appears among individuals but also among cities as the temporal rhythms of cities differ from one another and each city has its own unique characteristics and cultures (Ahas et al., 2015). The aim of person-based mobility studies is to better understand these differences and patterns of mobility from the perspective of individuals. Spatial mobility in urban areas Urban areas are complex systems with a great number of factors from urban form to infrastructure, behaviour, technology and regulations affecting individuals travel behaviour and choices (Ewing and Cervero, 2010; Batty et al., 2012; Naess, 2012). The existing mobility patterns in a city are a consequence of historical development and the decisions and policies taken since the city first was established. For example, whether the policies have spurred or prevented urban sprawl and whether there have been investments into large public transport infrastructures like metro and train lines (Naess, 2012). Essentially, these decisions have shaped whether the typical travel distances encourage taking active travel modes like walking and cycling or whether the city promotes car dependency. From this perspective, mobility patterns in every city have evolved to some extent as unique and every city is unavoidably developed within the limits of its historical legacy. Currently, urban planners in cities face a difficult dilemma in their task to promote urban mobility that should be at the same time environmentally sustainable, socio-economically equal and economically cost-efficient goals that are often conflicting with each other (Campbell, 1996). Rapid evolution of mobility is adding further complexity to the planning equation. Novel ways of transportation such as bike-sharing systems and other shared transport modes together with an increasing automatization for example in the form of selfdriving cars are changing urban mobility already at present and likely even more in the future (Burns, 2013; OECD, 2015; Kamargianni et al., 2016). Anticipating this change and directing it to a desired direction is an extremely tough but critically important task to 7
16 advance sustainable urban mobility. Research has a key role in the face of this challenge. Detailed data on individuals movement patterns aggregated to a population level can deliver both general and area-specific knowledge, which is applicable to local context but can also support the global information need. Mobility data revolution To this day, the limiting factor of person-based mobility studies has been the lack of broadscale data of actual human movements. The development of information and communication technologies (ICT) and the consequent data revolution, however, have brought a fundamental change. There are now increasing possibilities and novel data sources that allow studying spatial mobility and daily movements of people on a broad scale (Batty et al., 2012; Kitchin, 2014). This development has decreased dependence on traditional travel surveys, which have their limitations, especially in relation to the sample size (Ahas et al., 2015). Usage of mobile phone data from cellular records has been one of the most prominent directions in the mobility research (see e.g. Ahas et al., 2010; Calabrese et al., 2010; Järv et al., 2017). Another emerging data source has been social media, where users often share the content together with location information, thereby revealing their whereabouts (see e.g. Steiger et al., 2015; Heikinheimo et al., 2017). Thirdly, location data from GPS tracking sensors, which now are ubiquitous in mobile phones and other devices have offered possibilities to explore human mobility patterns (see e.g. Laube et al., 2005; Tenkanen, 2013; Shen et al., 2018). Cycling has been one of the best examples in the scope of spatial mobility and transportation research where improved data availability and versatility has met the great societal need for knowledge. Traditionally, cycling has been researched using user diaries, manual bicycle counts and GPS tracking from volunteers. These sources have been in many ways limited and not been able to give a full overall picture of cycling and cyclists. With the advent of novel and in many cases large data sources, this situation has changed and there are now increasingly available cycling data from bike-sharing systems, sports tracking applications and even from social media (Romanillos et al., 2016). Extracting insights from broad-scale mobility data It is not a surprise that many receive these large and continuous records of movement data, which are often precise both temporally and spatially, with enthusiasm and optimism. These datasets appear even more appealing when movements can be combined with a demographic 8
17 information about the moving individual, for example the user. Large mobility datasets have a high potential to shed light into city dynamics and into movement patters of individuals and population groups. Having said that, there are inevitably biases and limitations with these data sources in their availability and accessibility, demographic representability and/or locational reliability. For instance, in cycling research sports tracker applications are often found to be biased towards youngish male users who do not fully represent cyclists in general (Romanillos et al., 2016; Tarnanen et al., 2017). With bike-sharing systems the challenge has been that in majority of cases they do not record the actual routes but only the origins and the destinations of trips (Romanillos et al., 2016). An additional challenge is the data privacy that needs careful consideration when working with datasets that reveal precise information on individuals movements and locations. Furthermore, automatically produced datasets tend to be messy and complex, containing a plenty of irrelevant noise. Data need to be cleaned, pre-processed, selected, mined, and interpreted before any meaningful information can be extracted. This process is sometimes referred to as geographic knowledge discovery (GKD) (Miller and Han, 2009; Tenkanen, 2017). The process is iterative, requiring reformulation of hypotheses and theories as well as further processing and mining of data when new knowledge is acquired (Miller and Han, 2009). In every stage of this process from data production to analysis, there is uncertainty involved related to functioning of algorithms that are selected and used. While the production of large datasets and their handling would be impossible without these underlying algorithms, they inevitably shape the results and create potential sources of error (Kwan, 2016). These errors can accumulate and lead to inaccurate results. In order to extract robust results from broad-scale mobility datasets, it is necessary to be conscious about the role that algorithms have in shaping the data and interpret the results with caution. Lastly, the data and the results need to be visualized in a meaningful and informative way to convey the findings. Presentation of millions of records, for example individual movements, often pose challenges from the visualization perspective. The data may contain hidden patterns that need specific visualization techniques to become visible. Many researchers have acknowledged this challenge with mobility data and in the field of mobility studies, visualization of spatio-temporal data in an active study branch (see e.g. Andrienko et al., 2010; Guo et al., 2012; Beecham and Wood, 2014). 9
18 From the perspective of this study, cycling related datasets often contain trajectories of some sort. The trajectories can go along a network when extracted from GPS-measurements or be simplified straight lines between the start and the end point. Before useful movement patterns on a collective level can be extracted from these trajectories, the right technique to process and present the data needs to be chosen. Different clustering techniques and flow maps have been proposed to visualize bike sharing data and present trajectories of bike sharing users (Zaltz Austwick et al., 2013; Zhao et al., 2015; Levy et al., 2017; Yan et al., 2018). These techniques among others have advanced the field by bringing more approaches available to discover spatio-temporal patterns of bike sharing usage. In conclusion, there are now increasingly mobility data available as well as novel techniques and approaches for handling and visualizing this data. These advances enable the study of spatial mobility and cycling in completely novel ways. However, large mobility datasets as discussed above often raise technological issues and pose challenges related to data quality, and ethics and require sufficient technical skills. It is necessary to address these challenges when carrying out research using big mobility data. CYCLING AS A FORM OF MOBILITY Cycling has revived from a neglect to a competitive option for urban transport during the last decades and is being promoted again by planners and politicians. Excessive emissions, traffic jams and the lack of space, together with economic reasons and health problems due to physical inactivity of population, have all contributed to this major mental change (Pucher and Buehler, 2008; Handy et al., 2014). The modal share of cycling has increased in most major cities in Europe and North America (Pucher and Buehler, 2017). However, the shares of cycling are still small in most cities and vary considerably. At lowest, only 1-2 % of all trips seen for example in London and Chicago are made by bicycle while in cycling cities like Copenhagen and Amsterdam over 30 % of all trips are taken by cycling. (Pucher and Buehler, 2017). Popularity of cycling also varies greatly between countries and even between municipalities inside countries (Rietveld and Daniel, 2004). What is common, however, is that cities all over the world have increasingly started to search and implement policies that would improve the modal share of cycling in transport (Handy et al., 2014) 10
19 Factors affecting the use of bicycle Countless reasons affect an individuals choice to use a bicycle for transport instead of other transport modes. Rietveld and Daniel (2004) have classified these reasons to the following categories 1) socio-cultural and individual reasons (e.g. income, gender, age, image of bicycling as a transport mode, cultural background), 2) generalized costs of bicycling (e.g. monetary, travel time, risk of injury, risk of theft) 3) generalized costs of other transport modes (e.g. parking costs, fuel costs, supply of public transport services) and 4) local authority initiatives (e.g. quality and capacity of cycling infrastructure, spatial design of the city / land use, pricing of private car use). All of these categories affect the probabilities of choosing cycling but they also affect each other as local policies can impact the costs of cycling and the costs of other transport modes. There is clear evidence that most cyclist, both private and bike-sharing users, are primarily motivated by convenience and travel time savings and to a lesser extent by positive environmental and health benefits that cycling promotes (Heinen et al., 2011; Fishman et al., 2013). Apart from personal reasons and natural reasons (e.g. hilliness and weather), studies have found some of the key factors, which in most cases are positively associated to transport cycling and that can be influenced by local policies (for a review, see Handy et al., 2014). Availability of cycling infrastructure, which directly links to the convenience and perceived safety has been found to have a significant effect (e.g. Broach et al., 2012; Buehler and Pucher, 2012; Heesch et al., 2015). Distance, which reflects the urban form and how competitive option cycling can be in terms of travel time, has been another crucial factor (Heinen et al., 2011; Broach et al., 2012). Bicycle parking facilities have also been found to higher the odds for cycling to work (Buehler, 2012). Furthermore, the cost of alternative modes affects cycling either positively or negatively (Buehler and Pucher, 2012; Handy et al., 2014). For example, whether there are parking fees or tolls in force or whether there is a strong financial public support to public transport or car parking. Equity of cycling Increasingly attention in academic research and urban planning has been paid to the equity of cycling. On the one hand, cycling is one of the most equal transport modes due to its affordability. On the other hand, in many countries cyclists are dominantly younger men, with women and elderly people often underrepresented among cyclists. 11
20 It has been shown that in countries with high levels of cycling, the gender and the age balance is often quite equal while in low-cycling level countries males and younger adults often strongly dominate in cyclists shares (Handy and Xing, 2011; Harms et al., 2014; Aldred et al., 2015). Several explanations have been offered to explain large demographic differences in cycling shares. In the case of women s participation, Aldred et al. (2015) classified the typical explanations into three categories based on existing evidence; trip characteristics, cultural norms, and infrastructural preferences. Trip characteristics referred to the explanations that women tend to do more multi-purpose trips with several stops or might more often carry heavier objects, like babies, which might make their trips less cycleable (e.g. Dickinson et al., 2003). Cultural norms were related to the common image of cycling being a travel mode for young and sporty men, which might make it less attractive for women (e.g. Garrard et al., 2012). Infrastructural preferences referred primarily to safe conditions for cycling and interaction with motor transport as women have been found to be more impacted by perceived cycling safety (e.g. Garrard et al., 2008; Emond et al., 2009). As for the age inequalities, they are similarly present in countries with low cycling levels while in countries with more mature cycling cultures, older age groups tend to have shares similar to their overall representation of population (Aldred et al., 2015). As with women, the reasons for lower cycling rates among elderly population can relate to cultural norms (i.e. image of cycling) and infrastructural preferences (i.e. safety reasons) but also other reasons might be important, for example in the case of bike-sharing systems, elderly can more easily be late-adopters of these technologies. (Bernhoft and Carstensen, 2008; Rissel et al., 2010; Aldred et al., 2015). Even the connection between demographic profiles and cycling popularity is not so straightforward. Aldred et al. (2015) showed in the case of UK, that even after cycling had increased its popularity in the country, the relative representation of females had remained the same and the representation of older adults decreased. There is little research from other countries to validate whether this phenomenon also appears in other low-level cycling countries. It is nonetheless possible that cycling inequalities only slowly decrease over time together with changing cultural norms, improving infrastructure and technological developments of bikes (e.g. electric and cargo bikes). 12
21 Integration with public transport Another emerging topic in cycling research has been the integration of cycling with public transport. While public transport provides an alternative for private car, its competiveness in travel time is often inferior to car travel as public transport is fixed to stations or bus stops (Salonen and Toivonen, 2013). Integrating public transport more closely with cycling in multi-modal trips offers a competitive option for car transport. This way cycling, which is fast and flexible for short and middle distances, supports public transport in access and egress trips. Kager et al. (2016) even suggest that the cycling and public transport combination should be seen as a distinctive travel mode extending the normal perspective of cycling being only a feeder for the public transport. They show, using an example case from the Netherlands, that when combined, characteristics of these two travel modes provide strong synergy. As with overall cycling, cycling is integrated far more with public transport in countries with high cycling levels compared to those with lower ones (Cervero et al., 2013). Integration between the travel modes is usually promoted by improving bicycle parking facilities, bicycle-rental availabilities and possibilities to take bicycles into buses and trains (Pucher et al., 2010). Some concerns have been expressed whether increases in cycling would substitute more public transport than private car trips (Singleton and Clifton, 2014). There has been indication that in short distances cycling indeed may compete with public transport, although some studies have suggested that a better integration of these two modes, increases the use of both public transport and cycling (Martens, 2007; Heinen et al., 2010; Buehler and Pucher, 2012). In longer distances, however, it s more evident that the strengths of both modes of transport support each other (Kager et al., 2016). The relation between public transport and cycling seems also to change over time in a positive direction. Singleton and Clifton (2014) conclude from USA that public transport and cycling have benefited each other in the long-term even if increases in the use of one mode might have caused temporary decreases in the other. Studies focusing on users who combine bicycling and public transport in their travel are not many. Martens (2007) studied bike-and-ride users in three European countries, the Netherlands, Germany and UK and found strong similarities in the users travel motives, travel distances and impacts of car availability. One notable finding in the study was that 13
22 faster public transport modes (trains and intercity buses) had considerably more bike-andride users than slower modes (trams and local buses). The trip purpose of the users was mainly work or education and the cycling distances were not more than 2-3 km in most cases for slower and 2-5 km for faster modes public transport modes (Martens, 2007). Heinen and Bohte (2014) studied the attitudes of bike-and-ride commuters and found that they were significantly different compared to single-mode users in their attitudes towards car, public transport and bicycle. The attitudes largely explained their choice of combining cycling and public transport. Recently, a substantial amount of the literature focusing on cycling and public transport integration has examined how bike-sharing systems affect public transport. These systems directly tap into the discussion of the integration between cycling and public transport. Usually, bicycle availability at the stop or station is one of the major problems in public transport and cycling integration. Shared bicycles offer a solution for this particular problem. This way they can make multi-modal trips, which integrate cycling and public transport, both faster and more convenient than earlier. BIKE-SHARING SYSTEMS AS PART OF URBAN MOBILITY Principle Bike-sharing systems provide rentable bicycles for usually short-term use within a city area against a small fee or free of charge. The simple principle of bike sharing according to Shaheen et al. (2010) is that individuals use bicycles on an as-needed basis without the costs and responsibilities of bike ownership. The bike is typically rented from a docking station and usually the system allows that the bike can be returned to any docking station within the system area if there are multiple stations. With most systems, users can decide whether they subscribe the right to use the system for a certain period (e.g. yearly, monthly) or whether they pay the single rental price. The rental periods also vary, but in most systems allow users to rent a bike at least for 30 minutes without extra costs (Parkes et al., 2013). The bikes are rented and returned on a self-service basis, but the maintenance of bikes and stations is taken care by an operator. A vital part of a well-functioning system is the redistribution of bicycles, which is taken care by the operator. The balance between departures and returns during the day tends to vary between stations, which leaves some 14
23 stations overloaded and others empty. There are different models of provision and financing bike-sharing systems. Systems can be operated by different actors such as governments, transport agencies, universities, non-profit groups, advertising companies, private companies or combinations of these (DeMaio, 2009). For financing, there are also different models depending whether the systems are targeted to create profit or not (DeMaio, 2009). As Shaheen et al. (2010) put it, the ultimate goal of bike sharing is to expand and integrate cycling into the transportation system so that cycling can more easily become a daily mode of transport for citizens. One of the most important functions of bike-sharing is that it offers a mobility option for the first and last-mile for short journeys that are still considered too long to walk (Shaheen et al., 2010). This way, the systems extend and support especially public transportation systems by making total journeys faster and more seamless. What also makes bike-sharing distinctive from an urban mobility perspective, is the lack of mode ownership by users. With the fee, an individual can have the access to use bikes without the need of maintenance and repair. History There have been three generations of bike-sharing systems (DeMaio, 2009). Originating from 1965, the first bicycles where left for public use in Amsterdam. Only during the last two decades, however, the bike-sharing systems have really started to thrive. The first two generations suffered from theft and vandalism, as the users were typically anonymous and not tracked in any way, and the bicycles were either free or rented by a coin deposit. The third generation of shared bicycles started to appear in the mid-1990s with improved user tracking and other IT enabled solutions, such as electronic docking stations and automatic credit card payments. However, only after the success of shared bicycle systems in Lyon (opened in 2005) and Paris (opened in 2007) have these systems spread rapidly to cities all over the world. (DeMaio, 2009). The total number of bike-sharing systems has risen to over 2100 (Meddin, 2018). Currently, fourth-generation systems are taking root and becoming more common. Some of the newly emerged features are smartphone- and GPS-enabled hiring and tracking of bikes (Shaheen et al., 2010). These new features have decreased the need for docking stations, as well as enabled seamless integration of shared bikes and public transport by smart travel cards. Technological advancements have also enabled increased collection of data from shared bicycles, which have helped operators to manage them better. 15
24 User profiles Demographic profiles of bike sharing users have been of interest to many researchers. Based on existing evidence, users are often more likely to be male, young adults and of higher economic and educational status (See Fishman, 2015; Ricci, 2015 for comprehensive reviews). Ricci (2015) notes that especially in low-level cycling countries, bike-sharing systems seem to reproduce similar patterns of unequal participation that are associated with cycling in general. It must be noted that there are still notable differences between countries and systems. The finding that users tend to be wealthier than average population is quite consistent across studies and cities (Fishman et al., 2014; Woodcock et al., 2014; Ji et al., 2017; Raux et al., 2017). This phenomenon relates strongly to the coverage of bike sharing schemes, as the stations are often located in higher income neighborhoods and urban core areas. According to Ricci (2015), geographical location is the key factor explaining why bike sharing attracts wealthier users. They add that operators often locate stations to active areas to maximize the use, which further repeats unequitable usage patterns. With inclusive system planning, it is however possible to attract a more diverse representation of users. Goodman and Cheshire (2014) studied how the expansion of bike sharing scheme to poorer areas affected the system use in London. They found that the representation of underrepresented users, in this case females and the population living in poorer areas, rose after the expansion, although these groups remained underrepresented. Similar to overall cycling, bike-sharing systems seem to attract usually more male than female users. In some cases, like in London and Dublin, the share of women has been around 20 % of all users (Goodman and Cheshire, 2014; Murphy and Usher, 2015). On the other hand, in countries with a more mature cycling culture, women seem to be better represented as shown in Ningbo, Seville and Lyon, where the share of female users were 38 %, 38 % and 43 % respectively. There has also been a study from Montreal, where the likelihood of being a user was found to be equal between men and women. (Fuller et al., 2011). However, few studies have reported how the shares of trips match to user demographics. The typical age of a bike-sharing user is shown to be skewed towards younger adults. For example, Raux et al. (2017) showed that in Lyon, 56 % of the system users were under 30 years old. In London, 78 % of the users were aged between 15 and 44 while in Dublin, 59 % were between the ages of (Woodcock et al., 2014; Murphy and Usher, 2015). 16
25 Although there is clear evidence that age is an important factor in terms of demographic differences of bike sharing, it has gathered less attention from researchers compared to differences in gender and ethnicity. What is interesting is that regardless of the abovementioned socially unrepresentative user patterns of bike-sharing systems, these patterns seem to be stronger among overall cycling. Buck et al. (2013) showed that the users of the Washington bike sharing scheme were more likely to be women, young and less wealthy compared to general cyclists. Only 29 % of them owned a bike, whereas 94 % of cyclists in general possessed a bike. This result might imply that bike sharing can attract new people to cycle. Trip patterns of different user groups Usage patterns of different user groups has been an overlooked topic in bike-sharing research. Many studies have focused on overall trip patterns of bike sharing users both spatially and temporally, but in most cases, scholars have not tried to separate users into groups based on their characteristics (e.g. age/gender/home area). Some prior studies, however, have focused on users or done at least some analyses to shed light on use profiles. Vogel et al. (2014) conducted one of the most comprehensive studies in this respect. They created a typology of bike-sharing users in Lyon by clustering the users into nine groups based on their weekly and annual bike use activity. They found that 65 % of the users belonged either to irregular or moderate user clusters. This finding of irregularity of most users has also been found in other studies (Fishman, 2015). Furthermore, Vogel et al. (2014) showed that there were some demographic differences between activity clusters. Regarding the spatial variation of users, 84 % lived inside the bike-sharing system area, 7 % outside but still within the urban area, while 9 % of users lived further away. These shares were clearly different to London, where Beecham and Wood (2014) found that only 37 % of the users of the local system lived within 5 km from the closest rental station. According to the results by Vogel et al. (2014), spatial location was not an important factor in the cluster analysis, to which the authors of the paper commented that districts might not be meaningful for analyzing the spatial distribution of users as they are too wide. One typical aspect where bike-sharing users often split into two or more divergent use pattern groups is their subscription type. Vogel et al. (2014) analyzed Lyon s data and revealed that 67 % of the users were annual subscribers whereas 15 % had a weekly and 18 17
26 % a daily subscription. Zhou (2015) and Zhang et al. (2016) compared differences between subscribers and customers in Chicago. They found that subscribers closely followed the typical weekday use pattern with morning and afternoon use spikes, while customers had a typical weekend use pattern with even rental distribution between 10 am and 8 pm. Furthermore, subscribers use decreased significantly during the weekends. Their most popular origin and destination stations varied too, as customers top rental stations were concentrated close to major sightseeing attractions, while subscribers tended to rent their bikes close to large population areas (Zhang et al., 2016). In respect to gender differences, studies indicate that men use bike-sharing systems differently than women. Vogel (2014) showed that men were overrepresented in the cluster of very active users while among the groups of moderate use activity, the gender balance was more equal and that women were more often sporadic users in Lyon. Women have also been found to make longer trips compared to men both on weekdays and weekends (Zhou, 2015). Beecham and Wood (2014) studied gender differences in London with bike sharing data and found that spatial structures of trips between men and women differed and that women preferred areas with slower traffic roads and cycle paths. This finding is consistent with studies of overall cycling, as women seem to be somewhat more safety-oriented in terms of cycling routes. Relationship of bike sharing and public transport Several studies have attempted to shed light into the relationship of bike-sharing systems and public transport. The main question here has been whether shared bicycles are more of a substitute or an extension for public transport. What seems to be clear in the literature is the strong connection between bike station activity and proximity of public transport hubs like metro or railway stations. Usually those bike stations, which are located near these hubs, have more activity. This pattern was observed, for example, in London, Paris and New York (Nair et al., 2012; Goodman and Cheshire, 2014; Noland et al., 2016). A recent research by Shen et al. (2018) also found similar relationship of high bicycle usage near public transport hubs using trip data from dockless bike-sharing system in Singapore. These results imply that many people tend to combine public transport and shared bicycles in their trips supporting the hypothesis that bike sharing would indeed work as the first and last mile solution complementing public transport. 18
27 Some studies have examined how large a share of bike-sharing trips are multi-modal and which are the transport modes shared bikes are combined with. In Dublin and Montreal, the majority of the trips were cycling-only while around 40 % of the trips in both cities were multi-modal (Bachand-Marleau et al., 2012; Murphy and Usher, 2015). Railway and subway were clearly more often integrated with bike sharing than bus. Quite similar results were obtained from Barcelona where 30 % of the trips were integrated with public transport (Anaya and Bea, 2009). In Washington, the metro stations were important origins and destinations for shared bicycle trips (Ma et al., 2015). A study from Nanjing emphasized the importance of the direction as there the railway stations were important destinations, but not so strong departure hubs for bike sharing trips (Zhao et al., 2015). Bike stations near metro stops were typical destinations also in Chicago especially for regular members of the system (Faghih-Imani and Eluru, 2015). Travel time has given some indication of the relationship between bike sharing and public transport. Jäppinen et al. (2013) studied the potential effect of a bike-sharing system to public transport travel times in Helsinki before the system was actually launched. They found that introduction of bike sharing would be able to reduce public transport travel times on average by 10 % or in time by 6 minutes. This was a promising result in regard to public transport competitiveness. McBain and Caulfield (2017) found that the bicycle rental stations with a higher number of public transport links were indeed associated with travel times that were close to optimal travel time to a given route between two stations. The result indicates that multi-modal users prefer quick trips that support for example commuting, as this way, they can cut some of their travel time. An important topic in literature in relation to public transport has been the degree of modal shift that occurs after bike-sharing systems are implemented. Users that start to use bikesharing systems clearly substitute other modes of transport in the process, but whether they are substituting walking, public transport or car travel is a matter of great interest, as it is directly linked to how well bike sharing supports sustainable mobility and decreases transport-related carbon emissions. Current evidence shows that most users are taking a shared bicycle instead of walking or using public transport. Fishman (2015) reviewed five studies that focused on modal shift and found that bike sharing users had overwhelmingly replaced either walking or public transport trips. The shares of those who had switched from public transport modes varied considerably 19
28 between cities from almost 60 % to 20 % of all users. Similar results were found by Fuller et al. (2013) from Montreal and by Murphy & Usher (2015) from Dublin, where 50 % and 36 % of the users respectively had replaced public transport trips. The majority from the rest had replaced walking. The effect of bike-sharing systems on public transport ridership is nevertheless not simple. Ma et al. (2015) reported from Washington that a 10 % increase in the average daily bikesharing ridership was positively and statistically significantly associated with a 2,8 % increase in metro ridership. Campbell and Brakewood (2017) found that daily bus trips in New York had decreased by 2,42 % after the implementation of the bike-sharing system. The results of Martin and Shaheen (2014) from the two cities in USA supported the latter, as they showed that among the people living in dense urban core areas, the use of public transport had decreased. However, they also found that in less dense environments, establishment of a bike-sharing system had added connections that supported public transport. In this way, the system had increased the use of public transport by people living in outer areas. As a conclusion, the relationship between public transport and bike sharing is complex. It is area-dependent, which means that the relationship might to some extent be city-specific and dependent on the characteristics of the city. The relationship seems also to be bound to the mode of transport as bus and bike-sharing are integrated far less than metro and bike-sharing. As the share of multi-modal trips in studied cities shows, there is nevertheless a great potential in deeper integration of bike sharing and public transport. 20
29 3. STUDY AREA The study area of this work is Helsinki, the capital of Finland, located south of the country on the Baltic Sea shore. The population of Helsinki in the beginning of 2017 was inhabitants but if the Greater Helsinki metropolitan area is included, the population reaches over , which is approximately 26.5 % of the total population of Finland (Helsinki Region, 2017). The downtown area of Helsinki is the largest and the most important workplace hub in the region and in the country. Approximately 41 % of those who are working in Helsinki were commuting from other municipalities in 2013, mainly from Espoo and Vantaa, which are the closest neighbors of Helsinki (Statistics Finland, 2013). The region is growing fast. It is estimated that by 2050, the population of Helsinki will grow by over people and the greater Helsinki region will have more than new inhabitants in the average scenario (Vuori and Laakso, 2017). The magnitude and speed of the growth will inevitably affect the daily mobility patterns as there are more people moving daily in the region. This means major challenges for the region s transportation system, which could not afford worsening traffic jams or increasing emissions. CYCLING AS PART OF DAILY MOBILITY IN HELSINKI Modal share Helsinki has gradually transformed into a more cycle friendly city. In 2017, 70 % of the citizens stated that they cycle at least sporadically (Helsinki City Planning Department, 2017). Modal share of cycling has increased slowly and is currently around 10 % of all trips within Helsinki, but the goal of the city is to further increase the share to 15 % by 2020 (Helsinki City Planning Department, 2017). While these numbers are still far away from the leading cycling cities in Europe such as Copenhagen and Amsterdam, where over 30 % of all trips are made by bicycle, the modal share of cycling in Helsinki is still one of highest among the European capitals (European Cyclist Federation, 2014). The region has also the highest shares of cycling in whole Finland (Liikennevirasto, 2018). Citizens attitudes reflect favorability towards cycling, as most people (96 %) are positive towards measures of promoting cycling (Helsinki City Planning Department, 2017). Apart from cycling, the overall modal share in Helsinki consists of walking (37 %), public transport (30 %) and car (22 %). According to these statistics, the transportation in Helsinki 21
30 seems quite balanced in terms of different transport modes, but if the perspective is extended to the Greater Helsinki region, the role of private car grows. Within this region approximately half of all trips are made by car (Liikennevirasto, 2018). Of commuting trips, car has a 32 % modal share, public transport 47 %, and cycling 11 % (HSY, 2015). For those people commuting to Helsinki from other municipalities, car is the dominating transport mode with the modal share of 61 % while public transport accounts for 27 % and bicycle 12 % (HSY, 2015). The distance has a strong effect to the chosen travel mode. For instance, around 75 % of the trips that are under 1 km are made by walking while of under 3 km trips, walking accounts around a third in the Greater Helsinki region (HSL, 2013). These numbers show that strictly within Helsinki, the sustainable modes of transport seem to be well represented but in the whole region, the transportation is more or less car dependent. The goal, set in the transport system plan for the Greater Helsinki region, states that mobility within the region will be based on sustainable travel modes such as cycling and public transport in the future (HSL, 2015). Based on the current situation, it is evident that the modal share needs to shift towards sustainable modes of transportation if this goal is to be achieved. Cyclists demographics and cycling patterns in Helsinki Based on the cycling barometer 2018, the demographic profile of general cyclists is balanced (Helsinki City Planning Department, 2018). In 2018, 53 % of the cyclists were female and 47 % female (Table 1). Inhabitants between years of age make most of the trips and they are somewhat overrepresented among cyclists compared to their demographic shares of the population. Most of the cyclists (64 %) live in the suburb areas while the rest live in the downtown Helsinki. The barometer, which provided the information on cyclists in Helsinki, is a survey, which might affect the results. Trip-based counts about cyclists demographic shares were not available to the author s knowledge. 22
31 Table 1. Cyclists shares in Helsinki by gender, age and area. Original table presented in Cycling barometer 2018 in Finnish (Helsinki City Planning Department, 2018) Translated to English. ALL INHABITANTS CYCLISTS ALL RESPONDENTS n= 2010 % n= 1182 % Gender Female % % Male % % Age group years % % years % % years % % years % % years % % Area Downtown % % Suburb % % A report published in 2017 examined cycling routes and fluency in Helsinki using a dataset of Strava sport application users (Tarnanen et al., 2017). The report found that the busiest cycling routes go along the major bike lanes towards the city center and the downtown in general is the most frequent origin and destination for the trips. There is temporal variation in the cycling patterns. The summer months are unsurprisingly the busiest due to warmer weather and clear roads. In 2015, August had the most cycling whereas in 2016, May was the top month. There is generally more cycling in the first days of the week than during the weekend, although the shares vary depending if the measure is based on the Strava application users or cyclist counts by automated and manual counters (Figure 1). Daily variation in cycling is nevertheless large. On an hourly level, the weekdays and the weekend days have different patterns. During weekdays, there are two spikes, one in the morning and one in the afternoon, whereas on weekend days the number of cyclists steadily rises from the morning onwards, peaks at the noon and then starts to decrease (Figure 2). 23
 in Finnish. Translated to English.")

32 Figure 1. Cycling trips by weekday in Helsinki based on Strava sport application and cycling counts data. Original figure presented in Tarnanen et al. (2017) in Finnish. Translated to English. Figure 2. Cycling trips by hour in Helsinki based on Strava sport application data from Original figure presented in Tarnanen et al. (2017) in Finnish. Translated to English. Cycling promotion in Helsinki The increase in cycling has been a result of conscious efforts by the city of Helsinki. The city has invested into better cycling infrastructure, of which the most visible example has been the opening of the cycling highways network called the Baana network. There has also been improvements in the winter maintenance of cycle paths and bicycle parking facilities not to forget the new bike-sharing system, which was opened in Helsinki in
33 The current cycling promotion plans include, for example, further extension of the cycling highways network, improvement of bicycle parking facilities and improvement of services targeted to cyclists, such as journey planners and bicycle self-repair facilities. (Helsinki City Planning Department, 2017). As part of cycling promotion, there has been an aim to increase the amount of people who combine bicycle and public transport in their trips (Helsinki City Planning Department, 2017). One tool to advance the aim has been a policy, introduced in 2018, which allows passengers to take their bike to the metro or train at all times of the day. Helsinki Region Transport has also planned to promote better integration of cycling and public transport by improving park and ride facilities near public transport stations and stops (Helsinki City Planning Department, 2017). PUBLIC TRANSPORT SYSTEM IN HELSINKI The public transport system in Helsinki is comprehensive. The local transport authority HRT (Helsinki Region Transport) is responsible of running local buses, trams, trains, metro and certain local ferries. The metro line is the backbone of the system in the east-west direction while towards north from the city center local trains provide important connections. Buses and trams cover directions where the metro and trains do not reach and provide an important access traffic mode to the train and metro stations. There are several important public transport hubs in Helsinki. The central railway station is the end stop for all the train connections and many buses being also located along the metro and several tramlines. The metro line also passes nearby Kamppi, which is the terminal for all the long-haul buses and many local buses. The Pasila station, located a few kilometers from the city center, has a function as an important access and egress station for all the train connections. Helsinki has invested into improvements of public transport considerably within the last decade. The best examples of this have been the train connection to the Helsinki-Vantaa airport opened in 2015 and the extension to the metro line towards Espoo opened in Generally, citizens are really satisfied with public transport in Helsinki. The satisfaction level of people was over 80 %, which was among the highest of European cities (European Comission, 2016). 25
34 HELSINKI BIKE-SHARING SYSTEM Coverage area The bike-sharing system in Helsinki was initiated in The system and its yellow bicycles often referred as urban bikes quickly became popular among citizens. At the beginning, there were 49 docking stations and 500 bicycles in total located in the downtown area of Helsinki. The system was expanded in the following year, which nearly tripled the number of stations to 140 and the number of bicycles to The expansion enlarged the coverage area of the system outside the downtown of Helsinki. The coverage area extended towards west again in 2018 when the neighboring municipality Espoo initiated its own system, which was technically identical to the Helsinki system. The implementation allowed that shared bicycles could be taken over the municipality borders without further costs or compatibility issues. The coverage area of the Helsinki system will further expand in 2019 with an addition of almost 90 new stations and nearly 900 new bikes (HSL, 2018a). In this study, the bike-sharing coverage area and the station coverage area refer to the area, which includes all the postal areas in Helsinki that have at least one bike-sharing station. As the Figure 3Figure 3 shows, the station network is dense and the distances between the stations are short. According to Raninen (2018), the guiding principle in the planning of the system has been that the distance between adjacent stations should be meters at most. This way the people who are living within the coverage area can access the station easily with a short walk. The stations are not distributed equally however, but there are more stations in the active areas of the city center as well as close to the cycle ways. 26

35 Figure 3. Bike sharing station network in Helsinki in System operation and use The local transport authority HRT operates the system in Helsinki, while the maintenance of the bikes is taken care by a local consulting company City Bike Finland. The scheme is tightly integrated to the local public transport system. The shared bikes can be used with a smart travel card, which is also used to access public transport in the region and there are bike-sharing stations next to every metro and train station that are within the system coverage area. The users can choose between daily, monthly and whole season subscriptions. If they choose the whole season, they need to register themselves before renting a bike. The normal use time is limited to 30 minutes, but up to 5 hours, users can exceed this time by paying 1 from every starting half-hour. Bikes are locked to an electronic docking station, which releases 27

.")
36 them once the user has given his subscription credentials to the electronic reader placed in the handlebar of the bike (Figure 4 & Figure 5. The left photo is showing the handlebar of a shared bike while the right photo shows a bike rack where shared bikes are locked. Photos by Elias Willberg Figure 4 & Figure 5. The left photo is showing the handlebar of a shared bike while the right photo shows a bike rack where shared bikes are locked. Photos by Elias Willberg Common problem with the system is the discrepancy between departures and arrivals in some stations (Raninen, 2018). This is by no means unique to Helsinki, but rebalancing is one of the biggest challenges of bike-sharing systems in general (Médard de Chardon et al., 2016). In Helsinki, there are two ways to handle this issue. Rebalancing trucks are running throughout the day and moving bikes from the stations of oversupply to the empty stations. Another way has been to allow overloading of stations, which means that the stations can recognize the bikes and change their status to returned even when the bikes are only close to the station, but not locked to the docking rack. This feature allows the user to return the bike to the station even when all the racks are occupied. Public reception of bike-sharing system The system in Helsinki has appeared very popular since it was opened in The operator of the system publicly highlighted during the spring 2018 that the system is relatively compared one of the most popular in the world when comparing by how many trips are made per bike per day (HSL, 2018c), which is typically used metric to compare bike-sharing systems. Even if this high metric in 2018 might have been partly a result of too few bikes 28
37 for the increased user base during that time, the bikes of the system have been undeniably used actively since the system was opened in 2016 (see the trip metric comparisons in Raninen, 2018). The public discussion and the news coverage about the system have also been very positive. One of the indicators of the success has been the remarkable rise of bike-sharing systems in Finland. Only after two years after the opening of the system in Helsinki, seven other cities in Finland have now opened a full bike-sharing system or are experimenting one, and several other cities have concrete plans to implement such a system in the near future (Tulenheimo, 2018). Bike-sharing user survey 2017 The operator of the Helsinki system published a user survey, which had been targeted to bike-sharing users. The online survey was sent to all registered users at the end of the 2017 season and had 7940 respondents (HSL, 2017). According to the survey, the users had mainly been satisfied with the service % of the users were likely to recommend the service to their friends. Most satisfied the users were to the condition of the stations and the moderate usage fee. The lowest ratings got the bike return to a full station and the process of buying a bike subscription from the station. In regard to integration with public transport, 53 % of the users stated that they had integrated public transport and bike sharing in their journeys while the rest usually took the whole journey only with shared bikes. Bike sharing had mostly replaced walking (70 %), tram (63 %) and bus (54 %) trips, but also personal bicycle (37 %), metro (38 %) and car (14 %) trips. Around every third (31 %) thought that the bike sharing had brought monetary savings while the rest mostly thought that they had not got savings (50 %) or even lost money (10 %). Time savings were more evident to the users as 69 % of them though that bike-sharing had saved their time. As for the deliberateness of use, 57 % had normally used bike spontaneously while 43 % had planned their rentals. 29
, which is the operator of bike-sharing system in Helsinki and 2) City Bike Finland, which is a local company maintaining and rebalancing the shared bikes in the city.")
38 4. DATA & METHODS DATA Characteristics of the bike sharing dataset The bike sharing dataset that was used in this work was jointly provided by 1) the local traffic agency Helsinki Region Transport (HRT), which is the operator of bike-sharing system in Helsinki and 2) City Bike Finland, which is a local company maintaining and rebalancing the shared bikes in the city. The dataset was from 2017 and it covered the whole operating season from May until the end of October ( ). It was provided in two equal sized csv-files, which contained every trip as one row. The total number of the records in the raw data was After the preprocessing and filtering of the data (see the method section 4.2.2), the number of records decreased to Figure 6 shows a snapshot of the bike-sharing dataset. The dataset was of origin-destination type containing information of each bike-sharing trip as well the basic demographic information of the user who did the trip (the full list of variables shown in the Table 2). Figure 6: A sample from the bike sharing dataset from Helsinki from Descriptive information on the trip is combined with the basic user demographic information. The columns containing unique ID information are masked. There were a few limitations in the data. Firstly, the last day of each month during the sixmonth period was missing. However, the missing data divided equally to different weekdays meaning that the lack of information did not skew the proportion of weekdays. Secondly, only those users, who had subscribed the whole season, had their demographic information included in the data. The total number of these yearly users was , whereas the total number of all users was Lastly, many users had not stated their gender, which resulted that the analyses based on gender were done with the trips records from users, who had given this information. 30
39 Table 2. Descriptions of the original columns in the bike-sharing dataset. COLUMN NAME COLUMN TYPE DESCRIPTION departure_time date The departure time of the trip return_time date The return time of the trip account number User's account ID departure_station1 number The departure station ID departure_station2 text The departure station name return_station1 number The return station ID return_station2 text The retun station name formula number User's subscription type (day, week, year) covered_distance number Trip length duration number Trip duration id number Trip ID uid number User ID hsl_formula number User's subscription type (day, week, year) hsl_postal_code number User's home postal code hsl_city text User's home city hsl_country text User's home country hsl_birthday date User's date of birth hsl_region text User's home region hsl_gender text User's gender Characteristics of other datasets Beside the journey data from the bike-sharing system, several other datasets were used in this study. The geographical locations of the bike-sharing stations in Helsinki were provided by HRT. The data contained coordinates and IDs for each station. The agency also provided a customer survey targeted to the bike-sharing users in Helsinki (7 940 respondents), which was used as a supplementary material (HSL, 2017). The survey focused on questioning users preferences and reasons for using shared bikes (more information in the section 3.3.4). Demographic data was also needed to proportion the number of bike-sharing users in a given postal area in Helsinki to the total population of this area. Hence, the postal area populations by the Statistics Finland (2017) were obtained. This dataset also allowed the examination of the age and gender profiles of the population in Helsinki to compare the general population demographics to bike-sharing users demographics. Finally, to carry out the shortest route network analysis (see the method section 4.2.2), a cycling route network was needed. MetropAccess-CyclingNetwork was used, which was based on the Digiroad data (Digiroad K), developed by the Finnish Transport Agency and further modified by Tarnanen (2017) to suit the cycling modelling in Helsinki. 31
 show the different phases of this work in more detail. Figure 7.")
40 METHODS This study had several phases. An extensive and systematic literature review was conducted before the data processing phase took place. Data was first preprocessed, then analyzed, and finally visualized. The following subchapters and the flow chart of the work (Figure 7) show the different phases of this work in more detail. Figure 7. The workflow of this study Systematic literature review To support and contextualize the results of this study in relation to scientific literature on bike sharing, a systematic literature review was carried out. Literature was first scanned by using a keyword search in the scientific literature search engine Scopus. The initial search contained the following keywords, which were also used in an earlier review study by 32
.")

41 Fishman (2013): bike sharing, bike share, bicycle sharing, bicycle share, public bicycle and public bike (Figure 8). The number of resulting documents with the search was Figure 8. The original search terms and date for the Scopus search.. Due to the large number of results, the search was limited to only contain the time period 1/2016-2/2018 (Figure 9). This time period was applied since prior literature relevant to bike sharing was extensively covered in Fishman et al. (2013) and Fishman (2015). The language of the studies was also limited to English. These limitations resulted to a more controllable number of studies as the number of results after the limitations dropped to 799. Both search results were descriptively analysed, and their statistics i.e. documents by year, document county/territory and subject area saved. Figure 9. The narrowed search terms and date for the Scopus search. The results of this query were selected for the systematic literature review. To answer to the study questions of what is being studied and where and what kind of data is being used in bike-sharing studies, the results were classified. The resulted 799 documents were examined one by one and classified by their aim if the document was accessible. The aim of the study, the data type, and the number of data records were classified into groups and the study areas were noted down from each study. In the case of the aim of study, it was possible for a study two get classified into two categories if the scope of the study did not fall only into one category. Once the review was finished, the classified results were analysed and visualized into graphs and tables. 33
42 Bike sharing data processing Software: The bike-sharing data in this study was managed and processed in several software, but one of the methodological aims was to take the advantage of growing capabilities of open source software. Python (version 3.4), an open source general-purpose programming language was used to carry out the data processing. One of the most useful features of Python is that it contains numerous third-party modules called libraries that can be integrated to the core software. These libraries extend Python s capabilities and have made Python a common choice for scientific computing. This study took the benefit especially from those libraries targeted for data manipulation, analysis and visualization. The main modules for these purposes that were used were Pandas, GeoPandas, NumPy and Matplotlib. The python codes used in this thesis are openly available at GitHub ( Statistical analysis of this work was carried out in SPSS, which is a software for statistical computing. Furthermore, two geographical information system (GIS) software were utilized in this work, mainly for map visualizations. Maps were done with QGIS (version 3.0), which is an open source GIS software, whereas the network analysis to determine the distances between the bike-sharing stations was conducted in Arc GIS (version 10.3) developed by ESRI due to its more suitable network analysis tool package. Preprocessing: The raw bike-sharing data was first merged into a single csv-file, which was then read into Python. Filtering was the first step to remove the most obvious outliers from the data. The data, for example, contained trips that were really short or had lasted under one minute. These trips are often caused by the malfunctioning of the docking station or the bike and do not represented real movements as noted by Bordagaray et al. (2014) in Santander, Spain. The filtering was also extended to unrealistically long or fast trips as well as stations that were not in public use or outside Helsinki. The following filters were thus applied: 34
43 Table 3. Applied trip filters to bike-sharing data Trip distance filter Filtered out the trips where the covered distance was less than 100 m and more than 70 km. Trip duration filter Filtered out the trips where the trip duration was less than 60 seconds or more than five hours (Five hours is the limit after which the user needs to pay a penalty fee). Trip speed filter Filtered out the trips where the trip speed was more Formula filter Station filter than 40 km/h Filtered out those users whose rental period was not day, week, or year, which are the options that a normal user can choose. Filtered out those stations that were not in Helsinki or were bike reparation or production facilities. After the dataset was filtered, the spatial component was integrated into the bike-sharing dataset. As the data was non-spatial as such, the location was derived by joining a dataset containing all the locations of bike-sharing stations as geographical coordinates. This join was possible as both datasets had a common column containing the station IDs. The join operation was performed twice to get the geographical location of both the departure and the return station for each trip. Calculation of new columns was the next step. The user age column was derived from the user s birthday, the weekday column from the departure time column and the speed column from the trip duration and distance columns. As the dataset did not contain information about the user s route, an interesting question was how much the covered distance of the trip differed from the theoretical shortest network route. For this purpose, a new difference column was calculated to the dataset. First, the theoretical shortest route was calculated in ArcGIS with the Closest facility tool that is part of the Network analyst extension. All the stations were assigned both as facilities and incidents while the number of searchable facilities was the total number of stations (i.e. 140). The underlying road network in the analysis was MetropAccess-CyclingNetwork, which was based on the Digiroad data (Digiroad K) by Finnish Transport Agency and further modified by Tarnanen (2017) to better suit for cycling analyses in Helsinki. This analysis resulted a table containing the shortest route distances along the network between all the stations. Once the theoretical shortest routes were obtained, a simple difference was calculated between the covered and the shortest distance for each trip. 35
44 The next step of the preprocessing was to group the dataset by users. Multiple new columns were derived from the original columns in this phase. These included, for example, the count of user s potential public transport trips, the count of user s trips that had been departed from the same station where the earlier trip had returned, and the standard deviation of user s station usage. The full list of variables used in the analysis phase with explanations can be found from appendix 1. Analysis and visualization: Once the dataset was filtered and preprocessed, it was ready for analyses. Descriptive analysis was carried out to see the most basic statistics for trips such as the mean trip speed, the mean trip duration and the mean trip length. Temporal patterns of trips were then analyzed on different time intervals (hourly, daily, weekly, monthly) to see the variation in the number of trips in time. Next, the spatial variation of trips was examined to understand, which were the most common routes of bike sharing users in Helsinki and in which areas the most trips had taken place. Similarly, it was important to understand the basic patterns of station usage, therefore the departure and the return counts for each station were mapped. After revealing the prevailing basic patterns of bike sharing trips the focus was turned to users. As with trips, the basic user statistics were looked at first. These were the mean usage activity as well as the cumulative use of the system. Users were then grouped into different categories based on their qualities. These qualities, available in the dataset, were age, gender, home postal area, use activity and the subscription type. Home postal area was further divided into two groups, for those who lived in the postal area with at least one bike-sharing station and for those who did not have a station in their postal area. All the different user groups were then examined to see how much variation there was in trip profiles between the groups. The demographic variation was also looked at for each variable to see whether, for example, active bike-sharing users were skewed towards a certain group of people. The variation of different variables within each user quality were visualized with box plots. Furthermore, the variation of users home postal areas was mapped against the total postal area population, to see relatively the most active neighborhoods in terms of bike-sharing users. Statistical analyses were also carried out. Binary variable user groups (gender and inside users/outside users) were compared to each other with t-tests to validate that the groups differed statistically significantly from one another. As the precondition of the t-test, 36
45 Levene s test was carried out to check for each variable the equality of variance between the tested groups. For user groups that had more than two populations (age group, subscription type, use activity), ANOVA technique was used with post-hoc tests. ANOVA analysis determined the total degree and the significance of variation between groups while post-hoc tests showed more in detail where the variation existed. Tukey s post-hoc test was selected due to equal variances that existed between the most groups. Finally, Pearson correlation matrix was produced out of the continuous variables in the dataset to determine possible correlations between variables. Finally, the results were compared to similar cycling and population data sources and reports from Helsinki (see Tarnanen et al. (2017) and Statistics Finland (2017)). This was done to 1) indicate validation for the methods how bike-sharing data was processed in this work and 2) to see how bike sharing users demographic shares differed from the general population shares and general cyclists patterns. 37
46 5. LITERATURE REVIEW ON BIKE-SHARING SYSTEMS CURRENT TRENDS The following three chapters will present the results of this study. This chapter focuses on the findings on scientific bike-sharing literature answering to the study questions of what is being studied and where and what kinds of data are being used. TEMPORAL AND DISCIPLINARY TRENDS IN BIKE SHARING LITERATURE Figure 10. Scientific literature on bike sharing by the publication year. The number of publications has become manifold during the last decade. The search was made in Scopus in Bike sharing has seen a surge of scientific interest during the current decade. The pace of published works has grown from approximately 50 records/year to over 400 records/year during the last decade as the Figure 10 shows. The results are worth a few note however. First, the literature search returned also results that were not relevant to bike sharing. Secondly, the volume of scientific publication in general has increased from the 1970 s to this day. But even when accounting these notes, the trend is clear, bike sharing is increasingly getting attention from many directions. The start of this upward trend sets around mid-2000s, which coincides with the openings of the two major bike-sharing systems in Lyon and Paris. whose popularity have inspired more cities to deploy similar bike-sharing systems. The 38

47 graph also shows a small spike in 1995, which coincides with the year when the first broadscale bike-sharing systems was opened in Copenhagen. The spectrum of fields that are represented extends to many different domains. Social sciences and engineering publish most of bike sharing relevant literature but other fields like computer science, medicine and environmental sciences all have their shares as well as multiple other fields. (Figure 11). It is clearly visible from the figure that bike sharing is not only seen as a matter for transport research, but it offers a multitude of research topics, many of which link to wider societal issues. Figure 11. Published scientific literature on bike sharing by subject area. The publications are being made by multiple disciplines showing the multidisciplinary nature of bike sharing as a study topic. TOPICAL TRENDS IN BIKE SHARING STUDIES This study conducted an exhaustive literature review to identify different branches and topics of recent bike-share-related studies between 1/2016-2/2018. Altogether 413 studies out of 799 were classified being relevant to bike sharing and 275 of these were directly linked to bike sharing. Approximately a third of the classified studies were focused on cycling but not directly to bike sharing. Bike sharing relevant studies nevertheless cover a wide variety of different topics and objectives (Table 4). System-wide analyses are the most common topic among the bike 39
48 sharing relevant literature followed by the studies focused on bike-sharing usage. Within the system-wide analyses, system potential and station placement are the most popular subcategories. In the usage analysis category, temporal journey variation and the reasons for trip variation are the topics that have gathered most interest during the study period. Both rebalancing optimization and bike availability/demand prediction have also been topics of notable scientific interest. If these partly overlapping groups would be counted together, they would form the single biggest group by the number of studies. User-focused analyses have also attracted interest, but within this group, many of the studies have especially focused on user preferences/satisfaction and to a less extent trip purpose or user demographics. On the other hand, bike-sharing systems safety and helmet use of users have been an underrepresented theme among the bike-sharing literature. However, many of the studies from the other cycling category have focuses on cycling safety and helmet use in general but not specifically in the context of bike sharing, which probably explains the result. Bike sharing systems impacts and effects are somewhat underrepresented among the main categories. Within this category, however, the subcategories share is not equal. 12 studies have focused on the emission reduction and modal share impacts of bike-sharing, which is a reasonable volume in around two years. Then again, there were only few studies focusing on travel time and accessibility impacts of bike-sharing systems in cities. From the remaining categories, BSS supplementary services have been studied to some extent, but not very extensively. In addition to classified categories, there are several studies that were relevant to bike sharing but did not fall into any of the main categories. 40
49 Table 4. Classification of bike-sharing studies by the focus area of the study. The studies included are being published between 1/2016-2/2018 Class Study classification Number of classifications % of BSS classifications (other cycling and not relevant excluded) 1 BIKE AVAILABILITY / DEMAND PREDICTION REBALANCING OPTIMIZATION BSS USER ANALYSIS BSS USER DEMOGRAPHICS BSS TRIP PURPOSE BSS USER PREFERENCES / SATISFACTION BSS USAGE ANALYSIS TEMPORAL VARIATION TRAVEL TIME / DISTANCE TRAVEL ROUTES TRIP VARIATION REASONS BIKE AVAILABILITY STATION PATTERNS BSS IMPACTS / EFFECTS MODAL SHARE / EMISSION REDUCTION ACCESSIBILITY / TRAVEL TIME USER'S HEALTH / PHYSICAL ACTIVITY ECONOMIC OTHER BSS SAFETY / ACCIDENTS / HELMET USE SYSTEM ANALYSIS SYSTEM PRICING / BUSINESS MODEL STATION PLACEMENT SYSTEM PERFORMANCE EVALUATION SYSTEM POTENTIAL SYSTEM SUCCESS DETERMINANTS SYSTEM ADVERTIZING SYSTEM CONCEPTUAL DESING / PLANNING SYSTEM BARRIERS BSS SUPPLEMENTARY SERVICES OTHER BSS STUDIES OTHER CYCLING STUDIES NOT RELEVANT STUDIES 386 ALL CLASSIFIED STUDIES / NUMBER OF CLASSIFICATIONS (1-2 per study) = 413/499 TOTAL ONLY BSS STUDIES / NUMBER OF CLASSIFICATIONS (1-2 per study) = 273/360 41
50 STUDY AREAS IN BIKE SHARING STUDIES To some extent, the study areas seem concentrate to certain cities. Especially New York and Washington D.C. in USA and Hangzhou in China have been the only study area or one of them for many bike-sharing studies (Table 5). There have been 34 studies published utilizing the bike-sharing data from New York, 20 studies with the data from Washington D.C and 18 studies with the data from Hangzhou in two years. While these cities possess some of biggest bike-sharing systems in the world, another considerable thing is that they have also actively shared the trip datasets from their bike-sharing system either fully openly (see: New York: Washington: or for research purposes (Hangzhou: see e.g. Xu et al., 2017). From London, which is fourth on the list of most common study areas, the trip records are also provided for research use (see e.g. Beecham and Wood, 2014) and the station occupancy records publicly ( while from Boston and Chicago the trip data is fully open (Boston: Chicago: From Taipei, the station occupancy records are publicly available ( In overall, availability of data have seemed to influence to the choice of the study area in many studies. In total, 93 cities have been a study area for at least one study, which shows wide global interest for bike sharing. When moving to the country level, the dominance of USA but also China in terms of the published bike-sharing literature becomes clear, as these two are leading the comparison of study area countries (Table 5). Strikingly, most of the listed countries are affluent and developed countries. This trend is also visible in the study regions, which are heavily skewed towards North America, Asia and Europe leaving only few bike-sharing studies carried out in other regions. The lack of African countries is expected as there are only few bike-sharing systems in operation in the continent according to the global bike sharing map by Meddin (2018). However, the very small representation of other continents like Oceania and South America is even surprising considering that there are dozens of systems in operation in these continents as the map by Meddin (2018) shows. To some extent, the results might be tilted due to the selected search engine and the English language. 42
51 When comparing the countries of study areas and the countries where the study institutes are located, the same nations are mainly represented among the top publishers (Table 5 & Figure 12). Some differences occur though. There are more studies published from certain countries mainly from Canada and Germany, whose share of the study areas is not as big as their share of the publications. Table 5. The city/region, the country and the continent of the study area in the frequency order. The studies included are being published between 1/2016-2/2018 CITY / REGION OF THE STUDY NUMBER OF STUDIES COUNTRY OF THE STUDY NUMBER OF STUDIES CONTINENT OF THE STUDY NUMBER OF STUDIES New York 34 USA 95 North America 103 Washington 20 China 56 Asia 85 Hangzhou 18 Spain 17 Europe 72 London 11 Taiwan 14 South America 6 Taipei 10 France 11 Oceania 4 Boston 10 UK 11 Central America 1 Chicago 9 Canada 8 N/A 43 Beijing 7 Italy 7 Paris 6 Germany 7 San Francisco 6 Austria 5 Ningbo 5 Ireland 4 Seville 4 Australia 4 Barcelona 4 Belgium 3 Lyon 4 South Korea 3 Montreal 4 Brazil 3 Vienna 3 Chile 2 Madrid 3 Japan 2 Suzhou 3 Other countries 21 Pisa 3 N/A 43 Mons 3 Munich 3 Zhongshan 3 Global 3 Nanjing 3 Other cities 69 N/A 53 43
52 Figure 12. The country of the institution, which has conducted the bike sharing study. The studies included are being published between 1/2016-2/2018 DATA TYPES AND VARIATION IN BIKE SHARING STUDIES Table 6. Classification of datasets by type and size that were used in the reviewed bike sharing studies. CLASS DATA TYPE NUMBER OF STUDIES Variety of data types are used to study bike-sharing systems (Table 6). The most common data type in the bike-sharing literature is an origin-destination (OD) dataset, which is also the type of data used in this study. Generally, bike sharing OD-data consists of 1) the information about the origin and the destination station, 2) trip information (e.g. time, 44 CLASS DATA SIZE (records) NUMBER OF STUDIES 1 OD trip data Survey/ Interview / 2 Travel Diary GPS data Station location 4 /availability data 44 4 > Observations 2 N/A 90 6 Bike counter data 1 7 Statistics 15 8 Other cycling data 7 9 No cycling data Literature review 2
53 distance, speed) and 3) user-related information (e.g. gender, age). Altogether 88 studies have used this type of data. On the other hand, many studies have opted for more qualitative data using surveys, interviews or travel diaries as their source. Data generated by bikesharing stations, containing either temporal bike availability information at a given time, or only the locations of the bike-sharing stations, was the third most common data type. The lack of GPS data is clearly visible from the examined studies, although a couple of studies have been able to access or gathered GPS data from bike-sharing systems. At least one obvious reason for the result is that the conventional dockable bike-sharing systems do not often gather the route information and the trip data from dockless bike-sharing systems, which in turn are constantly tracking the user, are not yet easily available for research. Concerning the data size, there is major variations between the studies as their dataset sizes reached all the way from small sample interviews to broad-scale OD datasets consisting of millions of trip records. Many studies have been able to access these broad trip datasets with large sample sizes. Study areas are one likely explanation behind this phenomenon, as many studies have taken place in cities where the largest bike-sharing systems are located and that have shared their bike-sharing data openly as noted earlier. 45
54 6. BIKE SHARING TRIPS IN HELSINKI This chapter focuses on the results related to bike-sharing trips in Helsinki in The main characteristics relevant to the system usage in Helsinki both temporally and spatially are presented to give an overlook how the system is used. DESCRIPTIVE TRIP STATISTICS During the bike-sharing system operating season 2017 ( ), there was approximately 1.5 million journeys made with the shared bikes in Helsinki (Table 7). More than users did at least one journey. On average, there was around rentals every day by users. As the fleet size and the number of stations significantly varies between cities, these usage rates yet do not give a full picture of the system popularity. Nevertheless, 1.5 million trips give an indication that the system s bikes were in heavy use during the season. A typical metric used to compare the usage rates of bike-sharing systems is to measure the number of trips per one bike per day. In Helsinki, this figure was on average 6.03 trips per day/bike in The use was not uniform but there was fluctuation between months and weeks (Figure 13). On highest in mid-august, the metric was over eight trips per day/bike while in October, an average shared bike was only used two to three times per day. Table 7. Descriptive trip statistics for the Helsinki bike sharing in 2017 All season ( ) Trip count User count Mean covered distance Mean speed Mean duration m 10.8 km/h 14 min 02 s Daily averages Daily trip count average Daily trip/bike average Daily user count average /day 6.03 /day /day 46

55 Figure 13. Variation of the trip count per day per bike by month and week during the system operating season of In general, the picture of system usage in Helsinki seems clear. Bikes are used comparatively often, but users normally make short trips both time- and distance-wise and are not riding very fast with their bikes. To start with the trip distance, a user drives 2204 meters on average on a single trip. The average trip distance and duration varies weekly (Figure 14). During the early season, the averages remain stable but after the last weeks of July, the weekly mean distance and mean duration start to lower steadily. In October, an average trip is over 500 meters shorter and lasts around five minutes less than around mid-summer, which are considerable shifts when considering how short the trips are in general. There is also indication that users take the shortest route for their journeys more likely in the autumn (Figure 14). The mean difference between the theoretical shortest route and the realized route distance decreases towards the end of the season. While in the early season and mid-summer the mean difference is close to 400 meters, in the last weeks of the season, it decreases close to 100 meters. More users are then taking the shortest route for their trips in the autumn, which indicates that the share of bounded trips, for example, commuting-related, increases and the share of more leisureoriented non-bounded trips decreases. 47

56 Figure 14. Variation of mean covered distance, mean duration and mean distance difference of bike sharing trips by week in Helsinki (2017). The mean duration for a bike-sharing trip is 14 minutes. However, the median trip duration is only six minutes and as the Figure 15 shows, there is a steady decrease in trips by each minute from six minutes onwards. It is also notable that almost all of the trips, 96.7 % exactly, are taken within the limits of the 30-minute normal use time, to which the user can keep the rented bike without paying an extra fee. There is not either a spike in returns exactly at the 30-minute boundary. This suggest that the bikes are normally taken for short trips and only rarely for longer ones that would be close to use time limit even though the extra fee for every starting hour after 30 minutes and until five hours is only one euro per starting hour. 48

57 Figure 15. Trip time variation by minute in Almost 97 % of the trips are at maximum 30 minutes, which is the single hire time limit for the user to use the bike without additional costs. The average speed of users has been relatively slow, only 10.8 km/h. To some extent, this speed is explained by the technical capabilities of the shared bike fleet and the main coverage area of the system in the core of the city where cycling speeds are typically slower. In general, bike-sharing users are nevertheless riding considerably slower compared to overall cyclists in Helsinki. The trip speeds, however, are not uniform for every station pair. There are clear spatial patterns in speed variation as can be seen from the Figure 16. Majority of the slowest 20 % trips are concentrated in a small area in the downtown being mostly horizontally directed. The fastest 20 % routes then again are mostly between the station pairs from the city center towards southwest, northwest and northeast in areas where the cycling infrastructure in generally good. The spatial patterns of speed variation highlight areas where the cycling network allows smooth cycling and areas where cycling is less flowing. 49

58 Figure 16. The lowest 20 % and the fastest 20 % by median speed between two bike-sharing stations in Helsinki (2017). 50
59 TEMPORAL TRIP PATTERNS The use counts of the bike-sharing system in Helsinki have fluctuated on a monthly, weekly and daily-level (Figure 17). The most active month in terms of use is August when there has been over trips made with the bikes. The lowest use month correspondingly is October when the total trip count has been around trips. The weekly fluctuation during the summer months (June-August) is moderate and not uniform, but the trip counts are generally high varying between and trips. As the autumn proceeds, the weekly trip counts start steadily decrease and in October 2017, there has been only around to weekly trips. Similarly, there is daily fluctuation in bike usage. In general, shared bikes are used more during the weekdays than the weekend days although this difference is not dramatic. Wednesday is the most active day and Saturday the least active (Figure 18). There have been several consecutive days where the daily trip count has doubled on the latter, which shows the scale of daily variation in bike use (Figure 17). Any single day has not seen considerably more use compared to other days, but several individual days in June and August nearly have reached trips in On the lower end, there has been generally a downward trend towards the end of the season in bike use but also several days in June when the daily trip count has been only around 4000 trips or less. While some of the low-use days can be explained by the period of midsummer holidays, others are probably more related to bad weather conditions than any other reason. 51

60 Figure 17: Distribution of bike sharing trips in Helsinki in 2017 by month, week and day. Note: The last week of the October was not a full week but the bikes were in operation only from Monday to Wednesday 52
.")
61 Figure 18. Percentages of bike sharing trips by weekdday in Helsinki in Hourly fluctuation during weekdays follows the typical pattern of two peaks with one in the morning and the other in the afternoon (Figure 19). In all weekdays, the afternoon peak is slightly higher than the morning peak showing that the busiest hour of the whole day is around four o clock in the afternoon. Every weekday follows the same pattern. The weekend days pattern is clearly different compared to weekdays. Bike use steadily rises from the early morning onwards peaking in the afternoon at four o clock and then starts to decrease. One weekend-specific observation from the hourly fluctuation is the higher use during Friday- Saturday and Saturday-Sunday nights when there have been around 5000 trips on average even at one in the morning. The count is more than a double compared to a typical trip count at that hour on any other weekday. 53
62 Figure 19. Hourly fluctuation of bike-sharing trips by weekday in Helsinki (2017). Weekdays typical patterns is different compared to weekend days. MOST POPULAR ROUTES / STATIONS Most of the popular routes either start or finish close to the central railway station (Figure 20). Common to the most popular station pairs is that they are dominantly in the center of the system network where the station density is highest and where the number of people is highest during daytime. From the railway station, many of the routes direct towards southwest, which coincides with the location of a major cycling highway, Baana, which has likely been the route choice for many of these trips. There seems to be more popular station pairs in the western side of the downtown than in the eastern side where the terrain has more elevation variation. 54

63 Figure 20. Bike-sharing trips in Helsinki (2017). The most popular trips are either departing or returning to the central railway station. 55
.")
64 Additionally, there is an interesting pattern related to public transport, which can be seen from the maps showing the amount of departures and returns by station (Figure 21 & Figure 22: The maps are showing bike sharing departures and returns by station.). Most of the stations that fall into the top two categories of most departures/returns, are in the immediate vicinity of a train or a metro station. This is the case with metro stations of Ruoholahti, Kamppi, Central Railway Station, University of Helsinki, Hakaniemi and Sörnäinen and the Pasila train station. Naturally, some of these stations are not only public transport hubs, but also areas of high socio-economic activity, such as the central railway station and the Kamppi shopping center. The pattern still gives an indication that bike-sharing trips are frequently chained with public transport. Figure 21 & Figure 22: The maps are showing bike sharing departures and returns by station. 56
65 7. BIKE SHARING USERS AND VARIATION AMONG USER GROUPS IN HELSINKI This chapter focuses on the results relevant to bike-sharing users and their usage patterns. First, the chapter zooms into user demographics and sees where the users come from and then it focuses into travel patterns of different user groups more in detail. USER DEMOGRAPHICS Majority of bike sharing users in Helsinki in 2017 have been young adults and more likely men than women (Figure 23). The single biggest age group are the year-olds followed by the and year-olds. As for the gender, 54,6 % of users have been male and 45,4 % female. However, the gender difference is not equal across all age groups. In the age group of year-olds there are actually more female users than male users, although this share flips in favor of male users when compared by the number of trips instead of the number of users. When comparing the users share and the trips share, it is clearly visible that the demographic differences become more emphasized in the latter (Figure 23 & Figure 24). Young adults not only register as users more often than teenagers and older age groups, but they also do generally more trips. For example, the relation between the registered users of the age groups of and year-olds is approximately 5:1, whereas the trip count relation of these same age groups is over 7:1. The gender differences also become larger when seen by trips, as the male users share grows to 59,9 % of the trips compared to 41,1 % by female users. The demographic structure of bike sharing users differs considerably from the overall population structure in Helsinki, as the Figure 25 shows. When looking at the demographic shares of the same age groups of the and year-olds, which were compared above, the demographic relation between them is approximately 1.5:1 across the whole population in Helsinki. The same applies to the gender, as there are more female compared to male in most age groups living in Helsinki. 57
. Age group Trip Count Share % 0 141 0.0 5 5 0.0 15 24 933 2.7 20 126 038 13.")
66 Age group User Count Share % Figure 23: Share of bike sharing users in Helsinki by age group and gender (2017). Age group Trip Count Share % Figure 24: Share of bike sharing trips in Helsinki by age group and gender (2017). 58
.")
67 Age Population Share % % % % % % % % % % % % % % % % Figure 25: Share of population by age group in Helsinki (2017). Source: Statistics Finland (2017) A further comparison shows that the bike-sharing users are neither as diverse group of people as all cyclists in Helsinki (Figure 23 & Table 1 in the section 3.1.2). In terms of age, the share of different age groups is more balanced among general cyclists and the same applies to gender, as there are almost equal share of men and women cycling in the city in overall according to the cycling barometer from 2018 (see Helsinki City Planning Department, 2018). SPATIAL DISTRIBUTION OF USERS The main observation regarding the spatial distribution of users is that the users are distinctly concentrated to the postal areas where there is at least one bike sharing station (Figure 26). In absolute terms, the single postal area with most bike sharing users is the Etu-Töölö, neighborhood, followed by Kallio and Kamppi-Ruoholahti (Table 8). All these areas are considered as urban core areas in Helsinki. Relatively, the share of users by postal area is mostly equal within the station coverage area. The areas with relatively most users compared to the total postal area population have been Jätkäsaari and Kalasatama. What makes the bigger difference in this examination is indeed the presence of a bikesharing station. There are only few areas outside the system coverage area, which do not belong to the bottom category by the users share. The result implies that in postal areas, which do not have a station, the share of users compared to the total area population is low. For example, the users living in Etu-Töölö generate almost tenfold trips compared to the 59
. First, three of them are in Espoo, but none in any other city except Helsinki.")
68 users coming from Etelä-Haaga, which is the top area by the number of users outside the station coverage area (Table 8 & Table 9). Notable here are the top postal areas outside the station coverage area (Table 9). First, three of them are in Espoo, but none in any other city except Helsinki. Secondly, seven out of ten of these postal areas have also a train station within their boundaries. This implies that those postal areas with good railway connections to the city center tend to attract more bike-sharing users within their area. Top 10 postal areas Postal area Users Helsinki Keskusta - Etu-Töölö 2251 Kallio 2031 Kamppi - Ruoholahti 1663 Taka-Töölö 1428 Lauttasaari 1365 Sörnäinen 1354 Toukola-Vanhakaupunki 1141 Eira - Hernesaari 1080 Etu-Vallila - Alppila 984 Vallila 908 Figure 26. Bike-sharing users share of the total postal area population in Helsinki (2017). 60

69 Table 8. Most common postal areas of those bike sharing users who are living inside the system coverage area. Table 9. Most common postal areas of those bike sharing users who are living outside the system coverage area. Notable here is that seven out of the ten postal areas have a train station. The overall picture is similar when comparing, which postal areas generate the most trips (Figure 27). The top three postal areas by the share of trips are the same than when compared by the share of users. In a relative comparison, the trip generation is slightly more emphasized to the western postal areas of the downtown Helsinki. The presence of a bikesharing station is still the decisive factor dividing the areas mainly into two categories, to those with a station and more generated bike-sharing trips and to those without and fewer generated trips. 61
.")
70 Top 10 postal areas Users's postal area Trip Count Helsinki Keskusta - Etu-Töölö Kallio Kamppi - Ruoholahti Taka-Töölö Sörnäinen Eira - Hernesaari Lauttasaari Etu-Vallila - Alppila Toukola-Vanhakaupunki Vallila Figure 27. Bike-sharing trips per person by postal area in Helsinki (2017). When extending the scope of users home areas to the city level, it becomes clear that a vast majority of users, 81.4 %, are from Helsinki (Table 10). The neighboring municipalities Espoo and Vantaa are the second and the third, while the third biggest city in Finland, Tampere, has the most users outside the Helsinki region. In terms of trip generation, the differences are even bigger, as the users from Helsinki make 87.5 % of the trips. Table 10. Most common home cities of bike-sharing users in Helsinki. 62

71 TRIP GENERATION BY USERS An average bike-sharing user is not very active in his or her use. The distribution of all indicators, the trip count, the number of unique user days and the trips per day are showing the same pattern that most users are not active or regular to use shared bikes (Figure 28). A median user has done 22 trips in 15 unique days, which is 0.13 trips per day or in other terms, one bike-sharing journey every 8 th day. The variation within every indicator is significant, for example, the standard deviation of the trip count is 46.3 trips. This shows that there a portion of super-users who use shared bikes extensively. The maximum number of trips by one user have been as high as 1124 trips, which results to almost 6.5 trips per day Figure 28. Distribution of trip count, unique user days and trips per day variables in Helsinki (2017). Majority of users have taken a trip only occasionally. The overall use of the bike-sharing system is not divided very equally among users. Cumulatively, most the cycling trips (~60 %) have been generated by the clear minority of users (~ 20 %) as the Figure 29 shows. In absolute numbers, this means that around users have done around trips. The difference between the mean and median number of trips by user also illustrates this notion. While the median number of trips per one user has been 22, the mean is 38.4 showing the effect of super users who have taken hundreds of trips during the season and hence are stretching the mean higher with their use. 63

72 Figure 29. Cumulative use of bike-sharing system in Helsinki (2017). A small minority of users have made the majority of trips. TRIP PATTERN VARIATION BY USER GROUPS Trip pattern variation by home area Table 11. Descriptive statistics of bike-sharing user groups in Helsinki classified by the home area. Classification UserID count % Trip Count % Trip count median User days median Mean user age Users living outside BSS area Users living inside BSS area Median trip duration (min) Median trip distance (m) Median trip speed (km/h) Median week / weekend use ratio Median distance Potential PT trip percentage median difference (realized route - (Departure/return station in the shortest route) (m) immediate vicity of PT hub) % , The clearest difference in usage patterns by different type of user groups arises from the user s home area. Based on the data, it is reasonable to divide the users into two groups based on whether their home area is inside or outside the station coverage area and examine the variation between these two groups. For the sake of clarity, in this subchapter these groups will be called as inside users and outside users. As seen from the spatial distribution of users (section 7.2), the areas inside the station coverage area have clearly had more users, which in turn have generated clearly more trips than the users living outside the coverage area. Around 69 % of the users lives inside the station area and they make more than 79 % of all the trips (Table 11). Inside users have 64
. The inside users are slightly younger in general, and they do slightly faster and shorter trips.")
73 over twice as many trips and days of use in median showing that they not only register themselves as users more often, but they also do more journeys with shared bikes than the outside users. The usage profiles of the two groups vary in many respects (Table 11 & Figure 30). The inside users are slightly younger in general, and they do slightly faster and shorter trips. Bigger differences between the groups, however, arises from the variables of potential public transport chain trips, usage on weekdays/weekends and the distance differences between the shortest routes and the realized routes. The T-tests show that differences in all these variables between the groups are statistically significant at the 0.05 level (see Appendix 3). Figure 30. Box plots show the variation of user age, potential public transport trips, weekday vs weekend relative use ratio and median route distance difference between the two home-area based user groups. First, the outside users make more trips that either depart or return in the immediate vicinity of a public transport hub, which is a metro or a train station. This public transport variable is also temporally sensitive as the Table 12 shows. Outside users have a spike in their potential public transport departures share in the weekday mornings (0.58 % of the trips) and a corresponding spike in their potential public transport returns share in the 65
74 weekday afternoons (0.47 % of the trips). The inside users do not have these spikes, but their shares are reverse to the outside users in these times. On weekends, these temporal patterns are similarly divided between the groups, but not so distinctively. Table 12. Temporal variation of potential public transport trips shares by inside users and outside users. The results suggest that outside users combine bike sharing with public transport especially in commuting trips. Classification Weekday mornings (7-9) Weekday afternoons (15-17) Weekend mornings (7-9) Weekend afternoons (15-17) PT departure % by all users PT departure % by inside users PT departure % by outside users PT return % by all users PT return % by inside users PT return % by outside users There is also a clear spatial pattern by postal area in the median share of potential public transport trips by user (Figure 31). In most of the postal areas that are along a railway, the share of potential public transport trips is distinctly higher than in those that are further away from the railway line. This phenomenon is also visible with the metro line, but not so distinctively than with the train. Thus, it reasonable to assume that the outside users chain their bike-sharing trips more often to a public transport trip than the inside users, who have their home location within the system area. The chaining pattern is stronger if the user lives close to a train or metro station. Another major difference between the groups is in the weekly emphasis of use. The outside users take their trips much often during weekdays compared to the inside users, whose use in weekdays and weekends is more equal. When the share of weekdays is normalized, the inside users make in median 1.2 weekday trips for every one weekend trip while the ratio for outside users is 2.0 weekday trips for every one weekend trip. The inside users also have less distance difference between the realized route distance and the shortest route distance implying that they take more often the shortest route for their trip. 66

75 Figure 31. Bike-sharing users potential public transport trip share by postal area. The map shows the median share of potential public transport trips of all bike-sharing trips by postal area. The users, who are living close to a train or metro station, have higher shares in general. 67
76 Trip pattern variation by age Table 13. Descriptive statistics of bike-sharing user groups in Helsinki classified by the age group. Classification UserID count % Trip Count % Trip count median Median trips per day (trips / length of subscription days) Median trip duration (min) Age Age Age Age Age Age Age Median trip distance (m) Median trip speed (km/h) Median week / weekend use ratio Median distance difference (realized route - shortest route) (m) Potential PT trip percentage (Departure/return station in the immediate vicity of PT hub) (%) As shown in the chapter 7.1, users age distribution is tilted towards young adults. Age directly affects the number of trips likewise, as the older age groups (from the age 40 onwards) have in median lower number of trips per day compared to the younger age groups (Table 13). The usage patterns of different age groups have some variation too (Table 13 & Figure 32). Older age groups tend to do a few minutes longer trips in time that are a few hundred meters longer in distance. Older age groups also have 1 to 2 km/h slower cycling speeds than younger age groups. Furthermore, the distance difference variable grows by the age group, implying that younger adults take the shortest route to their trip more frequently. However, the variation within this distance difference variable is only 100m at largest. There is also variation in the weekly use emphasis, as the age groups from 40 to 69 make almost twice as many trips during the weekdays than on the weekend days, whereas the young age groups from 10 to 29 have almost equal usage between the weekend days and the weekdays (Table 13 & Figure 32). The users of the age group make slightly more potential public transport trips than the other groups, but the difference is only a minor. Only 68
 between the groups in the above variables (appendix 4).")
77 the users is the oldest examined age group make clearly less potential public transport trips than other groups. A one-way ANOVA and Tukey s post-hoc tests confirm statistically significant variation (p =< 0.05) between the groups in the above variables (appendix 4). The post-hoc test also shows that from years onwards, there are less statistically significant variation between the age groups implying that trip patterns do not vary between older age groups so much. Age clearly has a big role in individual s willingness to decide to use shared bikes. However, the results indicate that age is not very decisive factor in usage patterns. There is variation between the age groups, but in general, the variation is not major. Moderate variation in trip speeds, which also affect the trip durations, might be explained by the age-related physical factors. Slightly longer trips also increase the distance difference, as normal cycling easily accumulates more additional meters in a longer route compared to a shorter one. The weekly use emphasis is clearly age dependent, but even that might be explained by the distribution of people in Helsinki. There are younger population living in the downtown areas, which means that these people have the bikes readily available throughout the week whereas older age groups use bikes more on working days when they more likely visit the city center. Figure 32. Box plots show the variation of trip count, median trip distance difference, median trip duration and median trip speed between the age groups. 69
 Median trip duration (min) Female users 10 556 0.46 366 315 0.40 21 0.12 12.")
78 Trip pattern variation by gender Table 14. Descriptive statistics of bike-sharing user groups in Helsinki classified by gender. Classification UserID count % Trip Count % Trip count median Median trips per day (trips / length of subscription days) Median trip duration (min) Female users Male users Median trip distance (m) Median trip speed (km/h) Median week / weekend use ratio Median distance difference (realized route - shortest route) (m) Potential PT trip percentage (Departure/return station in the immediate vicity of PT hub) (%) Trip usage pattern variation attributed to gender is quite small. Men are more likely to become users and they also do more bike-sharing trips than women do, as was shown in the section 7.1. However, the usage patterns of these two groups do not differ much (Table 14 & Figure 33). Men cycle slightly faster and make slightly shorter trips both in time and in distance in median. Median weekly emphasis is similar between the gender groups, as is the route distance difference. Women have a slightly lower share of potential public transport trips than men, but the difference is only five percentage points. The small variation in all these variables is nevertheless statistically significant at 0.05 level based on the t-tests, but the magnitude of the variation is not large in any of the variables (appendix 2). Figure 33. Box plots show the variation of trip count, median trip duration, median trip distance and the share of potential public transport trips between the gender groups. 70
79 Trip pattern variation by subscription type Table 15. Descriptive statistics of bike-sharing user groups in Helsinki classified by the subscription type. Classification UserID count % Trip Count % Trip count median Median trips per day (trips / length of subscription days) Median trip duration (min) Users subscription type: "Day" Users subscription type: "Week" Users subscription type: "Year Median trip distance (m) Median trip speed (km/h) Median week / weekend use ratio Median distance difference (realized route - shortest route) (m) Potential PT trip percentage (Departure/return station in the immediate vicity of PT hub) (%) Bike-sharing users in Helsinki can choose whether they purchase the daylong, the weeklong or the yearlong subscription. Based on the data, some usage variables vary considerably by the subscription choice (Table 15 & Figure 34). One-way ANOVA and the post-hoc tests confirm that variation is significant (p < 0.05) and that each group has distinguishing usage patterns (appendix 5). Majority of users opt for the whole season (82,4 %) followed by the daylong (13,6 %) and the weeklong subscription (4,0 %). In median, the day users make 3.0 trips per day, while the week users make 1.0 and the season users only 0.14 when proportioned to the duration of their subscription. Still the most striking difference between the groups arises from the trip characteristics. The median duration of the day users is nearly twice as long, 21 minutes, compared to the season users who have 11 minutes. Likewise, the median trip distance is 2811 meters for the day users while the season users have 1892 meters. The median speed of the trip is also almost 3 km/h slower for the day users (8.0km/h vs 10.7km/h). Whereas the season users typically take the shortest route, the distance difference between the realized and the shortest route for the day users is in median 462 m. With all these four variables, the medians for the week users are between the day users and the season users. 71

80 Figure 34. Box plots show the variation of median trip duration, median trip distance, median trip distance difference, and median number of trips per day between the subscription type groups. The results suggest that especially the day users have distinctive usage patterns. Based on their trip characteristics it can be assumed that many of them take a shared bike often for leisure trips where the speed or the fastest route are not so important. The day users and the week users take relatively more trips on weekends, which supports the assumption of their trips being often more leisure-oriented. Additional note is that the day users also take the benefit of their short subscription fully and make several trips with the shared bikes during the purchased day, whereas the weekly users let alone the season users do not use the bikes this intensively when compared to their subscription length. 72
81 Trip pattern variation by the activity of use Table 16. Descriptive statistics of bike-sharing user groups in Helsinki classified by the activity of use Classification Gender share % (female/male) Median user age User ID count Median trip duration (min) Median trip distance (m) Median trip speed (km/h) Median week / weekend use ratio Trip count quartile Q1 (1-4 trips) 0.48/ Trip count quartile Q2 (5-12) 0.49/ Trip count quartile Q3 (13-25) 0.48/ Trip count quartile Q4 (26-54) 0.45/ Trip count quartile Q5 ( ) 0.38/ Median distance difference (realized route - shortest route) (m) Potential PT trip percentage (Departure/return station in the immediate vicity of PT hub) (%) Departure station standard deviation (trips) Departure hour standard deviation (hours) Next departure from earlier return station percentage (%) Percentage of days where the first departure station is the last return station (%) Usage patterns are also trip count specific as active bike-sharing users differ from their notso-active counterparts. These differences occur especially with trip variables that show how repetitive the bike use is (Table 16 & Figure 35). Almost in all variables apart the potential public transport trips share, all the activity groups differ from each other as the ANOVA test and the following Tukey s post-hoc tests confirm (p< 0.05) (appendix 6). Only the most active quartiles (Q4 & Q5) are similar in their median distances, median durations and median distance differences. Further comparison shows that a positive correlation (Pearson) exists between the user s trip count and several variables that imply use repetitiveness (Figure 36). All are statistically significant (p < 0.05). When the trip count rises, there is relatively more days when the user has ended to the same station where his first trip of the day was taken (correlation of 0.22). There are also relatively more chained trips that have departed from the station where the user s earlier trip returned within the same calendar day (c= 0.24). Trip count also positively correlates with the standard deviation of user s departing stations (c= 0.79) and departing hours (c= 0.8). The more there are trips the more these trips are taken from one or a few stations at a certain hour. Furthermore, there is a positive correlation with the user s trip count and the user s median speed (c= 0.3) meaning that the more user makes shared bike rentals, the faster he or she goes. The relative weekday versus weekend usage ratio also slightly grows (c=0.12) when the trip count variable grows implying that active users make relatively more trips during weekdays compared to weekends. 73
.")
82 The user s trip count has a negative correlation with the user s median trip duration (c= ), the median trip distance (c= -0.12) and the median trip distance difference (c= -0.13) (Figure 36). All these correlations are statistically significant (p < 0.05). These results show that active bike-sharing users make shorter and faster trips and they take the shortest route for their trip more often than those users who have less trips. Figure 35. Box plots show the variation of round trips days share, chained trips share, standard deviation of station usage, and median trip duration between the use activity groups. Based on these results, it is possible to identify a group of active users, who have different usage patterns than those who have taken less trips. The most active users are notably more often men and slightly younger. Especially the ratios of standard deviations of departure time and departure hour indicate that the active users often have a certain station and hour where and when they rent their bike. They also drive faster and shorter trips and take the fastest route more often. When these results are combined with the result of pronounced weekday use, it is reasonable to assume that many of the most active users use shared bikes in their daily commuting and that shared bikes have a significant role in their daily mobility. 74
83 Figure 36. Correlation matrix for the continuous user variables (see appendix 1 for the variable explanations). The blue color implies positive correlation and the red color negative correlation. Statistically not significant correlations are marked with x. 75
84 8. DISCUSSION Bike-sharing systems are actively and extensively studied but study areas are concentrated The pace of the bike-sharing research has further accelerated in recent years. The results of the systematic literature review by this study complement literature reviews on bike sharing by Fishman et al. (2013) and Fishman (2015). Since then, there has been a multitude of publications on the topic and the research community s extensive interest towards bikesharing has only grown, as over 400 published studies in two years show. These publications have come from a myriad of scientific fields covering a large range of study topics. From a research perspective, the surge of bike-sharing studies strongly links to the societal need for information on how urban mobility is transforming. Another important trend has been the revolution of mobility data and improved possibilities to access these data sources. It seems that bike-sharing systems have been in a position where these two trends have intersected. Bike-sharing systems have spread rapidly to cities and in this way, they have been very topical for urban planning and policy-making. They have also disrupted existing urban mobility patterns in a novel way but provided quantities of useful movement data to study these disruptions. Lastly, these systems have been viewed as an optimal tool to promote cycling, which has been a high-priority target in many urban areas during the last decade due to large emission reduction needs. Findings of my literature review on bike sharing study topics generally agree with earlier studies (see Fishman et al., 2013; Fishman, 2015). Bike-sharing systems are analyzed from many perspectives but there is a strong focus on system-wide analyses, bike demand modelling and rebalancing issues as well as bike usage analyses. Compared to these, impacts of bike sharing are still a somewhat understudied topic as pointed out by Ricci (2015) and Médard de Chardon et al. (2017) but clearly there has been more focus on impacts than before, although earlier studies have not quantified the volume of studies. With some topics like health impacts and accidents, the research focus seems to be more in overall cycling but not particularly in bike-sharing cases. An emerging trend is the rise of China. In 2015, Fishman (2015) noted that while China has the biggest bike share capacity in the world that was not shown in the research activity. Based on the results of my literature review, the research community has acknowledged the 76
85 gap and China is now second after USA in a country-level analysis both by the number of study areas and the published articles. Contrary to the expectations by Fishman (2015), there is still, however, little research on dockless bike-sharing systems, which have been a topic that has been expected to emerge to the research agenda. Closely related to the dockless systems, this study found that only a couple of studies had been able to access and utilize GPS trip data, which is always recorded by the dockless systems but only rarely by the dockable bike-sharing systems. The number of studies focusing on dockless systems and using GPS data will probably increase in the future as these systems become more common. However, it seems that GPS data are still scarcely available. It is possible that private companies, which often run dockless bike-sharing systems, are less eager to share the trip data from their systems than public operators. The literature review of this work also showed that recent bike-sharing studies are surprisingly concentrated into a few cities. There can be several explanations to the result but clearly the availability of bike sharing data has been one explanation. Possibilities to access relevant data steer study area choices and all the cities where most studies had been conducted had either shared their trip data fully openly or for research purposes. Openly available transport data on public transportation and alternative travel modes such as bike sharing serve research purposes well (Jäppinen et al., 2013). On the other hand, bike-sharing system operators unwillingness to share their data hinders comparisons of different systems (Médard de Chardon et al., 2017). Providing, for example, trip records openly not only benefits researchers but cities themselves too. Bike sharing data can be used to better understand cycling dynamics and this way to support planning and policy. The datasets can also benefit the users, for example, by enabling real-time travel information services. Clearly, the cities who have been able and willing to share their bike-sharing data, have benefited from the policy as they have attracted researchers to study their systems and provide more information on them. System popularity does not necessarily mean equal use The bike-sharing system in Helsinki has been popular, even when compared internationally. During the 2017 season, there was on average six trips per bike made each day, which places the system high among bike-sharing systems (see Médard de Chardon et al., 2017) although different systems are not fully comparative due to varying sizes and coverages. Popularity 77
86 of the Helsinki system has echoed in the public discourse, which has been positive in general. The system has widely been praised as a success (Raninen, 2018). Despite the active use of bikes, the empirical results of this work show that there is still considerable room for improvement in how well the system attracts users. The user demographics skews towards young adults and males, and the representation of these groups does not match to their demographic share or their share of all cyclists in Helsinki. Correspondingly, the representation of women and older age groups do not correspond to their demographic representation. This is a common phenomenon with bike-sharing systems around the world, as bike-sharing systems tend to attract a certain profile of people (Ricci, 2015; Raux et al., 2017). In fact, the share of women cyclists in Helsinki is slightly higher than in most other systems where the user demographics have been studied. Regarding age, the Helsinki system has thus far indisputably been used mostly by young adults. It is possible that there will be a shift in user demographics in the coming years as 2017 was only the second year when the system was in operation. Typical innovation diffusion patterns might then explain these patterns. Young people, who in general embrace new technologies more readily than older members of the population, are more likely to be early adopters and have higher use in the stage when the system in still relatively new in Helsinki. Somewhat specific to Helsinki is the representation of bike-sharing users compared to all cyclists. Contrary to the results by Buck (2013), the bike-sharing users in Helsinki are a more homogenous group of people than cyclists in general in the city. The usage rates of the shared bikes vary considerably among the users. A relatively small portion of the users, around 20 %, make around 60 % of the trips, while a typical user only seldom uses the bikes. This result is in line with previous literature, as similar usage patterns have also been found elsewhere showing that most users are moderate or irregular users (Vogel et al., 2014; Fishman, 2015). The distribution of use is nevertheless important to consider when evaluating the system performance. Following the words of Ricci (2015), success in trip generation does not mean that bike-sharing system are socially inclusive. To some extent, high usage rates might hide the fact that the bikes have been a part of daily mobility only to a limited group of people. Equality is a central concern in bike-sharing systems. Especially when the system is publicly funded, the goal should be that the many benefits of bike sharing are distributed equally to the citizens. Use of bike-sharing systems link to general popularity of cycling in a country. 78
87 It is widely shown that cycling demographics tend to be skewed towards younger male population in low-level cycling countries, whereas in countries with a mature cycling culture, cycling is generally seen as a viable transportation option across the population (e.g. Harms et al., 2014; Aldred et al., 2015). Inevitably, the local cycling culture then affects the adoption and user distribution of bike sharing. In Helsinki, however, cycling levels are high compared to other European capitals and cyclists demographic shares resemble the demographic shares of the overall population (European Cyclist Federation, 2014; Helsinki City Planning Department, 2018). Is it then surprising that the bike-sharing system in the city has thus far mostly attracted quite narrow user and especially trip profiles? The coming years will show if the user demographics will equalize as the system becomes an established part of possible transportation options. It is nevertheless vital for system managers and urban planners in general, to be aware of who the users of the system are. Even if the system attracts high use, a surprisingly small and homogenous group of people might still generate most of it, as has been the case in Helsinki. Spatiality matters User s home area is decisive in bike-sharing usage Based on the empirical results of this work, home area has a significant role in shaping usage patterns of bike sharing. Users that live in an area in Helsinki, which has at least one bikesharing station, generate 80 percent of the trips and their usage patterns differ from the other group. The inside users weekly use emphasis is distinctly more balanced between weekdays and weekends and they combine bike sharing much less with public transport. They also drive a little faster and take the shortest route a little more often. These differences occur even though the demographic profiles of the overall population between the postal areas inside and outside the system coverage area are similar in Helsinki in terms of age and gender. To some extent, the results support Rícci (2015) who states that the geographical location of bike sharing stations can be plausibly regarded as a key explanatory factor to the socioeconomic profile of the scheme's users. This study did not study the economic attributes of the users due to a lack of suitable data, but this perspective would be important to acknowledge in later research as economic attributes have been found to be important in explaining bike-sharing users profile elsewhere (Ricci, 2015; Raux et al., 2017). Regarding the proximity of stations, there is also contrary evidence from Lyon where the local system 79
88 was not strongly related to the user s postcode (Vogel et al., 2014). The explanation might be the scale. The differences may not occur so straightforwardly between individual postal areas but become more visible when the areas are aggregated to dichotomous inside/outside bike-sharing station coverage area classes. It is also important to notice that while home area seems to shape usage patterns, it does not guarantee causality as self-selection bias might be relevant here (Handy et al., 2006). People who are more likely to use bike-sharing might also be more likely to move to areas where the shared bikes are available or where the urban form supports short and bikeable travel distances. Most likely, urban form is indeed important in explaining the results. Shared bikes are easily available for those who live in their proximity. In the central areas of Helsinki where the system is located, the population density is higher, which according to Naess (2012), often implies shorter travel distances. Short travel distances then again, are well suited and typical for bike-sharing trips. Furthermore, the users who are living outside the system area, might not have the need to come to the city center of Helsinki every day. According to a recent unpublished study by Bergroth (2019), the share of population within the inner city of Helsinki of the total present population in the Finnish capital region only grows from approximately 22 % to 32 % from night-time to daytime. Outside users only have the opportunity to use shared bikes when they need to come to the city center even if they would like to use these bikes more often. These findings on the role of spatiality have several implications. Firstly, they are one likely explanation why the system in Helsinki has been so successful in attracting trips. The station coverage area of the system in 2017 was mainly in the inner city where the station network was the densest and the population density highest. In other words, the typical trip distances have been ideal for shared bikes. There is evidence that to maximize the system use, a good policy is to locate most stations in the area of high cultural, social and economic activity (Ricci, 2015). In Helsinki, the system has been placed exactly in these types of areas. It will be interesting to see how the realized and planned system expansions to new areas in Helsinki and Espoo will affect trip patterns as the urban form within the system area becomes more diverse and the areas that were earlier on the fringe of the station coverage area become more central. Secondly, as said, the bike-sharing system in Helsinki will expand to new areas in 2019 with almost 90 new stations (HSL, 2018b). Based on the results of this work, the expansion is 80
89 reasonable especially from an equity perspective. Despite that, there is little evidence that expansion would increase bike-sharing systems performance (Médard de Chardon et al., 2017). In fact, the system performance in terms of the generated trips per bike might even decrease in Helsinki. This is due to characteristics of the expansion areas that are outside the city center and have less potential user base and likely longer travel distances than in the downtown. However, most bike-sharing trips are made by those who have a short access to their nearest bike-sharing station. After the expansion, more citizens can access the full benefits of bike sharing in Helsinki. In London for example, the system expansion helped to reduce inequalities in use (Goodman and Cheshire, 2014). As it seems that the bikes are indeed mostly used in Helsinki to cover the last-mile, the expansion can help to make cycling a part of daily mobility to a larger group of people. Active users and day users have distinctive usage patterns Home area is not the only factor that shapes bike-sharing usage patterns in Helsinki. This study shows that the user s subscription type and the use activity also steer how a customer uses the bikes. Then again, this study found age and gender only to have a minor effect on usage patterns, but they are more important in explaining whether someone chooses to become a bike-sharing user in the first place. However, this study did not analyze spatial structures of trips, which might vary due to gender or age as was shown in London by Beecham and Wood (2014). The absolute majority of users were annual subscribers. This is similar to earlier findings from Hangzhou and New York (Shaheen et al., 2011; Noland et al., 2016). Users with a daylong subscription make notably longer and slower trips and take relatively more trips on weekends, which implies that many of them are tourists. This considered, the day users distinctive patterns are not a surprise as travel motivations of tourists are often different compared to the resident population. Then again, the users with a long subscription are more likely to use bike on weekdays, which is in line with the results of Zhou (2015) from Chicago. The segmentation of the users into activity quantiles by their total trip count also uncovered some interesting mobility patterns. Like day users, the most active users have distinctive usage patterns. For example, the most active users seem to do more trip chaining and depart more from certain stations at certain hours. These results imply that bike sharing plays a major role in the daily mobility of the most active user quantile and that these users often 81
90 have daily recurring patterns of use. It is likely that many of them are using shared bikes for daily commuting. Not so surprisingly, the share of men and young adults is clearly higher in the most active user quantile. Vogel et al. (2014) found similar demographic patterns with bike-sharing in Lyon and these patterns of active use linked to masculinity are also common in general cycling studies. While this study provided a view into trip patterns of different user groups based on the trip data, it did not look into motivations. There is still a need to study motivations of different activity groups to choose or not to choose shared bikes. This study neither analyzed the spatial variation of trips by different user groups nor created activity spaces for users. Noland et al. (2016) found differences in the spatial location of casual users and subscribers in New York where the trips by casual users were less likely to be generated in residential areas. In general, spatial patterns and areal coverage of trips by different user groups are promising avenues for further research. Precise location data is likely to become increasingly available as more GPS trackers are integrated to dockable systems while dockless systems, which rely on location tracking, become more common. In Helsinki, the evolution of spatial trip patterns is especially interesting once the system expands in Bike sharing both complements and replaces public transport in Helsinki The bike-sharing system in Helsinki seems to be both replacing and extending public transport. On the one hand, the stations near the metro and the train stations have been the most popular departure and return stations. Moreover, there is indication that in postal areas, which are outside the system area but close to a metro or a train station, have more users than in areas that are both outside the system area and further away from the train and metro connections. On the other hand, the user survey shows that beside walking, most people have replaced tram and bus trips (HSL, 2017). The bike sharing users in Helsinki are mainly from the downtown area. This means they probably have less need to integrate bike-sharing trips and public transport, as their travel distances are usually short. The short median distance and median duration of bike-sharing trips in Helsinki clearly supports this assumption. The users who come from outside the station coverage area integrate public transport and bike sharing more. For many of them, the bike sharing is probably an important part of the daily commuting as they use shared bikes relatively more on weekdays. Their use of stations close to public transport hubs is also time-sensitive peaking in the morning and in the afternoon. 82
91 These results are well in line with earlier findings. Higher rental activity near public transport hubs has been found for example in Paris and London (Nair et al., 2012; Goodman and Cheshire, 2014). Similarly, elsewhere the majority of users have been found to be mostly replacing walking and public transport journeys with bike sharing (Fishman, 2015). In Dublin and Montreal, similar to Helsinki, the bike sharing users were found to integrate metro and train more than bus (Bachand-Marleau et al., 2012; Murphy and Usher, 2015). Taken together, the findings of this work go along with Shaheen et al. (2011) and Raux et al. (2017) who state from the context of Hangzhou and Lyon that bike sharing acts both as a competitor and a complement to the existing public transit system. It seems that this conclusion applies to the relationship of public transport and most bike-sharing systems. Despite the indicative results, the bike-sharing OD trip data, still has a limited ability to provide information on the integration of public transport and bike sharing. Based on the rental information and users home area it is possible to make conclusions about probable integration of bike sharing and public transport by the certain user groups. However, a further analysis on the synergy between the two modes would require either user-level public transport and bike-sharing journey data integration or in-depth interviews. In Helsinki, where the shared bikes are rented with a smart travel card, which is also used to access local public transport, integration of journey data would actually be possible. Origin-Destination trip data on bike sharing is a useful but limited data source The bike sharing data that was used in this work was an origin-destination (OD) type of trip data where the basic user information was integrated. The systematic literature review in this study showed that this has also been the most common data type in the bike-sharing relevant studies during the recent years. For the purposes of this study, the OD trip data on bikesharing provided a great deal of useful information on users trip patterns in Helsinki. It was possible to extract recurring patterns of daily mobility from the data. Beside the stationcentric analyses to uncover rental patterns and help bike rebalancing, the empirical findings of this work show that the OD data is also useful for user-centric analyses. User-centric perspective was suggested first by Vogel et al. (2014). Trip data sheds new light into cycling dynamics in Helsinki where earlier studies have mostly been surveys. OD trip data has its inevitable limitations, which was also discussed by Romanillos (2016). First, the data does not contain route information. In this study, the minor difference between 83
92 the shortest and the realized route showed that it is valid to assume that the users mostly take the shortest path. Accurate GPS data would nevertheless allow studying the route preferences, for example, whether the users prefer the cycle path even when it is a slightly longer choice. The next-generation dockable bike-sharing system as well as dockless systems can potentially provide more this type of information in the future. Secondly, the OD-data only contains the trips that were made. It does not allow studying those situations when the user has come to a full station and opted for another transport mode due to a lack of shared bikes or went to another station. Thirdly, OD-data is very limited in its ability to explain user behavior. Mostly, it is not possible to answer why users have certain usage patterns. More work is needed on this front on how to enrich raw trip data with meaningful explanatory variables (Romanillos et al., 2016). Lastly, OD-trip data is often messy in its raw format and needs specific processing techniques due to its size. Extracting insights from the data needs a certain level of technical expertise as well as availability of sufficient computational power, which are not necessarily always available. From the broader cycling perspective, OD-trip data on bike sharing is a useful addition to the existing cycling data sources. The main benefit is its scale. In Helsinki, the trip data from 2017 contained around 1.5 million trips and in bigger cities, the trip record sizes are manifold. Bike-sharing data also gives a more representative view on cycling compared for example to sports application data that are often strongly skewed towards certain demographic groups (see e.g. Tarnanen et al., 2017). Due to the mentioned limitations, ODdata on bike sharing is not fit for every research purpose on cycling or on bike sharing, nor is any other type of existing cycling data source. While none of these data sources alone can provide comprehensive knowledge on cycling, novel and broad-scale datasets, for example from bike sharing and sports applications, have increasingly helped to fill cycling related information gaps. They can provide a better understanding of cycling dynamics, which is crucial to the efforts to raise the popularity of this mode of travel in urban areas. Future directions for bike-sharing planning and research Concluding from the high use rates and the upcoming expansion, bike sharing has come to stay in Helsinki. Young adults have embraced the system well as this study has shown. This bodes well for a gradual change of urban mobility in Helsinki towards more sustainable direction. However, to contribute better to the city s cycling policy target to increase the modal share of cycling to 15 % by 2020 (see Helsinki City Planning Department, 2017), it 84
93 is important that the system attracts users across a wider range of age and gender groups. Hence, it is important to promote bike sharing and cycling especially among underrepresented groups. Following the argument of Aldred et al. (2015), urban planners and policy-makers in general need to consider needs and preferences of under-represented groups separately and not see cyclists only as one homogenous group. Research can contribute to this need and still deeper explore different typologies and preferences of bikesharing users as has been suggested for example by Ricci (2015). From the socio-political perspective, bike-sharing systems might also have some indirect effects that have received less attention. First, bike sharing might improve and normalize the public image of cycling. Evidence shows that bike-sharing users who are commonly cycling in normal clothing and without helmets, might reduce perceptions that cycling is only for sporty people (Fishman et al., 2013; Goodman et al., 2014). This way bike sharing not only directly but also indirectly might increase cycling. Secondly, positive visibility of the Helsinki bike-sharing system in the public discourse and the high use rates might increase pressure for politicians to raise investments to the system and to the cycling infrastructure in the city. This study did not delve into these potential impacts. Further research is needed to study whether evidence supports these hypotheses that bike sharing indirectly has contributed to the popularity and promotion of cycling in Helsinki. In all, bike sharing has changed mobility patterns in urban areas around the world. The concept has especially seen rapid expansion into western cities. The pace of development is unlikely to cease as technological advancements have enabled innovations such as dockless and electronic bike-sharing systems to become increasingly available and viable options in cities. With these developments, the bike-sharing concept has still an increasing potential to contribute to aspirations to make cities more sustainable. Impacts, which bike-sharing systems have, can nevertheless range from significantly positive to nearly negative or minimal depending on the perspective. In this, research has a fundamental role to keep up with the rapidly changing landscape and provide comparable and justifiable tools to assess different kinds of bike-sharing systems as concluded by Fishman (2015). Only with knowledge-based policy, can cities harness bike-sharing effectively and further promote cycling with these systems. 85
94 9. ACKNOWLEDGEMETS First, I want to thank my two great supervisors Tuuli Toivonen and Maria Salonen. Your comments and guidance have been indispensable to my work and you persuaded me to pick bike-sharing topic in the first place. A special thank you to Tuuli for giving me the opportunity to use my working time to do the thesis work. I am very grateful to both of you! Thank you also all the great people in Digital Geography for your peer support and comments as well as chats in the afternoon coffee breaks and elsewhere. This has been a lovely atmosphere to work in. Special thanks to Jeison Londoño Espinosa for helping me with the Python stuff and all the support, it was not one time I asked you how to do this?. I am grateful to HSL and CityBike Finland for providing the bike-sharing data from Helsinki available for this study. I also want to thank Mikko Raninen for helpful chats on bike sharing in Helsinki. Thank you, Tristan Seymour, my great friend in Australia, who took the effort to proofread the text. I want to thank my parents for the support. You have helped me to put my thesis work into perspective and given me confidence that the master s thesis can be finished. Finally, I want to thank you Claudia. You have not just supported me all the way during this process, but you have also given me invaluable comments how to make my work better. I would not be here without you! 86
95 BIBLIOGRAPHY Ahas, R., Silm, S., Järv, O., Saluveer, E. and Tiru, M. (2010) Using Mobile Positioning Data to Model Locations Meaningful to Users of Mobile Phones, Journal of Urban Technology, 17(1), pp doi: / Ahas, R., Aasa, A., Yuan, Y., Raubal, M., Smoreda, Z., Liu, Y., Ziemlicki, C., Tiru, M. and Zook, M. (2015) Everyday space time geographies: using mobile phone-based sensor data to monitor urban activity in Harbin, Paris, and Tallinn, International Journal of Geographical Information Science. Taylor & Francis, 29(11), pp doi: / Aldred, R., Woodcock, J. and Goodman, A. (2015) Does More Cycling Mean More Diversity in Cycling?, Transport Reviews. Taylor & Francis, 1647(July), pp doi: / Anaya, E. and Bea, M. (2009) Cost benefit evaluation of bicing: Presentation in ECOMM conference 2009 in San Sebastian/Donostia Available at: (Accessed: 26 July 2018). Andrienko, G., Andrienko, N., Demsar, U., Dransch, D., Dykes, J., Fabrikant, S. I., Jern, M., Kraak, M. J., Schumann, H. and Tominski, C. (2010) Space, time and visual analytics, International Journal of Geographical Information Science, 24(10), pp doi: / Bachand-Marleau, J., Lee, B. and El-Geneidy, A. (2012) Better Understanding of Factors Influencing Likelihood of Using Shared Bicycle Systems and Frequency of Use, Transportation Research Record: Journal of the Transportation Research Board, 2314, pp doi: / Banister, D. (2011) Cities, mobility and climate change, Journal of Transport Geography. Elsevier Ltd, 19(6), pp doi: /j.jtrangeo Batty, M., Axhausen, K. W., Giannotti, F., Pozdnoukhov, A., Bazzani, A., Wachowicz, M., Ouzounis, G. and Portugali, Y. (2012) Smart cities of the future, European Physical Journal: Special Topics, 214(1), pp doi: /epjst/e Beecham, R. and Wood, J. (2014) Exploring gendered cycling behaviours within a large-scale behavioural data-set, Transportation Planning and Technology. Taylor & Francis, 37(1), pp doi: / Bergroth, C. (2019) Uncovering population dynamics using mobile phone data: The case of Helsinki Metropolitan area. Unpublished master s thesis. University of Helsinki. Bernhoft, I. M. and Carstensen, G. (2008) Preferences and behaviour of pedestrians and cyclists by age and gender, Transportation Research Part F: Traffic Psychology and Behaviour, 11(2), pp doi: /j.trf Bertolini, L., Clercq, F. le and Straatemeier, T. (2008) Urban transportation planning in transition, Transport Policy, 15(2), pp doi: /j.tranpol Bordagaray, M., Fonzone, A., dell Olio, L. and Ibeas, A. (2014) Considerations about the Analysis of ITS Data of Bicycle Sharing Systems, Procedia - Social and Behavioral Sciences. Elsevier B.V., 162(Panam), pp doi: /j.sbspro Broach, J., Dill, J. and Gliebe, J. (2012) Where do cyclists ride? A route choice model developed with revealed preference GPS data, Transportation 87
96 Research Part A: Policy and Practice. Elsevier Ltd, 46(10), pp doi: /j.tra Buck, D., Buehler, R., Happ, P., Rawls, B., Chung, P. and Borecki, N. (2013) Are Bikeshare Users Different from Regular Cyclists?, Transportation Research Record: Journal of the Transportation Research Board. doi: / Buehler, R. (2012) Determinants of bicycle commuting in the Washington, DC region: The role of bicycle parking, cyclist showers, and free car parking at work, Transportation Research Part D: Transport and Environment. Elsevier Ltd, 17(7), pp doi: /j.trd Buehler, R. and Pucher, J. (2012) Cycling to work in 90 large American cities: New evidence on the role of bike paths and lanes, Transportation, 39(2), pp doi: /s Burns, L. D. (2013) Sustainable mobility: A vision of our transport future, Nature, 497(7448), pp doi: /497181a. Calabrese, F., Colonna, M., Lovisolo, P., Parata, D. and Ratti, C. (2010) Real-Time Urban Monitoring Using Cellular Phones: a Case-Study in Rome, IEEE Transactions on Intelligent Transportation Systems, 12(1), pp doi: /tits Campbell, K. B. and Brakewood, C. (2017) Sharing riders: How bikesharing impacts bus ridership in New York City, Transportation Research Part A: Policy and Practice. Elsevier Ltd, 100, pp doi: /j.tra Campbell, S. (1996) Green Cities, Growing Cities, Just Cities?: Urban Planning and the Contradictions of Sustainable Development, Journal of the American Planning Association, 62(3), pp Cervero, R., Caldwell, B. and Cuellar, J. (2013) Bikeand-Ride: Build It and They Will Come, Journal of Public Transportation, 16(4), pp doi: DeMaio, P. (2009) Bike-sharing: history, impacts, models of provision, and future, Journal of Public Transportation, 12(4), pp doi: Dickinson, J. E., Kingham, S., Copsey, S. and Pearlman Hougie, D. J. (2003) Employer travel plans, cycling and gender: Will travel plan measures improve the outlook for cycling to work in the UK?, Transportation Research Part D: Transport and Environment, 8(1), pp doi: /S (02) EEA (2016) Transitions towards a more sustainable mobility system, EEA Report. doi: / Emond, C., Tang, W. and Handy, S. (2009) Explaining Gender Difference in Bicycling Behavior, Transportation Research Record. doi: / European Comission (2016) Urban Europe: Statistics on Cities, Towns and Suburbs, p doi: / European Cyclist Federation (2014) Cycling facts and figures - Bicycle Usage. Available at: (Accessed: 1 August 2018). Ewing, R. and Cervero, R. (2010) Travel and the built environment, Journal of the American Planning Association, 76(3), pp doi: / Faghih-Imani, A. and Eluru, N. (2015) Analysing bicycle-sharing system user destination choice preferences: Chicago s Divvy system, Journal of Transport Geography. Elsevier Ltd, 44, pp doi: /j.jtrangeo Fishman, E., Washington, S., Haworth, N. and Watson, A. (2014) Factors influencing bike share membership: An analysis of Melbourne and Brisbane, 88
97 Transportation Research Part A: Policy and Practice. Elsevier Ltd, 71, pp doi: /j.tra Fishman, E. (2015) Bikeshare: A Review of Recent Literature, Transport Reviews: A Transnational Transdisciplinary Journal, 1647(January), pp doi: / Fishman, E., Washington, S. and Haworth, N. (2013) Bike Share: A Synthesis of the Literature, Transport Reviews, 33(2), pp doi: / Fuller, D., Gauvin, L., Kestens, Y., Daniel, M., Fournier, M., Morency, P. and Drouin, L. (2011) Use of a new public bicycle share program in Montreal, Canada, American Journal of Preventive Medicine. Elsevier Inc., 41(1), pp doi: /j.amepre Fuller, D., Gauvin, L., Kestens, Y., Morency, P. and Drouin, L. (2013) The potential modal shift and health benefits of implementing a public bicycle share program in Montreal, Canada, International Journal of Behavioral Nutrition and Physical Activity, 10, pp doi: / Garrard, J., Handy, S. and Dill, J. (2012) Women and cycling, in City Cycling. London: MIT Press, pp Garrard, J., Rose, G. and Lo, S. K. (2008) Promoting transportation cycling for women: The role of bicycle infrastructure, Preventive Medicine, 46(1), pp doi: /j.ypmed González, M. C., Hidalgo, C. A. and Barabási, A. L. (2008) Understanding individual human mobility patterns, Nature, 453(7196), pp doi: /nature Goodman, A. and Cheshire, J. (2014) Inequalities in the London bicycle sharing system revisited: Impacts of extending the scheme to poorer areas but then doubling prices, Journal of Transport Geography. Elsevier Ltd, 41, pp doi: /j.jtrangeo Goodman, A., Green, J. and Woodcock, J. (2014) The role of bicycle sharing systems in normalising the image of cycling: An observational study of London cyclists, Journal of Transport and Health. Elsevier, 1(1), pp doi: /j.jth Götschi, T., Garrard, J. and Giles-Corti, B. (2016) Cycling as a Part of Daily Life: A Review of Health Perspectives, Transport Reviews, 36(1), pp doi: / Guo, D., Zhu, X., Jin, H., Gao, P. and Andris, C. (2012) Discovering Spatial Patterns in Origin-Destination Mobility Data, Transactions in GIS, 16(3), pp doi: /j x. Hägerstrand, T. (1970) What About People in Regional Science?, Papers of the Regional Science Association, 24(1), pp doi: /j tb01464.x. Handy, S., Cao, X. and Mokhtarian, P. L. (2006) Selfselection in the relationship between the built environment and walking: Empirical evidence from Northern California, Journal of the American Planning Association, 72(1), pp doi: / Handy, S. L. and Xing, Y. (2011) Factors correlated with bicycle commuting: A study in six small U.S. cities, International Journal of Sustainable Transportation, 5(2), pp doi: / Handy, S., van Wee, B. and Kroesen, M. (2014) Promoting Cycling for Transport: Research Needs and Challenges, Transport Reviews. Taylor & Francis, 34(1), pp doi: / Harms, L., Bertolini, L. and te Brömmelstroet, M. (2014) Spatial and social variations in cycling patterns in a mature cycling country exploring differences and trends, Journal of Transport and Health. Elsevier, 1(4), 89
98 pp doi: /j.jth de Hartog, J. J., Boogaard, H., Nijland, H. and Hoek, G. (2010) Do the health benefits of cycling outweigh the risks?, Environmental Health Perspectives, 118(8), pp doi: /ehp Heesch, K. C., Giles-Corti, B. and Turrell, G. (2015) Cycling for transport and recreation: Associations with the socio-economic, natural and built environment, Health and Place. Elsevier, 36, pp doi: /j.healthplace Heikinheimo, V., Minin, E. Di, Tenkanen, H., Hausmann, A., Erkkonen, J. and Toivonen, T. (2017) User-Generated Geographic Information for Visitor Monitoring in a National Park: A Comparison of Social Media Data and Visitor Survey, ISPRS International Journal of Geo-Information. Multidisciplinary Digital Publishing Institute, 6(3), p. 85. doi: /ijgi Heinen, E. and Bohte, W. (2014) Multimodal Commuting to Work by Public Transport and Bicycle, Transportation Research Record: Journal of the Transportation Research Board, 2468, pp doi: / Heinen, E., Maat, K. and Van Wee, B. (2011) The role of attitudes toward characteristics of bicycle commuting on the choice to cycle to work over various distances, Transportation Research Part D: Transport and Environment. Elsevier Ltd, 16(2), pp doi: /j.trd Heinen, E., van Wee, B. and Maat, K. (2010) Commuting by bicycle: An overview of the literature, Transport Reviews, 30(1), pp doi: / Helsinki City Planning Department (2017) Pyöräilykatsaus 2017, Helsinki suunnittelee, 3. Helsinki City Planning Department (2018) Pyöräilybarometri 2018, Helsingin kaupunkisuunnitteluviraston liikennesuunnitteluosaston selvityksiä Available at: kaisut/julkaisut/julkaisu pdf. HelsinkiRegion (2017) Facts about the Helsinki Region. Available at: (Accessed: 30 July 2017). HSL (2013) Liikkumistottumukset Helsingin seudulla 2012, HSL:n julkaisuja, 27, p HSL (2015) HLJ - Helsingin seudun liikennejärjestelmäsuunnitelma, HSL:n julkaisuja, (3). HSL (2017) Kaupunkipyörienasiakaskysely HSL (2018a) Kaupunkipyöräverkoston laajentaminen hankesuunnitelma. Available at: 1bce832f3cc553b43f917807b53.pdf. HSL (2018b) Kaupunkipyöräverkoston laajentaminen hankesuunnitelma. HSL (2018c) Toukokuussa rikottiin pyöräilyennätyksiä. Available at: (Accessed: 2 October 2018). HSY (2015) Katsaus pääkaupunkiseudun työmatkavirtoihin Available at: t/documents/sukkulointikatsaus 2015_Versio _3.pdf (Accessed: 1 August 2018). Jäppinen, S., Toivonen, T. and Salonen, M. (2013) Modelling the potential effect of shared bicycles on public transport travel times in Greater Helsinki: An open data approach, Applied Geography, 43, pp doi: /j.apgeog Järv, O., Ahas, R. and Witlox, F. (2014) Understanding monthly variability in human activity spaces: A twelvemonth study using mobile phone call detail records, Transportation Research Part C: Emerging 90
99 Technologies. Elsevier Ltd, 38(January), pp doi: /j.trc Järv, O., Tenkanen, H. and Toivonen, T. (2017) Enhancing spatial accuracy of mobile phone data using multi-temporal dasymetric interpolation, Taylor & Francis. doi: / Ji, Y., Fan, Y., Ermagun, A., Cao, X., Wang, W. and Das, K. (2017) Public bicycle as a feeder mode to rail transit in China: The role of gender, age, income, trip purpose, and bicycle theft experience, International Journal of Sustainable Transportation. Taylor & Francis, 11(4), pp doi: / Kager, R., Bertolini, L. and Te Brömmelstroet, M. (2016) Characterisation of and reflections on the synergy of bicycles and public transport, Transportation Research Part A: Policy and Practice. Elsevier Ltd, 85, pp doi: /j.tra Kamargianni, M., Li, W., Matyas, M. and Schäfer, A. (2016) A Critical Review of New Mobility Services for Urban Transport, Transportation Research Procedia. Elsevier B.V., 14(0), pp doi: /j.trpro Kaufmann, V., Bergman, M. M. and Joye, D. (2004) Motility: Mobility as capital, International Journal of Urban and Regional Research, 28(4), pp doi: /j x. Kitchin, R. (2014) The Data Revolution: Big Data, Open Data, Data Infrastructures & Their Consequences. London. doi: / Kwan, M. (2016) Algorithmic Geographies: Big Data, Algorithmic Uncertainty, and the Production of Geographic Knowledge, Annals of the American Association of Geographers ISSN:, 0(February 2015), pp doi: / Laube, P., Imfeld, S. and Weibel, R. (2005) Discovering relative motion patterns in groups of moving point objects, International Journal of Geographical Information Science, 19(6), pp doi: / Levy, N., Golani, C. and Ben-Elia, E. (2017) An exploratory study of spatial patterns of cycling in Tel Aviv using passively generated bike-sharing data, Journal of Transport Geography. Elsevier, (October), pp doi: /j.jtrangeo Liikennevirasto (2018) Henkilöliikennetutkimus 2016, Liikenneviraston tilastoja, 1. Available at: Ma, T., Liu, C. and Erdoğan, S. (2015) Bicycle Sharing and Public Transit: Does Capital Bikeshare Affect Metrorail Ridership in Washington, D.C.?, Transportation Research Record: Journal of the Transportation Research Board, 2534(2534), pp doi: / Martens, K. (2007) Promoting bike-and-ride: The Dutch experience, Transportation Research Part A: Policy and Practice, 41(4), pp doi: /j.tra Martin, E. W. and Shaheen, S. A. (2014) Evaluating public transit modal shift dynamics in response to bikesharing: A tale of two U.S. cities, Journal of Transport Geography, 41, pp doi: /j.jtrangeo McBain, C. and Caulfield, B. (2017) An analysis of the factors influencing journey time variation in the cork public bike system, Sustainable Cities and Society, (May). doi: /j.scs Médard de Chardon, C., Caruso, G. and Thomas, I. (2016) Bike-share rebalancing strategies, patterns, and purpose, Journal of Transport Geography. Elsevier 91
100 B.V., 55, pp doi: /j.jtrangeo Médard de Chardon, C., Caruso, G. and Thomas, I. (2017) Bicycle sharing system success determinants, Transportation Research Part A: Policy and Practice, 100, pp doi: /j.tra Meddin, R. (2018) Bikesharing systems worldwide. Available at: (Accessed: 17 December 2018). Miller, H. and Han, J. (2009) Geographic Data Mining and Knowledge Discovery. doi: / Miller, H. J. (2005) A measurement theory for time geography, Geographical Analysis, 37(1), pp doi: /j x. Miller, H. J. (2017) Time Geography and Space-Time Prism, International Encyclopedia of Geography: People, the Earth, Environment and Technology, pp doi: / wbieg0431. Murphy, E. and Usher, J. (2015) The Role of Bicyclesharing in the City: Analysis of the Irish Experience, International Journal of Sustainable Transportation, 9(2), pp doi: / Naess, P. (2012) Urban form and travel behavior: experience from a Nordic context, Journal of Transport and Land Use, 5(2), pp doi: /jtlu.v5i Nair, R., Miller-Hooks, E., Hampshire, R. C. and Bušić, A. (2012) Large-Scale Vehicle Sharing Systems: Analysis of Vélib, International Journal of Sustainable Transportation, 7(1), pp doi: / Neutens, T., Van de Weghe, N., Witlox, F. and De Maeyer, P. (2008) A three-dimensional network-based space - Time prism, Journal of Geographical Systems, 10(1), pp doi: /s x. Noland, R. B., Smart, M. J. and Guo, Z. (2016) Bikeshare trip generation in New York City, Transportation Research Part A: Policy and Practice. Elsevier Ltd, 94, pp doi: /j.tra OECD (2015) Urban Mobility System Upgrade: How shared self-driving cars could change city traffic, Corporate Partnership Board Report, pp doi: /s Parkes, S. D., Marsden, G., Shaheen, S. A. and Cohen, A. P. (2013) Understanding the diffusion of public bikesharing systems: Evidence from Europe and North America, Journal of Transport Geography. Elsevier Ltd, 31, pp doi: /j.jtrangeo Pas, E. I. and Koppelman, F. S. (1987) An examination of the determinants of day-to-day variability in individuals urban travel behavior, Transportation, 14(1), pp doi: /BF Pucher, J. and Buehler, R. (2008) Making cycling irresistible: Lessons from the Netherlands, Denmark and Germany, Transport Reviews, 28(4), pp doi: / Pucher, J. and Buehler, R. (2017) Cycling towards a more sustainable transport future, Transport Reviews. Taylor & Francis, 37(6), pp doi: / Pucher, J., Dill, J. and Handy, S. (2010) Infrastructure, programs, and policies to increase bicycling: An international review, Preventive Medicine. Elsevier Inc., 50(SUPPL.), pp. S106 S125. doi: /j.ypmed Raninen, M. (2018) Helsingin kaupunkipyöräjärjestelmä: Käytön alueelliset ja ajalliset rakenteet. Master s thesis. University of 92
101 Helsinki. Raux, C., Zoubir, A. and Geyik, M. (2017) Who are bike sharing schemes members and do they travel differently? The case of Lyon s Velo v scheme, Transportation Research Part A: Policy and Practice. Elsevier, 106(April), pp doi: /j.tra Ricci, M. (2015) Bike sharing: A review of evidence on impacts and processes of implementation and operation, Research in Transportation Business and Management. Elsevier Ltd, 15, pp doi: /j.rtbm Rietveld, P. and Daniel, V. (2004) Determinants of bicycle use: Do municipal policies matter?, Transportation Research Part A: Policy and Practice, 38(7), pp doi: /j.tra Rissel, C., Bonfiglioli, C., Emilsen, A. and Smith, B. J. (2010) Representations of cycling in metropolitan newspapers - Changes over time and differences between Sydney and Melbourne, Australia, BMC Public Health, 10. doi: / Romanillos, G., Zaltz Austwick, M., Ettema, D. and De Kruijf, J. (2016) Big Data and Cycling, Transport Reviews, 36(1), pp doi: / Salonen, M. and Toivonen, T. (2013) Modelling travel time in urban networks: Comparable measures for private car and public transport, Journal of Transport Geography. Elsevier Ltd, 31, pp doi: /j.jtrangeo Schoenfelder, S. and Axhausen, K. (2010) Urban rhythms and travel behaviour: Spatial and temporal phenomena of daily travel, Urban Rhythms and Travel Behaviour: Spatial and Temporal Phenomena of Daily Travel. Sevtsuk, A. and Ratti, C. (2010) Does Urban mobility have a daily routine? Learning from the aggregate data of mobile networks, Journal of Urban Technology, 17(1), pp doi: / Shaheen, S., Zhang, H., Martin, E. and Guzman, S. (2011) China s Hangzhou Public Bicycle, Transportation Research Record: Journal of the Transportation Research Board, 2247(March 2010), pp doi: / Shaheen, S., Guzman, S. and Zhang, H. (2010) Bikesharing in Europe, the Americas, and Asia, Transportation Research Record: Journal of the Transportation Research Board, 2143, pp doi: / Sheller, M. and Urry, J. (2006) The new mobilities paradigm, Environment and Planning A, 38(2), pp doi: /a Shen, Y., Zhang, X. and Zhao, J. (2018) Mobility Behaviors of Stationless Bike Sharing in Singapore, The 97th Annual Meeting of Transportation Research Board. Taylor & Francis, doi: / Singleton, P. and Clifton, K. (2014) Exploring Synergy in Bicycle and Transit Use, Transportation Research Record: Journal of the Transportation Research Board, 2417, pp doi: / Song, C., Qu, Z., Blumm, N. and Barabási, A.-L. (2010) Limits of Predictability in Human Mobility, Science, 327(5968), p LP Available at: bstract. Statistics Finland (2013) Kolmasosa työssäkäyvistä pendelöi. Available at: 11_001.html (Accessed: 1 August 2018). Statistics Finland (2017) Pääkaupunkiseudun postinumeroalueet. Available at: edot/kartta- 93
102 aineistot/taustakartat/sivut/paakaupunkiseudunpostinu meroalueet.aspx (Accessed: 14 September 2018). Steiger, E., de Albuquerque, J. P. and Zipf, A. (2015) An Advanced Systematic Literature Review on Spatiotemporal Analyses of Twitter Data, Transactions in GIS, 19(6), pp doi: /tgis Tarnanen, A. (2017) Pyöräilyn nopeuksien ja matkaaikojen paikkatietopohjainen mallinnus pääkaupunkiseudulla. Master s thesis. University of Helsinki. Tarnanen, A., Salonen, M., Willberg, E. and Toivonen, T. (2017) Pyöräilyn reitit ja sujuvuus. Helsingin kaupunki, kaupunkiympäristön toimiala. Tenkanen, H. (2013) Geographic knowledge discovery from sparse GPS-data - Revealing spatio-temporal patterns of Amazonian river transports. Master s thesis. University of Helsinki. Tenkanen, H. (2017) Capturing time in space: Dynamic analysis of accessibility and mobility to support spatial planning with open data and tools. University of Helsinki. Tulenheimo, M. (2018) Katsaus kaupunkipyörien tilanteeseen Suomessa. Presentation at the VeloFinland seminar UNFCCC. Conference of the Parties (COP) (2015) Paris Climate Change Conference-November 2015, COP 21, Adoption of the Paris Agreement. Proposal by the President., 21932(December), p. 32. doi: FCCC/CP/2015/L.9/Rev.1. Vogel, M., Hamon, R., Lozenguez, G., Merchez, L., Abry, P., Barnier, J., Borgnat, P., Flandrin, P., Mallon, I. and Robardet, C. (2014) From bicycle sharing system movements to users : a typology of Vélo v cyclists in Lyon based on large-scale behavioural dataset, JOURNAL OF TRANSPORT OF GEOGRRAPHY. Elsevier Ltd. doi: /j.jtrangeo Vuori, P. and Laakso, S. (2017) Helsingin ja Helsingin seudun väestöennuste Available at: _04_Tilastoja_12_Vuori_Laakso.pdf. Woodcock, J., Tainio, M., Cheshire, J., O Brien, O. and Goodman, A. (2014) Health effects of the London bicycle sharing system: Health impact modelling study, BMJ (Online), 348(February), pp doi: /bmj.g425. Xu, J., Xu, J., Cao, G., Xu, H., Xu, M. and Zheng, N. (2017) Towards optimal free-of-charge trip planning in bike-sharing systems, Proceedings - 18th IEEE International Conference on Mobile Data Management, MDM IEEE, pp doi: /MDM Yan, Y., Tao, Y., Xu, J., Ren, S. and Lin, H. (2018) Visual Analytics of Bike-sharing Data based on Tensor Factorization, Journal of Visualization. Springer Berlin Heidelberg, (d). doi: /s Zaltz Austwick, M., O Brien, O., Strano, E. and Viana, M. (2013) The Structure of Spatial Networks and Communities in Bicycle Sharing Systems, PLoS ONE, 8(9). doi: /journal.pone Zhang, J., Pan, X., Li, M. and Yu, P. S. (2016) Bicyclesharing system analysis and trip prediction, Proceedings - IEEE International Conference on Mobile Data Management, 2016 July, pp doi: /MDM Zhao, J., Wang, J. and Deng, W. (2015) Exploring bikesharing travel time and trip chain by gender and day of the week, Transportation Research Part C: Emerging Technologies. Elsevier Ltd, 58, pp doi: /j.trc Zhou, X. (2015) Understanding spatiotemporal patterns of biking behavior by analyzing massive bike sharing data in Chicago, PLoS ONE, 10(10), pp doi: /journal.pone
103 APPENDICES Appendix 1 The complete table of user variables and their explanations in the bike sharing dataset Variable name Value type Explanation id count User ID formula text User subscription type (day, week, year) hsl_age absolute value User's age hsl_gender binary User's gender hsl_postal_code text User's home postal area code hsl_region text User's home postal area name hsl_city text User's home city hsl_country text User's home country insidearea binary Binary value to indicate if the user lives in a postal area, where there is at least one bicycle sharing station trip_count count Count of user's trips departure_station1_nunique number of unique Number of unique departure stations return_station1_nunique number of unique Number of unique return stations dep_ret_count_ratio ratio Ratio between the number of unique departure and return stations duration_mean mean Mean duration of the trip (s) duration_median median Median duration of the trip (s) speed_mean mean Mean speed of the trip (km/h) speed_median median Median speed of the trip (km/h) distance_mean mean Mean distance of the trip (m) distance_median median Median distance of the trip (m) DayOfTheYear_nunique number of unique Number of unique usage days month number of unique Number of unique user months diff_mean diff_median loop_count mean median count Mean difference beween the shortest routes and the realized routes Median difference beween the shortest routes and the realized routes Count of trips where the departure station and the return station of the trip have been the same dephour_nunique number of unique Number of unique departure hours 95
104 Variable name Value type Explanation rethour_nunique number of unique Number of unique return hours dep_ret_hour_ratio ratio Ratio between unique departure and return hours depstatstd standard deviation Standard deviation of departures by station (only the stations used included) depstatstd_all standard deviation Standard deviation of departures by station (all the stations included) depstatstd standard deviation Standard deviation of departures by hour (only the stations used included depstatstd_all standard deviation Standard deviation of departures by hour (all the stations included) PT_dep_count count PT_ret _count count PT_trip_count count Count of potential public transport departures (the departure station of the trip in the immediate vicinity of a metro or train station) Count of potential public transport return (the return station of the trip in the immediate vicinity of a metro or train station) Count of potential public transport trips (the departure or the return station of the trip in the immediate vicinity of a metro or train station) dep_pt_pros ret_pt_pros PT_trip_pros depstartfromret_count neardepstartfromret_count depstartfromret_ratio ratio ratio ratio count count ratio Ratio of potential public transport departures from all user's trips (the departure station of the trip in the immediate vicinity of a metro or train station) Ratio of potential public transport return from all user's trips (the return station of the trip in the immediate vicinity of a metro or train station) Ratio of potential public transport trips from all user's trips (the departure station or the return station of the trip in the immediate vicinity of a metro or train station) Count of trips where the departure station has been the same as the return station of the earlier trip and both have been taken on the same calendar day Count of trips where the departure station has been the same or maximum 500m away from the return station of the earlier trip and both have been taken on the same calendar day Ratio of trips where the departure station has been the same as the return station of the earlier trip and both have been taken on the same calendar day neardepstartfromret_ratio Days_RetToStartDep_ratio ratio ratio Days_NearRetToStartDep_ratio ratio loop_ratio ratio userdaycount count Count of unique user days Ratio of trips where the departure station has been the same or maximum 500m away from the return station of the earlier trip and both have been taken on the same calendar day Ratio of days where the day's first departure station has been the same as the return station of the day's last trip Ratio of days where the day's first departure station has been the same or maximum 500m away from the return station of the day's last trip Ratio of trips that have been loops (i.e. trip has the same departure and return station) userdayratio ratio Ratio of user days against all days during the operable season tripsperday ratio The number of trips per day by user compared to the season length weekdaytripcount count Count of user's weekday trips weekendtripcount count Count of user's weekend trips week_weekend_absratio ratio Absolute ratio of weekday trips to weekend trips week_weekend_relaratio ratio Relative ratio of weekday trips to weekend trips (the share of weekdays and weekend days normalized) 96

105 Appendix 2. Full t-test results for gender analyses. 1= Male, 2=Female 97
106 98

107 Appendix 3. Full t-test results for home area analyses. 0 = Users living outside station coverage area 1 = Users living inside station coverage area 99
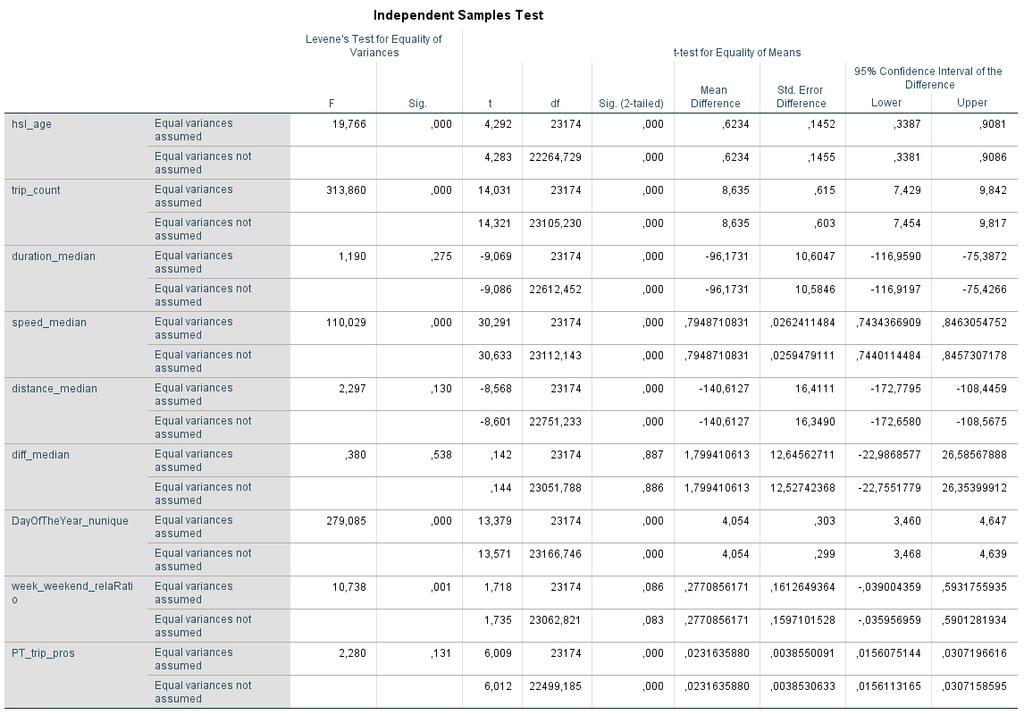
108 100
109 Appendix 4. Full t-test results for age group analyses. Age groups = 10-19,20-29,30-39,40-49,50-59,60-69,
110 Tukey HSD Dependent Variable trip_count 10,0 20,0 30,0 40,0 50,0 60,0 70,0 Mean Difference (I-J) Std. Error Sig. 95% Confidence Interval Upper Lower Bound Bound Tukey HSD Dependent Variable Mean Difference (I-J) Std. Error Sig. Multiple Comparisons 95% Confidence Interval Lower Upper Bound Bound tripsperday 10,0 20, , duration_ * 10,0 20,0 154, speed_m 10,0 20, * median edian 30,0 8,822 * , * ,0 125,8601 * , * ,0 14,950 * , * , , * ,0 14,337 * , * , , ,0 17,444 * , * ,0-138,9861 * , * ,0 13,627 * , * ,0-264,6695 * , * , ,0 10, ,0 10,0-154,4255 * ,0 10, * ,0 6,103 * , * , , ,0 12,231 * , * ,0-139,9707 * , * ,0 11,618 * , * ,0-222,0510 * , * ,0 14,725 * , * ,0-293,4116 * , * , , ,0-419,0950 * , * ,0-8,822 * ,0 10, * ,0 10,0-125,8601 * ,0 10, * ,0-6,103 * , * , , ,0 6,129 * , * ,0-111,4052 * , * ,0 5,516 * , * ,0-193,4855 * , * ,0 8,622 * , * ,0-264,8462 * , * , , ,0-390,5295 * , * ,0-14,950 * ,0 10, * ,0 10, ,0 10, * ,0-12,231 * , * ,0 139,9707 * , * ,0-6,129 * , * ,0 111,4052 * , * , , ,0-82,0803 * , * , , ,0-153,4409 * , * , , ,0-279,1243 * , * ,0-14,337 * ,0 10, * ,0 10, ,0 10, ,0-11,618 * , * ,0 222,0510 * , * ,0-5,516 * , * ,0 193,4855 * , * , , ,0 82,0803 * , * , , , , * , , , , * ,0-17,444 * ,0 10, * ,0 10,0 138,9861 * ,0 10, * ,0-14,725 * , * ,0 293,4116 * , * ,0-8,622 * , * ,0 264,8462 * , * , , ,0 153,4409 * , * , , , , * , , , ,0, * ,0 * 10,0-13, ,0 -, * * ,0 10,0 264, ,0 10,0-1, * , , ,0 419,0950 * ,0-2, * , , ,0 390,5295 * ,0-2, * , , ,0 279,1243 * ,0-1, * , , , ,0-1, * , , , ,0 -, * Tukey HSD Dependent Variable Mean Difference (I-J) Std. Error Sig. 95% Confidence Interval Lower Upper Bound Bound Tukey HSD Dependent Variable Mean Difference (I-J) Std. Error Sig. 95% Confidence Interval Lower Upper Bound Bound distance_median 10,0 20,0 30,0 40,0 50,0 60,0 70,0 diff_median 10,0 20, , ,0 PT_trip_pr 10,0 week_wee 10,0 * , , os kend_ 30, , ,0 * , ,0-2, * relaratio * 40,0-214, , , ,0-5, * ,0-290,2856 * , , ,0-5, * ,0-366,8119 * , , ,0-4, * , , ,0, * , , ,0-204, ,0 * ,0 10, ,0 10, * 30,0-103, , ,0 -, * ,0-1, * * 40,0-178, , ,0 * ,0 -, * ,0-4, * * 50,0-254, , ,0 * , ,0-4, * * 60,0-331, , ,0 * , ,0-4, * , , ,0 * ,0, * , , ,0-182, ,0 * ,0 10, ,0 10,0 2, * * 20,0 103, , ,0, * ,0 1, * * 40,0-75, , ,0 * , ,0-2, * * 50,0-151, , ,0 * , ,0-2, * * 60,0-227, , ,0 * ,0, * ,0-2, * , , ,0 * ,0, * , ,0 214,5548 * ,0 10, ,0 10, ,0 10,0 5, * * 20,0 178, , ,0 * ,0, * ,0 4, * * 30,0 75, , ,0 * , ,0 2, * , , ,0 * , , * 60,0-152, , ,0 * ,0, * , , , ,0 * ,0, * ,0 4, * ,0 290,2856 * ,0 10, ,0 10, ,0 10,0 5, * * 20,0 254, , ,0 * , ,0 4, * ,0 151,1058 * , ,0 * , ,0 2, * , , ,0 * , , , , , , , , ,0, * ,0 4, * ,0 366,8119 * ,0 10, ,0 10, ,0 10,0 4, * * 20,0 331, , ,0 * , ,0 4, * * 30,0 227, , ,0 * ,0 -, * ,0 2, * * 40,0 152, , ,0 * ,0 -, * , , , , , , , ,0, * ,0 4, * , ,0 10, ,0 10,0 -, * ,0 10, , , ,0 * ,0 -, * , , , ,0 * ,0 -, * , , , ,0 * ,0 -, * ,0-4, * , , ,0 -, * ,0-4, * , , ,0 -, * ,0-4, *

111 Appendix 5. Full t-test results for subscription type analyses. Subscription type groups: 1 = Day subscription, 2 = Week subscription, 3 = Year subscription 103
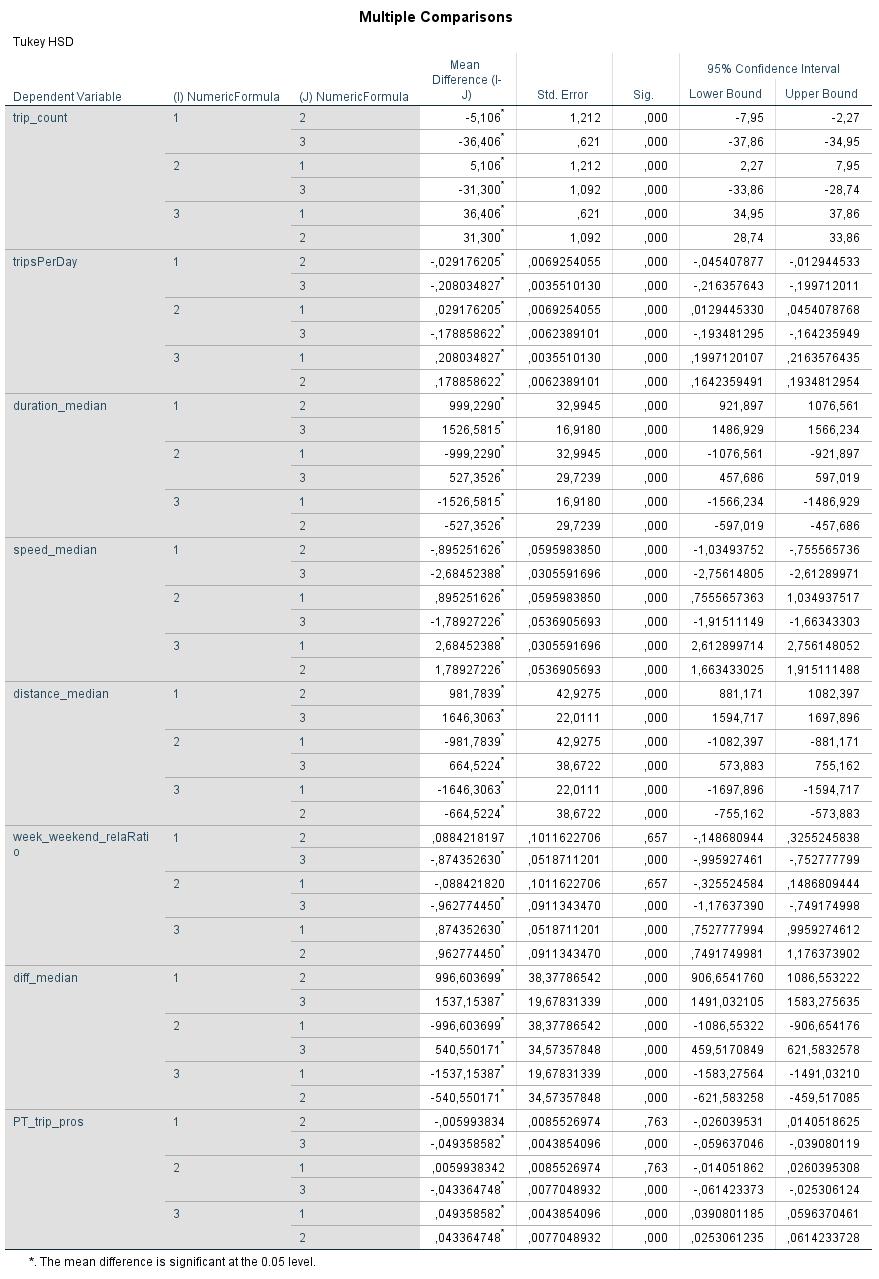
112 104
: 1,")
113 Appendix 6. Full t-test results for use activity analyses. Use activity groups (from lowest to highest by trip count quantiles): 1, 2, 3, 4, 5 105
Capacity Utilization
 Capacity Utilization Tim Schöneberg 28th November Agenda Introduction Fixed and variable input ressources Technical capacity utilization Price based capacity utilization measure Long run and short run
Information on preparing Presentation
 Information on preparing Presentation Seminar on big data management Lecturer: Spring 2017 20.1.2017 1 Agenda Hints and tips on giving a good presentation Watch two videos and discussion 22.1.2017 2 Goals
PYÖRÄILY OSANA HELSINGIN SEUDUN KESTÄVÄÄ KAUPUNKILIIKENNETTÄ
 PYÖRÄILY OSANA HELSINGIN SEUDUN KESTÄVÄÄ KAUPUNKILIIKENNETTÄ UUDET AINEISTOT SUUNNITTELUN TUKENA Henrikki Tenkanen Digital Geography Lab Helsingin yliopisto 29.1.2018 DIGITAL GEOGRAPHY LAB Tuuli Toivonen
On instrument costs in decentralized macroeconomic decision making (Helsingin Kauppakorkeakoulun julkaisuja ; D-31)
") On instrument costs in decentralized macroeconomic decision making (Helsingin Kauppakorkeakoulun julkaisuja ; D-31) Juha Kahkonen Click here if your download doesn"t start automatically On instrument costs
On instrument costs in decentralized macroeconomic decision making (Helsingin Kauppakorkeakoulun julkaisuja ; D-31) Juha Kahkonen Click here if your download doesn"t start automatically On instrument costs
Efficiency change over time
 Efficiency change over time Heikki Tikanmäki Optimointiopin seminaari 14.11.2007 Contents Introduction (11.1) Window analysis (11.2) Example, application, analysis Malmquist index (11.3) Dealing with panel
Results on the new polydrug use questions in the Finnish TDI data
 Results on the new polydrug use questions in the Finnish TDI data Multi-drug use, polydrug use and problematic polydrug use Martta Forsell, Finnish Focal Point 28/09/2015 Martta Forsell 1 28/09/2015 Esityksen
Kansalaisten näkemykset sekä julkisen liikenteen ja pyöräilyn innovaatiot
 Kansalaisten näkemykset sekä julkisen liikenteen ja pyöräilyn innovaatiot Venla Virkamäki Tutkija Suomen ympäristökeskus 27.1.2014 Tulevaisuuden liikenne- ja innovaatiopolitiikka -seminaari FIPTrans kyselytutkimus
Other approaches to restrict multipliers
 Other approaches to restrict multipliers Heikki Tikanmäki Optimointiopin seminaari 10.10.2007 Contents Short revision (6.2) Another Assurance Region Model (6.3) Cone-Ratio Method (6.4) An Application of
Network to Get Work. Tehtäviä opiskelijoille Assignments for students. www.laurea.fi
 Network to Get Work Tehtäviä opiskelijoille Assignments for students www.laurea.fi Ohje henkilöstölle Instructions for Staff Seuraavassa on esitetty joukko tehtäviä, joista voit valita opiskelijaryhmällesi
On instrument costs in decentralized macroeconomic decision making (Helsingin Kauppakorkeakoulun julkaisuja ; D-31)
") On instrument costs in decentralized macroeconomic decision making (Helsingin Kauppakorkeakoulun julkaisuja ; D-31) Juha Kahkonen Click here if your download doesn"t start automatically On instrument costs
On instrument costs in decentralized macroeconomic decision making (Helsingin Kauppakorkeakoulun julkaisuja ; D-31) Juha Kahkonen Click here if your download doesn"t start automatically On instrument costs
The role of 3dr sector in rural -community based- tourism - potentials, challenges
 The role of 3dr sector in rural -community based- tourism - potentials, challenges Lappeenranta, 5th September 2014 Contents of the presentation 1. SEPRA what is it and why does it exist? 2. Experiences
MEETING PEOPLE COMMUNICATIVE QUESTIONS
 Tiistilän koulu English Grades 7-9 Heikki Raevaara MEETING PEOPLE COMMUNICATIVE QUESTIONS Meeting People Hello! Hi! Good morning! Good afternoon! How do you do? Nice to meet you. / Pleased to meet you.
KETKÄ KAUPUNKIPYÖRILLÄ PYÖRÄILEVÄT JA MITEN ERI KÄYTTÄJÄRYHMIEN MATKAT EROAVAT TOISISTAAN
 KETKÄ KAUPUNKIPYÖRILLÄ PYÖRÄILEVÄT JA MITEN ERI KÄYTTÄJÄRYHMIEN MATKAT EROAVAT TOISISTAAN - TARKASTELUJA HELSINGIN KAUPUNKIPYÖRÄAINEISTOON PERUSTUEN Elias Willberg, Maria Salonen, Tuuli Toivonen Helsingin
On instrument costs in decentralized macroeconomic decision making (Helsingin Kauppakorkeakoulun julkaisuja ; D-31)
") On instrument costs in decentralized macroeconomic decision making (Helsingin Kauppakorkeakoulun julkaisuja ; D-31) Juha Kahkonen Click here if your download doesn"t start automatically On instrument costs
On instrument costs in decentralized macroeconomic decision making (Helsingin Kauppakorkeakoulun julkaisuja ; D-31) Juha Kahkonen Click here if your download doesn"t start automatically On instrument costs
Uusi Ajatus Löytyy Luonnosta 4 (käsikirja) (Finnish Edition)
 (Finnish Edition)") Uusi Ajatus Löytyy Luonnosta 4 (käsikirja) (Finnish Edition) Esko Jalkanen Click here if your download doesn"t start automatically Uusi Ajatus Löytyy Luonnosta 4 (käsikirja) (Finnish Edition) Esko Jalkanen
Uusi Ajatus Löytyy Luonnosta 4 (käsikirja) (Finnish Edition) Esko Jalkanen Click here if your download doesn"t start automatically Uusi Ajatus Löytyy Luonnosta 4 (käsikirja) (Finnish Edition) Esko Jalkanen
Gap-filling methods for CH 4 data
 Gap-filling methods for CH 4 data Sigrid Dengel University of Helsinki Outline - Ecosystems known for CH 4 emissions; - Why is gap-filling of CH 4 data not as easy and straight forward as CO 2 ; - Gap-filling
Infrastruktuurin asemoituminen kansalliseen ja kansainväliseen kenttään Outi Ala-Honkola Tiedeasiantuntija
 Infrastruktuurin asemoituminen kansalliseen ja kansainväliseen kenttään Outi Ala-Honkola Tiedeasiantuntija 1 Asemoitumisen kuvaus Hakemukset parantuneet viime vuodesta, mutta paneeli toivoi edelleen asemoitumisen
RANTALA SARI: Sairaanhoitajan eettisten ohjeiden tunnettavuus ja niiden käyttö hoitotyön tukena sisätautien vuodeosastolla
 TURUN YLIOPISTO Hoitotieteen laitos RANTALA SARI: Sairaanhoitajan eettisten ohjeiden tunnettavuus ja niiden käyttö hoitotyön tukena sisätautien vuodeosastolla Pro gradu -tutkielma, 34 sivua, 10 liitesivua
1. SIT. The handler and dog stop with the dog sitting at heel. When the dog is sitting, the handler cues the dog to heel forward.
 START START SIT 1. SIT. The handler and dog stop with the dog sitting at heel. When the dog is sitting, the handler cues the dog to heel forward. This is a static exercise. SIT STAND 2. SIT STAND. The
Innovative and responsible public procurement Urban Agenda kumppanuusryhmä. public-procurement
 Innovative and responsible public procurement Urban Agenda kumppanuusryhmä https://ec.europa.eu/futurium/en/ public-procurement Julkiset hankinnat liittyvät moneen Konsortio Lähtökohdat ja tavoitteet Every
Tarua vai totta: sähkön vähittäismarkkina ei toimi? 11.2.2015 Satu Viljainen Professori, sähkömarkkinat
 Tarua vai totta: sähkön vähittäismarkkina ei toimi? 11.2.2015 Satu Viljainen Professori, sähkömarkkinat Esityksen sisältö: 1. EU:n energiapolitiikka on se, joka ei toimi 2. Mihin perustuu väite, etteivät
The CCR Model and Production Correspondence
 The CCR Model and Production Correspondence Tim Schöneberg The 19th of September Agenda Introduction Definitions Production Possiblity Set CCR Model and the Dual Problem Input excesses and output shortfalls
Smart specialisation for regions and international collaboration Smart Pilots Seminar
 Smart specialisation for regions and international collaboration Smart Pilots Seminar 23.5.2017 Krista Taipale Head of Internaltional Affairs Helsinki-Uusimaa Regional Council Internationalisation
Requirements for Modelling Bicycle Traffic A project funded by Ministry of Transportation and Telecommunications (Finland)
") Requirements for Modelling Bicycle Traffic A project funded by Ministry of Transportation and Telecommunications (Finland) Jukka Räsänen, Tuuli Järvi-Nykänen (Technical Research Centre of Finland) Jukka-Matti
Requirements for Modelling Bicycle Traffic A project funded by Ministry of Transportation and Telecommunications (Finland) Jukka Räsänen, Tuuli Järvi-Nykänen (Technical Research Centre of Finland) Jukka-Matti
Helsinki Metropolitan Area Council
 Helsinki Metropolitan Area Council Current events at YTV The future of YTV and HKL On the initiative of 4 city mayors the Helsinki region negotiation consortiums coordinating group have presented that:
GOOD WORK LONGER CAREER:
 Juhani Ilmarinen, Ville Ilmarinen, Pekka Huuhtanen, Veikko Louhevaara, Ove Näsman GOOD WORK LONGER CAREER: WORK WELL-BEING IN FINNISH TECHNOLOGY INDUSTRIES 2010-2015 Background Collective agreement between
16. Allocation Models
 16. Allocation Models Juha Saloheimo 17.1.27 S steemianalsin Optimointiopin seminaari - Sks 27 Content Introduction Overall Efficienc with common prices and costs Cost Efficienc S steemianalsin Revenue
Land-Use Model for the Helsinki Metropolitan Area
 Land-Use Model for the Helsinki Metropolitan Area Paavo Moilanen Introduction & Background Metropolitan Area Council asked 2005: What is good land use for the transport systems plan? At first a literature
7.4 Variability management
 7.4 Variability management time... space software product-line should support variability in space (different products) support variability in time (maintenance, evolution) 1 Product variation Product
TIEKE Verkottaja Service Tools for electronic data interchange utilizers. Heikki Laaksamo
 TIEKE Verkottaja Service Tools for electronic data interchange utilizers Heikki Laaksamo TIEKE Finnish Information Society Development Centre (TIEKE Tietoyhteiskunnan kehittämiskeskus ry) TIEKE is a neutral,
AYYE 9/ HOUSING POLICY
 AYYE 9/12 2.10.2012 HOUSING POLICY Mission for AYY Housing? What do we want to achieve by renting apartments? 1) How many apartments do we need? 2) What kind of apartments do we need? 3) To whom do we
Constructive Alignment in Specialisation Studies in Industrial Pharmacy in Finland
 Constructive Alignment in Specialisation Studies in Industrial Pharmacy in Finland Anne Mari Juppo, Nina Katajavuori University of Helsinki Faculty of Pharmacy 23.7.2012 1 Background Pedagogic research
Informaatioteknologia vaikuttaa ihmisten käyttäytymiseen ja asenteisiin
 Infotech Seminar, Oulu, November 11, 2005 Informaatioteknologia vaikuttaa ihmisten käyttäytymiseen ja asenteisiin Prof. Harri Oinas-Kukkonen Dept. Information Processing Science University of Oulu Outline
Social and Regional Economic Impacts of Use of Bioenergy and Energy Wood Harvesting in Suomussalmi
 Social and Regional Economic Impacts of Use of Bioenergy and Energy Wood Harvesting in Suomussalmi Green Cities and Settlements 18.2.2014 Ville Manninen Writers Project group Sirpa Korhonen, Anna Mari
JA CHALLENGE 18.-19.4.2013. Anna-Mari Sopenlehto Central Administration The City Development Group Business Developement and Competence
 JA CHALLENGE 18.-19.4.2013 Anna-Mari Sopenlehto Central Administration The City Development Group Business Developement and Competence 12.11.2014 Challenges of the City of Turku What kind of city you would
Miehittämätön meriliikenne
 Rolls-Royce & Unmanned Shipping Ecosystem Miehittämätön meriliikenne Digimurros 2020+ 17.11. 2016 September 2016 2016 Rolls-Royce plc The 2016 information Rolls-Royce in this plc document is the property
National Building Code of Finland, Part D1, Building Water Supply and Sewerage Systems, Regulations and guidelines 2007
 National Building Code of Finland, Part D1, Building Water Supply and Sewerage Systems, Regulations and guidelines 2007 Chapter 2.4 Jukka Räisä 1 WATER PIPES PLACEMENT 2.4.1 Regulation Water pipe and its
momo Car-Sharing sharing smart solutions for urban transport
 more options for energy efficient mobility through Car-Sharing momo Car-Sharing sharing smart solutions for urban transport Michael Glotz-Richter, Senior Project Manager Sustainable Mobility, Free Hanseatic
The Finnish healthcare service grid and access in rural Finland
 The Finnish healthcare service grid and access in rural Finland Kimmo Parhiala, M.Soc.Sc Development Manager, National Institute for Health and Welfare TW: @parhialakimmo 20.6.2017 The Finnish healthcare
Kysymys 5 Compared to the workload, the number of credits awarded was (1 credits equals 27 working hours): (4)
: (4)") Tilasto T1106120-s2012palaute Kyselyn T1106120+T1106120-s2012palaute yhteenveto: vastauksia (4) Kysymys 1 Degree programme: (4) TIK: TIK 1 25% ************** INF: INF 0 0% EST: EST 0 0% TLT: TLT 0 0% BIO:
Tilasto T1106120-s2012palaute Kyselyn T1106120+T1106120-s2012palaute yhteenveto: vastauksia (4) Kysymys 1 Degree programme: (4) TIK: TIK 1 25% ************** INF: INF 0 0% EST: EST 0 0% TLT: TLT 0 0% BIO:
Use of spatial data in the new production environment and in a data warehouse
 Use of spatial data in the new production environment and in a data warehouse Nordic Forum for Geostatistics 2007 Session 3, GI infrastructure and use of spatial database Statistics Finland, Population
Teacher's Professional Role in the Finnish Education System Katriina Maaranen Ph.D. Faculty of Educational Sciences University of Helsinki, Finland
 Teacher's Professional Role in the Finnish Education System Katriina Maaranen Ph.D. Faculty of Educational Sciences University of Helsinki, Finland www.helsinki.fi/yliopisto This presentation - Background
The BaltCICA Project Climate Change: Impacts, Costs and Adaptation in the Baltic Sea Region
 The BaltCICA Project Climate Change: Impacts, Costs and Adaptation in the Baltic Sea Region The BaltCICA Project is designed to focus on the most imminent problems that climate change is likely to cause
Skene. Games Refueled. Muokkaa perustyyl. napsautt. @Games for Health, Kuopio. 2013 kari.korhonen@tekes.fi. www.tekes.fi/skene
 Skene Muokkaa perustyyl. Games Refueled napsautt. @Games for Health, Kuopio Muokkaa alaotsikon perustyyliä napsautt. 2013 kari.korhonen@tekes.fi www.tekes.fi/skene 10.9.201 3 Muokkaa Skene boosts perustyyl.
Keskeisiä näkökulmia RCE-verkoston rakentamisessa Central viewpoints to consider when constructing RCE
 Keskeisiä näkökulmia RCE-verkoston rakentamisessa Central viewpoints to consider when constructing RCE Koordinaattorin valinta ja rooli Selection and role of the coordinator Painopiste: tiede hallinto
Statistical design. Tuomas Selander
 Statistical design Tuomas Selander 28.8.2014 Introduction Biostatistician Work area KYS-erva KYS, Jyväskylä, Joensuu, Mikkeli, Savonlinna Work tasks Statistical methods, selection and quiding Data analysis
MUSEOT KULTTUURIPALVELUINA
 Elina Arola MUSEOT KULTTUURIPALVELUINA Tutkimuskohteena Mikkelin museot Opinnäytetyö Kulttuuripalvelujen koulutusohjelma Marraskuu 2005 KUVAILULEHTI Opinnäytetyön päivämäärä 25.11.2005 Tekijä(t) Elina
HITSAUKSEN TUOTTAVUUSRATKAISUT
 Kemppi ARC YOU GET WHAT YOU MEASURE OR BE CAREFUL WHAT YOU WISH FOR HITSAUKSEN TUOTTAVUUSRATKAISUT Puolitetaan hitsauskustannukset seminaari 9.4.2008 Mikko Veikkolainen, Ratkaisuliiketoimintapäällikkö
Guidebook for Multicultural TUT Users
 1 Guidebook for Multicultural TUT Users WORKPLACE PIRKANMAA-hankkeen KESKUSTELUTILAISUUS 16.12.2010 Hyvää käytäntöä kehittämässä - vuorovaikutusopas kansainvälisille opiskelijoille TTY Teknis-taloudellinen
Windows Phone. Module Descriptions. Opiframe Oy puh. +358 44 7220800 eero.huusko@opiframe.com. 02600 Espoo
 Windows Phone Module Descriptions Mikä on RekryKoulutus? Harvassa ovat ne työnantajat, jotka löytävät juuri heidän alansa hallitsevat ammatti-ihmiset valmiina. Fiksuinta on tunnustaa tosiasiat ja hankkia
Increase of opioid use in Finland when is there enough key indicator data to state a trend?
 Increase of opioid use in Finland when is there enough key indicator data to state a trend? Martta Forsell, Finnish Focal Point 28.9.2015 Esityksen nimi / Tekijä 1 Martta Forsell Master of Social Sciences
Oma sininen meresi (Finnish Edition)
") Oma sininen meresi (Finnish Edition) Hannu Pirilä Click here if your download doesn"t start automatically Oma sininen meresi (Finnish Edition) Hannu Pirilä Oma sininen meresi (Finnish Edition) Hannu Pirilä
Oma sininen meresi (Finnish Edition) Hannu Pirilä Click here if your download doesn"t start automatically Oma sininen meresi (Finnish Edition) Hannu Pirilä Oma sininen meresi (Finnish Edition) Hannu Pirilä
VUOSI 2015 / YEAR 2015
 VUOSI 2015 / YEAR 2015 Kansainvälisen opetuksen ja tutkimustoiminnan kehittäminen Developing international teaching and research activities Rehtorin strateginen rahoitus vuosille 2014-2016 / Strategic
Travel Getting Around
 - Location Olen eksyksissä. Not knowing where you are Voisitko näyttää kartalta missä sen on? Asking for a specific location on a map Mistä täällä on? Asking for a specific...wc?...pankki / rahanvaihtopiste?...hotelli?...huoltoasema?...sairaala?...apteekki?...tavaratalo?...ruokakauppa?...bussipysäkki?
LYTH-CONS CONSISTENCY TRANSMITTER
 LYTH-CONS CONSISTENCY TRANSMITTER LYTH-INSTRUMENT OY has generate new consistency transmitter with blade-system to meet high technical requirements in Pulp&Paper industries. Insurmountable advantages are
1. Liikkuvat määreet
 1. Liikkuvat määreet Väitelauseen perussanajärjestys: SPOTPA (subj. + pred. + obj. + tapa + paikka + aika) Suora sanajärjestys = subjekti on ennen predikaattia tekijä tekeminen Alasääntö 1: Liikkuvat määreet
7. Product-line architectures
 7. Product-line architectures 7.1 Introduction 7.2 Product-line basics 7.3 Layered style for product-lines 7.4 Variability management 7.5 Benefits and problems with product-lines 1 Short history of software
Fighting diffuse nutrient load: Multifunctional water management concept in natural reed beds
 PhD Anne Hemmi 14.2.2013 RRR 2013 Conference in Greifswald, Germany Fighting diffuse nutrient load: Multifunctional water management concept in natural reed beds Eutrophication in surface waters High nutrient
Julkaisun laji Opinnäytetyö. Sivumäärä 43
 OPINNÄYTETYÖN KUVAILULEHTI Tekijä(t) SUKUNIMI, Etunimi ISOVIITA, Ilari LEHTONEN, Joni PELTOKANGAS, Johanna Työn nimi Julkaisun laji Opinnäytetyö Sivumäärä 43 Luottamuksellisuus ( ) saakka Päivämäärä 12.08.2010
Tampere-Pirkkala airport Survey on noise
 Tampere-Pirkkala airport Survey on noise Satu Routama Presentation in N-ALM/Copenhagen May 206, Mikko Viinikainen Tampere-Pirkkala airport In 204 400 000 pax (4th biggest in Finland) 5 000 ops (3rd biggest
Nuku hyvin, pieni susi -????????????,?????????????????. Kaksikielinen satukirja (suomi - venäjä) (www.childrens-books-bilingual.com) (Finnish Edition)
 (www.childrens-books-bilingual.com) (Finnish Edition)") Nuku hyvin, pieni susi -????????????,?????????????????. Kaksikielinen satukirja (suomi - venäjä) (www.childrens-books-bilingual.com) (Finnish Edition) Click here if your download doesn"t start automatically
Nuku hyvin, pieni susi -????????????,?????????????????. Kaksikielinen satukirja (suomi - venäjä) (www.childrens-books-bilingual.com) (Finnish Edition) Click here if your download doesn"t start automatically
Naisnäkökulma sijoittamiseen. 24.3.2007 Vesa Puttonen
 Naisnäkökulma sijoittamiseen 24.3.2007 Vesa Puttonen Miten sukupuolella voi olla mitään tekemistä sijoittamisen kanssa??? Naiset elävät (keskimäärin) pidempään kuin miehet Naiset saavat (keskimäärin) vähemmän
Supply Chain Management and Material Handling in Paper Industry Case Tervakoski Oy
 Tampere University of Applied Sciences Paper technology International Pulp and Paper Technology Supply Chain Management and Material Handling in Paper Industry Case Tervakoski Oy Supervisor Commissioned
Returns to Scale II. S ysteemianalyysin. Laboratorio. Esitelmä 8 Timo Salminen. Teknillinen korkeakoulu
 Returns to Scale II Contents Most Productive Scale Size Further Considerations Relaxation of the Convexity Condition Useful Reminder Theorem 5.5 A DMU found to be efficient with a CCR model will also be
Copernicus, Sentinels, Finland. Erja Ämmälahti Tekes,
 Copernicus, Sentinels, Finland Erja Ämmälahti Tekes, 24.5.2016 Finnish Space industry in the European context European Space industry has been constantly growing and increasing its direct employment in
Heisingin kaupungin tietokeskus Helsingfors stads faktacentral City of Helsinki Urban Facts 0N THE EFFECTS 0F URBAN NATURAL AMENITIES, ARCHITECTURAL
 Heisingin kaupungin tietokeskus - /igc' ^' 0N THE EFFECTS 0F URBAN NATURAL TIEOUSTELUT FÖRFÄGNINGAR INQUIRIES Henrik Lönnqvist, p. - tel. 09 310 36534 etunimi.sukunimi@hel.fi JULKAISIJA UTGIVARE PUBLISHER
anna minun kertoa let me tell you
 anna minun kertoa let me tell you anna minun kertoa I OSA 1. Anna minun kertoa sinulle mitä oli. Tiedän että osaan. Kykenen siihen. Teen nyt niin. Minulla on oikeus. Sanani voivat olla puutteellisia mutta
A new model of regional development work in habilitation of children - Good habilitation in functional networks
 A new model of regional development work in habilitation of children - Good habilitation in functional networks Salla Sipari, PhD, Principal Lecturer Helena Launiainen, M.Ed, Manager Helsinki Metropolia
Ikärakennemuutos, tulot ja kulutus Reijo Vanne, Työeläkevakuuttajat TELA. Sisältö. Päälähteet
 Helsingin yliopisto Sosiaalitieteiden laitos Yhteiskuntapolitiikka Luentosarja: Suomi ikääntyy 2015 19.2.2015 Ikärakennemuutos, tulot ja kulutus Reijo Vanne, Työeläkevakuuttajat TELA Sisältö Käsitteitä:
Transport climate policy choices in the Helsinki Metropolitan Area 2025
 Transport climate policy choices in the Helsinki Metropolitan Area 2025 views of transport officials and politicians Vilja Varho Introduction Experts have doubts about whether sufficiently effective policies
EUROOPAN PARLAMENTTI
 EUROOPAN PARLAMENTTI 2004 2009 Kansalaisvapauksien sekä oikeus- ja sisäasioiden valiokunta 2008/0101(CNS) 2.9.2008 TARKISTUKSET 9-12 Mietintöluonnos Luca Romagnoli (PE409.790v01-00) ehdotuksesta neuvoston
Suomen 2011 osallistumiskriteerit
 KAH Suomen 2011 osallistumiskriteerit ARTEMIS Call 2011 -työpaja @ Helsinki 17.1.2011 Oiva Knuuttila KAH ARTEMIS Advanced Research and Technology for Embedded Intelligence and Systems Sulautettuja tietotekniikkajärjestelmiä
Master's Programme in Life Science Technologies (LifeTech) Prof. Juho Rousu Director of the Life Science Technologies programme 3.1.
 Prof. Juho Rousu Director of the Life Science Technologies programme 3.1.") Master's Programme in Life Science Technologies (LifeTech) Prof. Juho Rousu Director of the Life Science Technologies programme 3.1.2017 Life Science Technologies Where Life Sciences meet with Technology
Master's Programme in Life Science Technologies (LifeTech) Prof. Juho Rousu Director of the Life Science Technologies programme 3.1.2017 Life Science Technologies Where Life Sciences meet with Technology
DIGITAL MARKETING LANDSCAPE. Maatalous-metsätieteellinen tiedekunta
 DIGITAL MARKETING LANDSCAPE Mobile marketing, services and games MOBILE TECHNOLOGIES Handset technologies Network technologies Application technologies INTRODUCTION TO MOBILE TECHNOLOGIES COMPANY PERSPECTIVE
Capacity utilization
 Mat-2.4142 Seminar on optimization Capacity utilization 12.12.2007 Contents Summary of chapter 14 Related DEA-solver models Illustrative examples Measure of technical capacity utilization Price-based measure
Basic Flute Technique
 Herbert Lindholm Basic Flute Technique Peruskuviot huilulle op. 26 Helin & Sons, Helsinki Basic Flute Technique Foreword This book has the same goal as a teacher should have; to make himself unnecessary.
Choose Finland-Helsinki Valitse Finland-Helsinki
 Write down the Temporary Application ID. If you do not manage to complete the form you can continue where you stopped with this ID no. Muista Temporary Application ID. Jos et onnistu täyttää lomake loppuun
Bounds on non-surjective cellular automata
 Bounds on non-surjective cellular automata Jarkko Kari Pascal Vanier Thomas Zeume University of Turku LIF Marseille Universität Hannover 27 august 2009 J. Kari, P. Vanier, T. Zeume (UTU) Bounds on non-surjective
Academic Opening. Opening - Introduction. In this essay/paper/thesis I shall examine/investigate/evaluate/analyze General opening for an essay/thesis
 - Introduction In this essay/paper/thesis I shall examine/investigate/evaluate/analyze General opening for an essay/thesis Tässä esseessä / tutkielmassa / opinnäytetyössä tutkin / tarkastelen / arvioin/
Avoimet paikkatiedot ja tulevaisuuden tietolähteet liikkumisen tutkimuksessa. Tuuli Toivonen Helsingin yliopisto Accessibility Research Group
 Avoimet paikkatiedot ja tulevaisuuden tietolähteet liikkumisen tutkimuksessa Tuuli Toivonen Helsingin yliopisto Accessibility Research Group Tavoitettavuus ja liikkuminen arkipäivän peruskysymyksiä Terveelliset
Robert S. Broadhead, Ph.D., University of Connecticut Pavlo Smyrnov, Oleksandra Datsenko and Oksana Matiyash International HIV/AIDS Alliance in
 Robert S. Broadhead, Ph.D., University of Connecticut Pavlo Smyrnov, Oleksandra Datsenko and Oksana Matiyash International HIV/AIDS Alliance in Ukraine Robert S. Broadhead, Ph.D., University of Connecticut
ProAgria. Opportunities For Success
 ProAgria Opportunities For Success Association of ProAgria Centres and ProAgria Centres 11 regional Finnish ProAgria Centres offer their members Leadership-, planning-, monitoring-, development- and consulting
Equality of treatment Public Services
 Equality of treatment Public Services Providing high-quality Public Services in Europe based on the values of Protocol 26 (TFEU), Warsaw 12.10.2012 Kristian Siikavirta, Doctor of Law 18.10.2012 1 University
S Sähkön jakelu ja markkinat S Electricity Distribution and Markets
 S-18.3153 Sähkön jakelu ja markkinat S-18.3154 Electricity Distribution and Markets Voltage Sag 1) Kolmivaiheinen vastukseton oikosulku tapahtuu 20 kv lähdöllä etäisyydellä 1 km, 3 km, 5 km, 8 km, 10 km
The Viking Battle - Part Version: Finnish
 The Viking Battle - Part 1 015 Version: Finnish Tehtävä 1 Olkoon kokonaisluku, ja olkoon A n joukko A n = { n k k Z, 0 k < n}. Selvitä suurin kokonaisluku M n, jota ei voi kirjoittaa yhden tai useamman
FinFamily PostgreSQL installation ( ) FinFamily PostgreSQL
 FinFamily PostgreSQL") FinFamily PostgreSQL 1 Sisällys / Contents FinFamily PostgreSQL... 1 1. Asenna PostgreSQL tietokanta / Install PostgreSQL database... 3 1.1. PostgreSQL tietokannasta / About the PostgreSQL database...
FinFamily PostgreSQL 1 Sisällys / Contents FinFamily PostgreSQL... 1 1. Asenna PostgreSQL tietokanta / Install PostgreSQL database... 3 1.1. PostgreSQL tietokannasta / About the PostgreSQL database...
Augmented Reality (AR) in media applications
 in media applications") Augmented Reality (AR) in media applications Maiju Aikala, Tatu Harviainen, Pekka Siltanen & Caj Södergård VTT Technical Research Centre of Finland Research questions Is it possible to create more addictive
Augmented Reality (AR) in media applications Maiju Aikala, Tatu Harviainen, Pekka Siltanen & Caj Södergård VTT Technical Research Centre of Finland Research questions Is it possible to create more addictive
Siirtymä maisteriohjelmiin tekniikan korkeakoulujen välillä Transfer to MSc programmes between engineering schools
 Siirtymä maisteriohjelmiin tekniikan korkeakoulujen välillä Transfer to MSc programmes between engineering schools Akateemisten asioiden komitea Academic Affairs Committee 11 October 2016 Eija Zitting
ECVETin soveltuvuus suomalaisiin tutkinnon perusteisiin. Case:Yrittäjyyskurssi matkailualan opiskelijoille englantilaisen opettajan toteuttamana
 ECVETin soveltuvuus suomalaisiin tutkinnon perusteisiin Case:Yrittäjyyskurssi matkailualan opiskelijoille englantilaisen opettajan toteuttamana Taustaa KAO mukana FINECVET-hankeessa, jossa pilotoimme ECVETiä
NATURE-BASED TOURSIM, OUTDOOR RECREATION AND ADAPTAION TO CLIMATE CHANGE
 Adapting to climate change: current knowledge, future needs: Final Seminar NATURE-BASED TOURSIM, OUTDOOR RECREATION AND ADAPTAION TO CLIMATE CHANGE Tuija Sievänen, Kaarina Tervo, Marjo Neuvonen, Eija Pouta,
Strategiset kyvykkyydet kilpailukyvyn mahdollistajana Autokaupassa Paula Kilpinen, KTT, Tutkija, Aalto Biz Head of Solutions and Impact, Aalto EE
 Strategiset kyvykkyydet kilpailukyvyn mahdollistajana Autokaupassa Paula Kilpinen, KTT, Tutkija, Aalto Biz Head of Solutions and Impact, Aalto EE November 7, 2014 Paula Kilpinen 1 7.11.2014 Aalto University
Supplies
 Supplies - 239150-2018 05/06/2018 S105 - - Supplies - Contract notice - Open procedure I. II. III. IV. VI. Finland-Oulu: Medical equipments 2018/S 105-239150 Contract notice Supplies Directive 2014/24/EU
Uusi Ajatus Löytyy Luonnosta 3 (Finnish Edition)
") Uusi Ajatus Löytyy Luonnosta 3 (Finnish Edition) Esko Jalkanen Click here if your download doesn"t start automatically Uusi Ajatus Löytyy Luonnosta 3 (Finnish Edition) Esko Jalkanen Uusi Ajatus Löytyy
Uusi Ajatus Löytyy Luonnosta 3 (Finnish Edition) Esko Jalkanen Click here if your download doesn"t start automatically Uusi Ajatus Löytyy Luonnosta 3 (Finnish Edition) Esko Jalkanen Uusi Ajatus Löytyy
BLOCKCHAINS AND ODR: SMART CONTRACTS AS AN ALTERNATIVE TO ENFORCEMENT
 UNCITRAL EMERGENCE CONFERENCE 13.12.2016 Session I: Emerging Legal Issues in the Commercial Exploitation of Deep Seabed, Space and AI BLOCKCHAINS AND ODR: SMART CONTRACTS AS AN ALTERNATIVE TO ENFORCEMENT
Paikkatiedon semanttinen mallinnus, integrointi ja julkaiseminen Case Suomalainen ajallinen paikkaontologia SAPO
 Paikkatiedon semanttinen mallinnus, integrointi ja julkaiseminen Case Suomalainen ajallinen paikkaontologia SAPO Tomi Kauppinen, Eero Hyvönen, Jari Väätäinen Semantic Computing Research Group (SeCo) http://www.seco.tkk.fi/
WAMS 2010,Ylivieska Monitoring service of energy efficiency in housing. 13.10.2010 Jan Nyman, jan.nyman@posintra.fi
 WAMS 2010,Ylivieska Monitoring service of energy efficiency in housing 13.10.2010 Jan Nyman, jan.nyman@posintra.fi Background info STOK: development center for technology related to building automation
Use of Stochastic Compromise Programming to develop forest management alternatives for ecosystem services
 Use of Stochastic Compromise Programming to develop forest management alternatives for ecosystem services Kyle Eyvindson 24.3.2014 Forest Science Department / Kyle Eyvindson 3/26/2014 1 Overview Introduction
Hankkeiden vaikuttavuus: Työkaluja hankesuunnittelun tueksi
 Ideasta projektiksi - kumppanuushankkeen suunnittelun lähtökohdat Hankkeiden vaikuttavuus: Työkaluja hankesuunnittelun tueksi Erasmus+ -ohjelman hakuneuvonta ammatillisen koulutuksen kumppanuushanketta
OUTDOOR RECREATION PARTICIPATION AMONG RURAL AND URBAN FINNS
 OUTDOOR RECREATION PARTICIPATION AMONG OUTDOOR RECREATION PARTICIPATION AMONG RURAL AND URBAN FINNS RURAL AND URBAN FINNS Katri Korhonen, Marjo Neuvonen and Tuija Sievänen Katri Korhonen, Marjo Neuvonen
Tork Paperipyyhe. etu. tuotteen ominaisuudet. kuvaus. Väri: Valkoinen Malli: Vetopyyhe
 etu Monikäyttöpaperi hoitaa useimmat pyyhintätehtävät Sopiva lasipintojen pyyhintään Sopii käsien kuivaamiseen Elintarvikekäyttöön hyväksytty Tork Easy Handling, pakkaus, jota on helppo kantaa mukana,