Map overlay as modeling of spatial phenomena. Kirsi Virrantaus GIS-E1060 Spatial Analytics
|
|
|
- Julia Nieminen
- 8 vuotta sitten
- Katselukertoja:
Transkriptio
1 Map overlay as modeling of spatial phenomena Kirsi Virrantaus GIS-E1060 Spatial Analytics
2 Map overlay spatiaalisten ilmiöiden mallina Kirsi Virrantaus GIS-E1060 Spatial Analytics
3 Topics Map overlay. Book Ch 10 Case study: Cross country analysis.
4 Aiheet Map overlay. Kirjan luku 10 Case: Maaston kulkukelpoisuusanalyysi.
5 1. What is Map Overlay? first formalized by McHarg (1969) the idea is older: historical background map transparencies on the top of each others, analysis on the basis of several map layers overlay procedure creates a new map data layer as a function of two or more source data layers compare with multicriteria decision making problem (Malczewski, 1999) can be performed to any geometrical data type, see Table 10.1
6 1.Mitä on Map Overlay? (päällekkäisanalyysi) ensimmäinen eksakti määrittely jo 1969 (McHarg) perusidea ikivanha: historiallinen tausta skissipaperille piirretään kartalta merkittäviä asioita, toinen skissipaperi toisen päälle, analysoidaan aluetta useiden karttojen perusteella päällekkäisanalyysi tuottaa uuden karttatason useiden lähtökarttatasojen perusteella vrt. monikriteerisen päätöksentekoon (Malczewski, 1999) voidaan toteuttaa kaikille geometrisille datatyypeille, ks. taulukko 10.1
7 More discussion on Map Overlay sieve mapping the term used by the authors of the textbook basic form based on binary logic, Boolean logic suitability to some use is analysed by logical reasoning in which several data layers give (binary) values to each locations and the reasoning is based on the logics based on these values the logic of the analysis (criteria) often collected by the experts (knowledge driven) could also be data driven (any data available could be analysed in order to find the criteria)!!!! typically implemented as raster operation, possible (but more complicated) to compute also for vector data objects slivers (remember the intersection algorithms presented in Introduction course!)
8 Lisää yleistä map overlaysta kirjan kirjoittajat käyttävät termiä sieve mapping (sieve = siivilä) perusmuoto perustuu binäärilogiikkaan, Boolen logiikka onko vai eikö ole jotain? analysoidaan esim. alueen soveltuvuutta johonkin käyttöön, alue saa ominaisuuksia karttatasoilta, jotka antavat (binäärisen) arvon jokaiselle lokaatiolle; tulos perustuu logiikkaan näiden perusteella overlayn sisältö perustuu usein asiantuntijoiden kokemukseen ja kriteereihin (tietämyspohjainen), voisi myös perustua dataanalyysiin (datapohjainen) jolloin kriteerit tuotettaisiin analysoimalla kaikkea saatavilla olevaa dataa!!!! tyypillisesti rasterioperaatio, mahdollista (mutta monimutkaisempaa) laskea vektoriaineistolle slivers = merkityksettömän pienet leikkausalueet
9 Problems with map overlay input data are often in different coordinate systems are originally often in different scales (scanned) maps have often been generalized and objects may take more space than in reality (roads) data has often been interpolated (DEMs) if the uncertainty of the data sets is not known then the results are of no value if serious decisions are made on the basis of results the knowledge about the reliability is vital
10 Map overlayn ongelmia lähtödata on usein eri koordinaattijärjestelmissä eri mittakaavoissa yleistettyä dataa (skannatut kartat), tietyt kohteet on kuvattu spatiaalisesti suurempina kuin ne todellisuudessa ovat (esim. tiet) interpoloitua dataa (esim. korkeusmalli) jos lähtödatan epävarmuutta ei tunneta ei tuloksilla ole juuri arvoa erityisesti, jos tulosten perusteella tehdään vakavia päätöksiä
11 Weaknesses in Simple Boolean Overlay it is assumed that relationships are Boolean the two-valued (Y/N) logic in sieve mapping creates spatial discontinuities that do not reflect the natural situation Example: if 30 degrees is used as a threshold, then 29 degrees slope is not risky for landslide but 31 degrees slope is it is assumed that any interval or ratio scale attributes are known without significant measurement error any categorical attribute data are known exactly without uncertainty the boundaries of discrete objects are certain/crisp
12 Boolen logiikan heikkouksia oletetaan että kaikki on binääristä kaksiarvoinen (K/E) logiikka luo epäluonnollisia epäjatkuvuuskohtia esimerkiksi kun käytetään 30 astetta kynnysarvona, jonka alapuolella esim. 29 astetta maalaji ei ole altis vyörymälle, mutta yläpuolella, esim. 31 astetta on oletetaan, että kaikki välimatka- ja suhdeasteikolla mitatut ominaisuudet ovat virheettömiä kaikki luokkamuuttujien arvot tunnetaan oikein, ilman epävarmuutta kaikkien kohteiden rajat ovat täsmällisiä
13 It should be remembered that: using map overlay = modeling map overlay must always be well designed which are the relevant data for the problem? how the various data layers are weighted? how the various operations work on data? how the decision rules are defined? the entire decision must be well modeled and understood clear understanding instead of fancy computations (Clemen)
14 On muistettava, että map overlayn käyttö = mallintamista päällekkäisanalyysi on suunniteltava hyvin mikä on ongelman kannalta relevantti data? kuinka eri datatyypit (tasot) painotetaan? miten eri operaatiot vaikuttavat? kuinka päätössäännöt määritetään? koko päätöksenteko tulee mallintaa ja ymmärtää clear understanding instead of fancy computations (Clemen)
15 Map Algebra (Tomlin, 1990) map algebra is quite simple tool as such map algebra gives a tool for implementing for example map overlays different map overlay functions in Local operations for example LocalProduct LocalDifference LocalSum
16 Kartta-algebra (Tomlin, 1990) kartta-algebra on sellaisenaan varsin yksinkertainen työkalu, joka mahdollistaa map overlayn toteutuksen eri overlay -mahdollisuuksia Local operaatioilla esimerkkejä LocalProduct LocalDifference LocalSum
17 Map overlay definitions given by Malczewski (1999) overlay operation can be based on arithmetic, algebraic, logical, stochastic, or fuzzy operations addition, subtraction, multiplication, division average, power, order, minimum, mazimum intersection, logical AND; union, logical OR; complement, logical NOT probabilistic and fuzzy definitions for intersection, union and complement
18 Malczewskin määrittelemä map overlay (1999) päällekkäisanalyysi voi perustua aritmeettisiin, algebrallisiin, loogisiin, stokastisiin tai sumeisiin operaatioihin yhteenlasku, vähennys, kerto, jako keskiarvo, potenssi, järjestys, minimi, maksimi leikkaus, looginen AND; unioni, loginen OR, komplementti, looginen NOT todennäköisyyteen ja sumeuteen perustuvat leikkauksen, unionin, komplementin määritelmät
19 Towards a generic model O Sullivan and Unwin propose a general model for map overlay based on the concept of : favorability function map overlay evaluates the favorability of the subareas for some activity can be evaluated by using a simple mathematical function at every location explained in the text book on pages
20 Yleinen map overlay:n malli O Sullivan ja Unwin esittävät yleisen, ns. edullisuus/suotuisuusfunktioon perustuvan mallin Boole-tyyppinen overlay arvioi alueen osa-alueiden soveltuvuutta/suotuisuutta tiettyyn tarkoitukseen voidaan kuvata yksinkertaisella matemaattisella funktiolla, jokaisessa lokaatiossa kuvattu kirjassa ss
21 Simple form: Favorability function can be written m F(s) = X M (s) M=1 -F(s) = favorability, for example cross country mobility, get values 0 or 1 in every location; s refers to location -m source data layers, all have equal importance -X(s) is the source data value in pixel s, value 0 or 1 -pi indicates the multiplication; thus the result is also binary -compare with Map Algebra Local Product
22 Yksinkertainen muoto: Edullisuusfunktio voidaan kirjoittaa yksinkertaiseen muotoon F(s) = X M (s) M=1 -F(s) = edullisuus/suotuisuus, esim. kulkukelpoisuus -arvioidaan binääriarvoilla 0 tai 1 jokaisessa lokaatiossa -m kappaletta lähtötietokarttatasoja X, kaikki samanarvoisia -X(s) lähtötiedon arvo pikselissä s, saa arvon 0 tai 1 -pii tarkoittaa kertolaskua -analyysin tulos on siis 1 tai 0 -vrt. kartta-algebran Local product
23 Improvements to the basic model -the favourability function can get value in more graduated scale than binary, for example ordinal (low-medium-high) or even ratio -criteria can be coded on the scales mentioned -criteria can be weighted according to the relative importance -criteria can be weighted according to the knowledge of experts, values -instead of multiplication some other function, for example adding the scores -Boolean overlay is a special case of the general function F= f(w 1 X 1,,,w m X m )
24 Perusmallin parannuksia -tekijät voidaan ilmaista järjestysasteikolla (matala, keskitaso,korkea) tai suhdeasteikolla; jatkuva asteikko 0 1 -antamalla kriteereihin perustuvia sääntöjä -kriteereitä voidaan painottaa -kriteereihin voidaan liittää tietämyspohjaista painotusta, asiantuntijoiden arvoja -kertolaskun sijaan voidaan myös laskea yhteen -Boolen overlay on erikoistapaus yleisestä mallista F= f(w 1 X 1,,,w m X m )
25 Indexed overlay Malczewski calls this as weighted linear combination/simple additive weighting the use of single metric in ordinal scale like in the cross-country mobility 1 7 each layer can be weighted according to their importance summing up, normalization; the result get also values 1 M multiplication has been changed to to adding maybe the most typical way of using map overlay in practice
26 Indeksoitu overlay Malczewski kutsuu tätä painotetuksi lineaariseksi kombinaatioksi/yksinkertaiseksi lisääväksi painotukseksi käytetään kaikilla tasoilla samaa järjestysasteikkoa 0 M kuten kulkukelpoisuusanalyysissä 1 7 voidaan painottaa jokaista tasoa niiden keskinäisen merkityksen suhteessa summataan yhteen, normalisoidaan, tulos myös asteikolla 1 M kertolasku on vaihdettu yhteenlaskuun ehkä yleisin tapa käyttää map overay-analyysiä käytännössä
27 Modeling dependent variables in map overlay, WOF WOF = the term weights of evidence The method is based on the use of conditional probability the conditional probability of A, when we know that B already occurred P(A:B) B either increases or decreases the probability of A compare to the joint probability of independent events, in which the probabilities of events do not effect on each others, they are independent, and we do not know any of them Two flips of coins are independent event P(H H) = P(H) x P(H) = 0.5 x 0.5 = 0.25) Raining today and raining yesterday are not totally independent
28 Toisistaan riippuvien asioiden mallinnus map overlayssä, WOF WOF = Weights of evidence menetelmä perustuu ehdollisen todennäköisyyden käyttöön A:n ehdollinen todennäköisyys, kun tiedetään, että B on jo tapahtunut P(A:B) B lisää tai vähentää A:n todennäköisyyttä vrt. toisistaan riippumattomien tapahtuminen yhdistetty todennäköisyys, jossa tapahtumien todennäköisyydet eivät vaikuta toisiinsa Kaksi kolikon heittoa ovat riippumattomia toisistaan P(H H) = P(H) x P(H) = 0.5 x 0.5 = 0.25) Sataako tänään ja satoiko eilen eivät ole täysin riippumattomia toisistaan
29 Example Example:Probability that is rains today when we know that it rained yesterday In most climates it is probable that is also rains tomorrow if it rains today (called also autocorrelation) (compare to the spatial autocorrelation) This is worth of keeping in ming when we study later the spatial autoregressive models
30 Esimerkki Esimerkki: Todennäköisyys, että sataa huomenna, kun tiedetään, että tänään satoi useimmissa ilmastoissa on todennäköisempää, että myös huomenna sataa (vrt. spatiaaliseen autokorrelaatioon, joka onkin omaksuttu aikasarjoista) tämä kannattaa pitää mielessä kun opiskellaan spatiaalista autoregressiivistä mallia; ehdollinen todennäköisyys spatiaalisessa datassa
31 Conditional probability, the formula when we know that the other event has occured it is denoted P(A:B); the probability of A given B -is not the same than P(A B), because we know that B already occurred and it either reduces or increases the change of A; gives evidence to the change of A P(A:B) = P(A) x (P(B:A)/P(B)) -last term = weight of evidence, 1 0, either increases or reduces the probability of A
32 Ehdollinen todennäköisyys kun tiedetään, että toinen tapahtuma on jo tapahtunut merkitään P(A:B); tarkoittaa A:n todennäköisyys, kun tiedetään, että B on jo tapahtunut -ei ole sama kuin P(A B), koska kun tiedetään, että B on jo tapahtunut, sillä on vaikutuksensa siihen mitä A on P(A:B) = P(A) x (P(B:A)/P(B)) -jälkimmäinen termi, 0 1, joko vahvistaa tai vähentää A:n tapahtumista, jos suhde on yli 1, B:n esiiintyminen vahvistaa, jos alle, se pienentää A:n todennäköisyyttä
33 The formula in the previous example P(A) is the probability of event A P(A B) = P(A:B) P(B) ; in case of independent events this is clear the same thing for the other event P(B) is the probability of B P(B A) = P(B:A) P(A) it must be that P(A B) = P(B A) we get the formula P(A:B) P(B) = P(B:A) P(A) and further P(A:B) = P(A) P(B:A) /P(B) term P(B:A) /P(B) is so called weights of evidence when > 1 then the occurrence of increases the probability of A When < 1 then it reduces it
34 Kaava Edellisessä oli esitetty P(A) on An todennäköisyys P(A B) = P(A:B) P(B) ; riippumattomien tapahtumien tapauksessa selvä Sama toisinpäin P(B) on Bn todennäköisyys P(B A) = P(B:A) P(A) näinollen on P(A B) = P(B A) saadaan kaava P(A:B) P(B) = P(B:A) P(A) Ja edelleen P(A:B) = P(A) P(B:A) /P(B) termi P(B:A) /P(B) on weight of evidence jos > 1 silloin tapahtuma B lisää tapahtuman A todennäköisyyttä jos < 1 silloin sen vähentää sitä
35 Weight of evidence probability based overlay Bayesian approach to map overlay the conditional probability of event A given that the other event B is known to be occurred the fact that B already occurred provides additional evidence to the probability of A applying Bayes to map overlay means that the weight of evidence is taken into account in the reasoning of the result
36 Todennäköisyyksiin perustuva overlay, WOE Bayesiläinen lähestymistapa map overlayn käyttöön ehdollinen todennäköisyys: A:n ehdollinen todennäköisyys, kun tiedetään että toinen tapahtuma B on tapahtunut tosiasia, että B on jo tapahtunut vaikuttaa A:n todennäköisyyteen Bayes map overlayssa tarkoittaa sitä, että otetaan weight of evidence huomioon tulosta laskettaessa
37 Landslide probabilities in map overlay in a sqkm region we have identified 100 landslides; we define as the baseline probability of a land slide event in a sqkm area P(landslide) = of slides occurred in areas with steeper slope than 30 degrees thus we ca say that the probability of that the landslide that happened is in a steep slope area (P(slope>30 :landslide)=0.75 we know that 1000 skm of the entire area is steeper than 30 degrees; the probability of being steep in the area is P(slope>30 degrees) = 0.1 the slope increases clearly the probability of having a land slide and can be used in the conditional probability calculation as the weight of evidence in map overlay we have landslide layer and slope layer and the probability of getting a landslide when there is a steep slope is calculated by the formula below P(landslide:slope>30) = P(landslide) P(slope>30 :landslide)/p(slope>30) =0.075 = 0.01(0.75/0.1), see page 308
38 Maanvyörymämahdollisuuden analyysi koko neliökm:n alueella on tapahtunut 100 vyörymää, tästä päätellään, että maanvyörymän todennäköisyys neliökilometrin alueella on 100/ = 0,01 P(landslide) = 0,01 tiedetään, että 75% (75 kpl) maanvyörymistä on tapahtunut 10% alueella (1000 neliökm), joten päätellään, että todennäköisyys, että tapahtunut maanvyörymä on jyrkän rinteen alueella on P(slope>30 :landslide) = 0.75 ja myös P(slope>30 )=0.1 nyt halutaan ennustaa maanvyörymän todennäköisyys kun alueesta tiedetään, että sen kaltevuus on yli 30 astetta; sovelletaan ehdollista todennäköisyyttä ja map overlayta jaetaan alue pikseleihin ja otetaan kaltevuus jo tapahtuneeksi tekijäksi, jolloin se vahvistaa tietyillä alueilla maanvyörymätodennäköisyyttä Sovelletaan weights of evidence kaavaa P(landslide:slope>30) = P(landslide) P(slope>3:landslide)/P(slope>30) =0.075 = 0.01(0.75/0.1), kirjassa sivulla 308
39 Use of regression analysis if there is available input and output data the model can calibrated by using regression model the weighted linear combination model, added intercept constant and error term problems are caused by categorical variables, however also the model can be formulated to fit them spatial autocorrelation: spatial autoregression and geographically weighted regression
40 Regressioanalyysin käyttö jos on käytössä aineistoa sekä input että output datasta, voidaan regressiomalli kalibroida PNS-menetelmää käyttäen lähtökohtana painotettu lineaarinen malli, lisättynä vakiolla ja virhetermillä ongelmana luokkamuuttujadata, joskin voidaan kehittää myös siihen sopivia menetelmiä spatiaalisen autokorrelaation huomioiminen: spatiaalinen autoregressio ja maantieteellisesti painotettu regressio
41 Case: Terrain mobility analysis Maaston kulkukelpoisuusanalyysi Kirsi Virrantaus GIS-E1060 Spatial Analytics
42 1. The problem: Reliability of the Cross-country mobility Cross-country analysis model developed at the Finnish Defence Forces/Engineering School Problem of the analysis: How difficult it is to advance in the terrain? Result of the analysis: A map showing 7 classes of mobility by 7 colours (1=no-go 7=go; blue=water/built area; not in the analysis)
43 Solution: map overlay Cross country mobility analysis based on : soil type (quarternary deposit map) elevation model amount of vegetation thickness of snow depth of frost Model is map overlay type All layers are of grid structure, equal pixel size, equal orientation Model type is indexed overlay layers get weights
44 20Q2D4
45 2. Our research goals 1) to analyse the reliability of the previous result map: how uncertain the result map is in a specified pixel location? what is the effect of the uncertainties of different source data types to the uncertainty of results in a specified pixel location? 2) to present the results in a way which can be used and interpreted by the users in the decision making - together with topographic maps
46 3. Soil map uncertainty in this presentation the uncertainty model of soil map is dealt with, because soil class is the primary variable in the analysis other data sets: snow, frost, vegetation, slope soil map is an interesting data set it is categorical and imprecise data it is manually produced and no metadata (no quality data) is available on the soil maps quality information must be collected afterwards In this case information on quality was collected from geologists knowledge based information The data was modified into a misclassification matrix (väärinluokittelumatriisi)
47
48
49 4. Monte Carlo simulation Monte Carlo simulation was applied for data all source data sets were simulated by using the uncertainty information available analysis was computed by simulated data in evaluation of the results the simulated realizations (the mean) were used as real data the original data was the estimate the uncertainty of the estimate was evaluated in our earlier research we had no model of spatial dependency
50
51 20Q2D4 21N4A
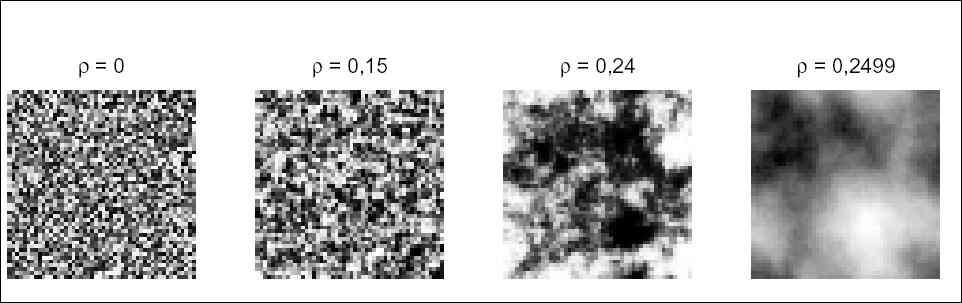
52 5. Spatial autoregressive process (according to Goodchild et al., -92) in order to add spatial dependency the 4-neighbourhood is taken into account by giving equal weight for all 4 neighbours spatially dependent random field for the error in selecting the soil type is created by solving X in X=ρWX + ε ; based on spatial correlation parameter ρ and probabilities from the misclassification matrix; W is the adjacency matrix of pixels of equal soil type; ε represents normally distributed error 21 different values were used for the parameter ρ, the spatial dependency level, 100 simulations in simulations X vector was used together with the misclassification matrix to get the simulated soil values
53
54
55
56 6. Evaluation methods misclassification matrices only give the uncertainties for each soil class, so by using the matrix and PCC values we can only compare two test areas but not evaluate the uncertainty in each pixel both in case of source data and results analysis by a simple regression model was made but the crosscountry mobility model seemed to be too complicated to be analysed statistically
57 7. Visualization of the evaluation results visual analysis seemed to be the most powerful and only - tool in analysing and interpreting the spatially dependent results for the users and especially by the users themselves in the following two examples that show the possibilities
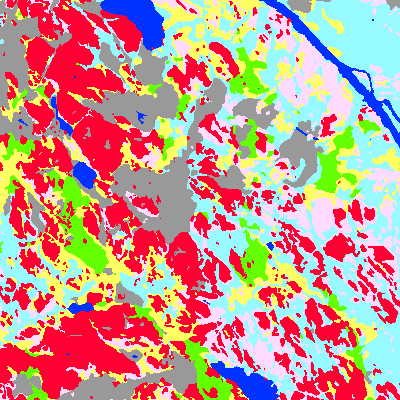
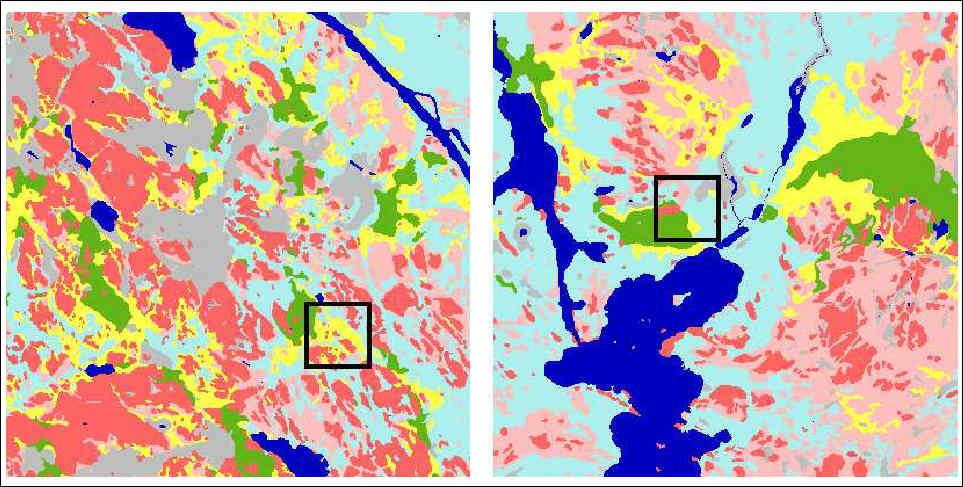
58 Example 1: Visual analysis of the uncertainty of soil types in area 1 the yellow silt and pink sandy heath have high uncertainty (in the MM they have low % for correctly classified) in the upper right corner of the area 2 there is a marsh polygon with very low uncertainty (in the MM marsh has 100% correct classification) the darker the value the higher the uncertainty the effect of increasing ρ can be seen the user can easily compare the source map and the uncertainty map layer associated to it

59 Uncertainty of classification of soil maps
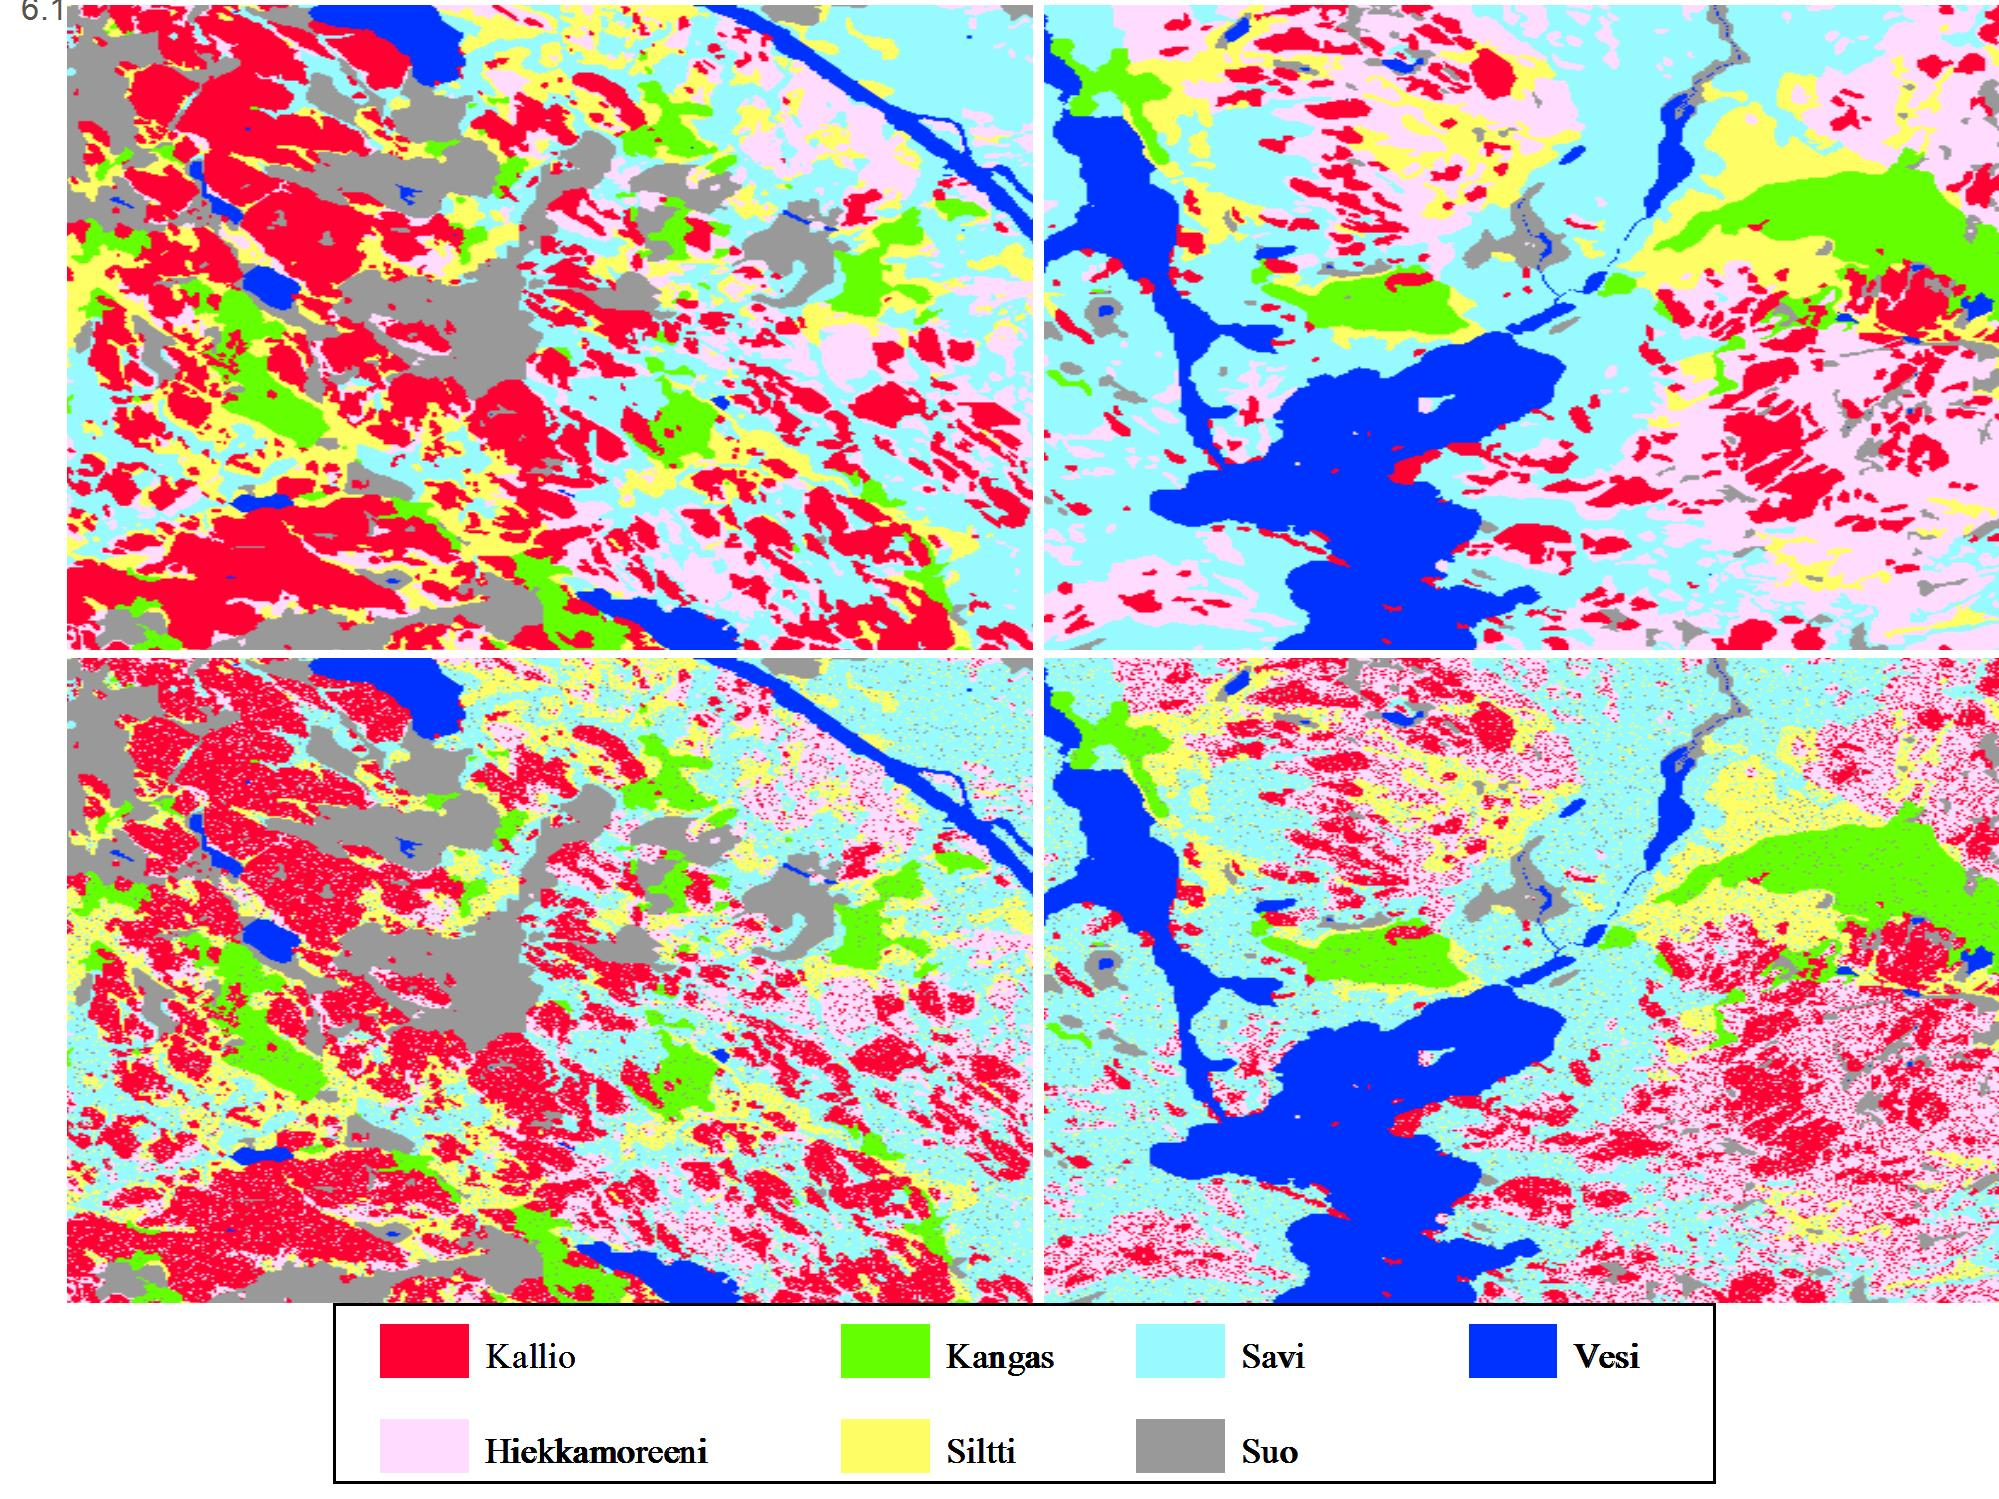
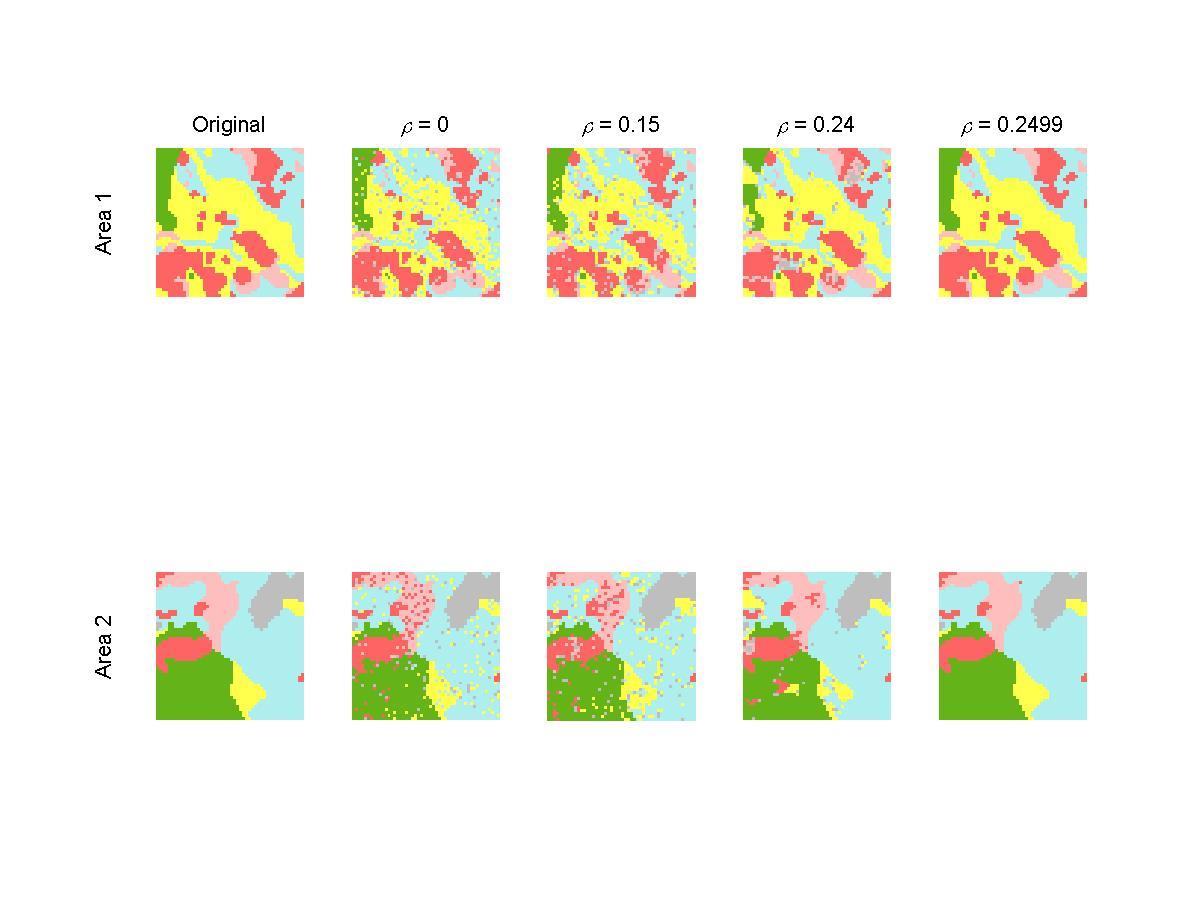
60 Example 2: Visual interpretation of the results on the left side the cross-country analysis result 4 lower rows give results in different seasons for test area 2 in the other columns the uncertainty of the cross-country analysis results is shown by using increasing spatial dependency value ρ the darker the value the higher the uncertainty the user can easily find the spatially changing uncertainty by comparing the maps
61 Uncertainty of the analysis results
62
63 8. Conclusions: Visualizations are perfect tools the visualisations of uncertainties of source data sets and the original result map can be compared in specific locations the visualizations of the uncertainty of the result map can be compared with the original result map in specific locations we can also generate maps, which show the risk of having wrong class in the results (for example class) in a specified pixel!
64 Conclusions: Spatial uncertainty model is needed visual analysis can not be made without a spatially dependent uncertainty model the quality of imprecise geographic data (like soil map in this case) can not be described by traditional quality measures each imprecise data set should be provided by a spatially dependent uncertainty layer which describes in a very user-friendly way some features of the quality (like spatial and thematic accuracy in our case)
65 9. Future: Developing the simple model the parameter ρ - different values for each soil type can maybe found and added to the model the membership vector of fuzzy soil model instead of probability vector from the misclassification matrix in simulation gives more local uncertainty information kriging together with fuzzy model in order to get better model for boundary areas
66 Literature O Sullivan&Unwin, Geographical information analysis, Chapter 10 Horttanainen,P., Virrantaus,K., Uncertainty evaluation by simulation and visualization, Geoinformatics 2004, Gävle,
Capacity Utilization
 Capacity Utilization Tim Schöneberg 28th November Agenda Introduction Fixed and variable input ressources Technical capacity utilization Price based capacity utilization measure Long run and short run
The CCR Model and Production Correspondence
 The CCR Model and Production Correspondence Tim Schöneberg The 19th of September Agenda Introduction Definitions Production Possiblity Set CCR Model and the Dual Problem Input excesses and output shortfalls
Efficiency change over time
 Efficiency change over time Heikki Tikanmäki Optimointiopin seminaari 14.11.2007 Contents Introduction (11.1) Window analysis (11.2) Example, application, analysis Malmquist index (11.3) Dealing with panel
Other approaches to restrict multipliers
 Other approaches to restrict multipliers Heikki Tikanmäki Optimointiopin seminaari 10.10.2007 Contents Short revision (6.2) Another Assurance Region Model (6.3) Cone-Ratio Method (6.4) An Application of
Gap-filling methods for CH 4 data
 Gap-filling methods for CH 4 data Sigrid Dengel University of Helsinki Outline - Ecosystems known for CH 4 emissions; - Why is gap-filling of CH 4 data not as easy and straight forward as CO 2 ; - Gap-filling
Results on the new polydrug use questions in the Finnish TDI data
 Results on the new polydrug use questions in the Finnish TDI data Multi-drug use, polydrug use and problematic polydrug use Martta Forsell, Finnish Focal Point 28/09/2015 Martta Forsell 1 28/09/2015 Esityksen
On instrument costs in decentralized macroeconomic decision making (Helsingin Kauppakorkeakoulun julkaisuja ; D-31)
") On instrument costs in decentralized macroeconomic decision making (Helsingin Kauppakorkeakoulun julkaisuja ; D-31) Juha Kahkonen Click here if your download doesn"t start automatically On instrument costs
On instrument costs in decentralized macroeconomic decision making (Helsingin Kauppakorkeakoulun julkaisuja ; D-31) Juha Kahkonen Click here if your download doesn"t start automatically On instrument costs
16. Allocation Models
 16. Allocation Models Juha Saloheimo 17.1.27 S steemianalsin Optimointiopin seminaari - Sks 27 Content Introduction Overall Efficienc with common prices and costs Cost Efficienc S steemianalsin Revenue
Information on preparing Presentation
 Information on preparing Presentation Seminar on big data management Lecturer: Spring 2017 20.1.2017 1 Agenda Hints and tips on giving a good presentation Watch two videos and discussion 22.1.2017 2 Goals
Uusi Ajatus Löytyy Luonnosta 4 (käsikirja) (Finnish Edition)
 (Finnish Edition)") Uusi Ajatus Löytyy Luonnosta 4 (käsikirja) (Finnish Edition) Esko Jalkanen Click here if your download doesn"t start automatically Uusi Ajatus Löytyy Luonnosta 4 (käsikirja) (Finnish Edition) Esko Jalkanen
Uusi Ajatus Löytyy Luonnosta 4 (käsikirja) (Finnish Edition) Esko Jalkanen Click here if your download doesn"t start automatically Uusi Ajatus Löytyy Luonnosta 4 (käsikirja) (Finnish Edition) Esko Jalkanen
On instrument costs in decentralized macroeconomic decision making (Helsingin Kauppakorkeakoulun julkaisuja ; D-31)
") On instrument costs in decentralized macroeconomic decision making (Helsingin Kauppakorkeakoulun julkaisuja ; D-31) Juha Kahkonen Click here if your download doesn"t start automatically On instrument costs
On instrument costs in decentralized macroeconomic decision making (Helsingin Kauppakorkeakoulun julkaisuja ; D-31) Juha Kahkonen Click here if your download doesn"t start automatically On instrument costs
Network to Get Work. Tehtäviä opiskelijoille Assignments for students. www.laurea.fi
 Network to Get Work Tehtäviä opiskelijoille Assignments for students www.laurea.fi Ohje henkilöstölle Instructions for Staff Seuraavassa on esitetty joukko tehtäviä, joista voit valita opiskelijaryhmällesi
Bounds on non-surjective cellular automata
 Bounds on non-surjective cellular automata Jarkko Kari Pascal Vanier Thomas Zeume University of Turku LIF Marseille Universität Hannover 27 august 2009 J. Kari, P. Vanier, T. Zeume (UTU) Bounds on non-surjective
Land-Use Model for the Helsinki Metropolitan Area
 Land-Use Model for the Helsinki Metropolitan Area Paavo Moilanen Introduction & Background Metropolitan Area Council asked 2005: What is good land use for the transport systems plan? At first a literature
812336A C++ -kielen perusteet, 21.8.2010
 812336A C++ -kielen perusteet, 21.8.2010 1. Vastaa lyhyesti seuraaviin kysymyksiin (1p kaikista): a) Mitä tarkoittaa funktion ylikuormittaminen (overloading)? b) Mitä tarkoittaa jäsenfunktion ylimääritys
Alternative DEA Models
 Mat-2.4142 Alternative DEA Models 19.9.2007 Table of Contents Banker-Charnes-Cooper Model Additive Model Example Data Home assignment BCC Model (Banker-Charnes-Cooper) production frontiers spanned by convex
T Statistical Natural Language Processing Answers 6 Collocations Version 1.0
 T-61.5020 Statistical Natural Language Processing Answers 6 Collocations Version 1.0 1. Let s start by calculating the results for pair valkoinen, talo manually: Frequency: Bigrams valkoinen, talo occurred
On instrument costs in decentralized macroeconomic decision making (Helsingin Kauppakorkeakoulun julkaisuja ; D-31)
") On instrument costs in decentralized macroeconomic decision making (Helsingin Kauppakorkeakoulun julkaisuja ; D-31) Juha Kahkonen Click here if your download doesn"t start automatically On instrument costs
On instrument costs in decentralized macroeconomic decision making (Helsingin Kauppakorkeakoulun julkaisuja ; D-31) Juha Kahkonen Click here if your download doesn"t start automatically On instrument costs
anna minun kertoa let me tell you
 anna minun kertoa let me tell you anna minun kertoa I OSA 1. Anna minun kertoa sinulle mitä oli. Tiedän että osaan. Kykenen siihen. Teen nyt niin. Minulla on oikeus. Sanani voivat olla puutteellisia mutta
C++11 seminaari, kevät Johannes Koskinen
 C++11 seminaari, kevät 2012 Johannes Koskinen Sisältö Mikä onkaan ongelma? Standardidraftin luku 29: Atomiset tyypit Muistimalli Rinnakkaisuus On multicore systems, when a thread writes a value to memory,
TM ETRS-TM35FIN-ETRS89 WTG
 SHADOW - Main Result Assumptions for shadow calculations Maximum distance for influence Calculate only when more than 20 % of sun is covered by the blade Please look in WTG table WindPRO version 2.8.579
Returns to Scale II. S ysteemianalyysin. Laboratorio. Esitelmä 8 Timo Salminen. Teknillinen korkeakoulu
 Returns to Scale II Contents Most Productive Scale Size Further Considerations Relaxation of the Convexity Condition Useful Reminder Theorem 5.5 A DMU found to be efficient with a CCR model will also be
KONEISTUSKOKOONPANON TEKEMINEN NX10-YMPÄRISTÖSSÄ
 KONEISTUSKOKOONPANON TEKEMINEN NX10-YMPÄRISTÖSSÄ https://community.plm.automation.siemens.com/t5/tech-tips- Knowledge-Base-NX/How-to-simulate-any-G-code-file-in-NX- CAM/ta-p/3340 Koneistusympäristön määrittely
TM ETRS-TM35FIN-ETRS89 WTG
 SHADOW - Main Result Assumptions for shadow calculations Maximum distance for influence Calculate only when more than 20 % of sun is covered by the blade Please look in WTG table WindPRO version 2.9.269
Use of spatial data in the new production environment and in a data warehouse
 Use of spatial data in the new production environment and in a data warehouse Nordic Forum for Geostatistics 2007 Session 3, GI infrastructure and use of spatial database Statistics Finland, Population
( ( OX2 Perkkiö. Rakennuskanta. Varjostus. 9 x N131 x HH145
 OX2 9 x N131 x HH145 Rakennuskanta Asuinrakennus Lomarakennus Liike- tai julkinen rakennus Teollinen rakennus Kirkko tai kirkollinen rak. Muu rakennus Allas Varjostus 1 h/a 8 h/a 20 h/a 0 0,5 1 1,5 2 km
Metsälamminkankaan tuulivoimapuiston osayleiskaava
 VAALAN KUNTA TUULISAIMAA OY Metsälamminkankaan tuulivoimapuiston osayleiskaava Liite 3. Varjostusmallinnus FCG SUUNNITTELU JA TEKNIIKKA OY 12.5.2015 P25370 SHADOW - Main Result Assumptions for shadow calculations
Characterization of clay using x-ray and neutron scattering at the University of Helsinki and ILL
 Characterization of clay using x-ray and neutron scattering at the University of Helsinki and ILL Ville Liljeström, Micha Matusewicz, Kari Pirkkalainen, Jussi-Petteri Suuronen and Ritva Serimaa 13.3.2012
1. Liikkuvat määreet
 1. Liikkuvat määreet Väitelauseen perussanajärjestys: SPOTPA (subj. + pred. + obj. + tapa + paikka + aika) Suora sanajärjestys = subjekti on ennen predikaattia tekijä tekeminen Alasääntö 1: Liikkuvat määreet
Tynnyrivaara, OX2 Tuulivoimahanke. ( Layout 9 x N131 x HH145. Rakennukset Asuinrakennus Lomarakennus 9 x N131 x HH145 Varjostus 1 h/a 8 h/a 20 h/a
 , Tuulivoimahanke Layout 9 x N131 x HH145 Rakennukset Asuinrakennus Lomarakennus 9 x N131 x HH145 Varjostus 1 h/a 8 h/a 20 h/a 0 0,5 1 1,5 km 2 SHADOW - Main Result Assumptions for shadow calculations
make and make and make ThinkMath 2017
 Adding quantities Lukumäärienup yhdistäminen. Laske yhteensä?. Countkuinka howmonta manypalloja ballson there are altogether. and ja make and make and ja make on and ja make ThinkMath 7 on ja on on Vaihdannaisuus
Analysis of polygon maps. Kirsi Virrantaus GIS-E1060 Spatial Analytics
 Analysis of polygon maps Kirsi Virrantaus GIS-E1060 Spatial Analytics 1.11.2016 Polygonikarttojen analyysi Kirsi Virrantaus GIS-E1060 Spatial Analytics 1.11.2016 Contents of the lecture Polygons and polygon
TM ETRS-TM35FIN-ETRS89 WTG
 SHADOW - Main Result Calculation: N117 x 9 x HH141 Assumptions for shadow calculations Maximum distance for influence Calculate only when more than 20 % of sun is covered by the blade Please look in WTG
TM ETRS-TM35FIN-ETRS89 WTG
 VE1 SHADOW - Main Result Calculation: 8 x Nordex N131 x HH145m Assumptions for shadow calculations Maximum distance for influence Calculate only when more than 20 % of sun is covered by the blade Please
TM ETRS-TM35FIN-ETRS89 WTG
 SHADOW - Main Result Assumptions for shadow calculations Maximum distance for influence Calculate only when more than 20 % of sun is covered by the blade Please look in WTG table WindPRO version 2.8.579
LYTH-CONS CONSISTENCY TRANSMITTER
 LYTH-CONS CONSISTENCY TRANSMITTER LYTH-INSTRUMENT OY has generate new consistency transmitter with blade-system to meet high technical requirements in Pulp&Paper industries. Insurmountable advantages are
Toimintamallit happamuuden ennakoimiseksi ja riskien hallitsemiseksi turvetuotantoalueilla (Sulfa II)
") Toimintamallit happamuuden ennakoimiseksi ja riskien hallitsemiseksi turvetuotantoalueilla (Sulfa II) Happamuuskuormituksen ennustaminen valuma-aluetasolla Marie Korppoo ja Markus Huttunen 13.5.2019 Päämäärä
Toimintamallit happamuuden ennakoimiseksi ja riskien hallitsemiseksi turvetuotantoalueilla (Sulfa II) Happamuuskuormituksen ennustaminen valuma-aluetasolla Marie Korppoo ja Markus Huttunen 13.5.2019 Päämäärä
Paikkatiedon semanttinen mallinnus, integrointi ja julkaiseminen Case Suomalainen ajallinen paikkaontologia SAPO
 Paikkatiedon semanttinen mallinnus, integrointi ja julkaiseminen Case Suomalainen ajallinen paikkaontologia SAPO Tomi Kauppinen, Eero Hyvönen, Jari Väätäinen Semantic Computing Research Group (SeCo) http://www.seco.tkk.fi/
TM ETRS-TM35FIN-ETRS89 WTG
 SHADOW - Main Result Assumptions for shadow calculations Maximum distance for influence Calculate only when more than 20 % of sun is covered by the blade Please look in WTG table WindPRO version 2.8.579
Map Algebra. Kirsi Virrantaus GIS-E1060 Spatial Analytics
 Map Algebra Kirsi Virrantaus GIS-E1060 Spatial Analytics 15.11.2016 Kartta-algebra Kirsi Virrantaus GIS-E1060 Spatial Analytics 15.11.2016 Lecture contents Introduction to Map Algebra Luennon sisältö Introduction
Infrastruktuurin asemoituminen kansalliseen ja kansainväliseen kenttään Outi Ala-Honkola Tiedeasiantuntija
 Infrastruktuurin asemoituminen kansalliseen ja kansainväliseen kenttään Outi Ala-Honkola Tiedeasiantuntija 1 Asemoitumisen kuvaus Hakemukset parantuneet viime vuodesta, mutta paneeli toivoi edelleen asemoitumisen
WindPRO version joulu 2012 Printed/Page :42 / 1. SHADOW - Main Result
 SHADOW - Main Result Assumptions for shadow calculations Maximum distance for influence Calculate only when more than 20 % of sun is covered by the blade Please look in WTG table 13.6.2013 19:42 / 1 Minimum
WindPRO version joulu 2012 Printed/Page :47 / 1. SHADOW - Main Result
 SHADOW - Main Result Assumptions for shadow calculations Maximum distance for influence Calculate only when more than 20 % of sun is covered by the blade Please look in WTG table WindPRO version 2.8.579
AYYE 9/ HOUSING POLICY
 AYYE 9/12 2.10.2012 HOUSING POLICY Mission for AYY Housing? What do we want to achieve by renting apartments? 1) How many apartments do we need? 2) What kind of apartments do we need? 3) To whom do we
BLOCKCHAINS AND ODR: SMART CONTRACTS AS AN ALTERNATIVE TO ENFORCEMENT
 UNCITRAL EMERGENCE CONFERENCE 13.12.2016 Session I: Emerging Legal Issues in the Commercial Exploitation of Deep Seabed, Space and AI BLOCKCHAINS AND ODR: SMART CONTRACTS AS AN ALTERNATIVE TO ENFORCEMENT
,0 Yes ,0 120, ,8
 SHADOW - Main Result Calculation: Alue 2 ( x 9 x HH120) TuuliSaimaa kaavaluonnos Assumptions for shadow calculations Maximum distance for influence Calculate only when more than 20 % of sun is covered
TM ETRS-TM35FIN-ETRS89 WTG
 SHADOW - Main Result Assumptions for shadow calculations Maximum distance for influence Calculate only when more than 20 % of sun is covered by the blade Please look in WTG table 5.11.2013 16:44 / 1 Minimum
Guidebook for Multicultural TUT Users
 1 Guidebook for Multicultural TUT Users WORKPLACE PIRKANMAA-hankkeen KESKUSTELUTILAISUUS 16.12.2010 Hyvää käytäntöä kehittämässä - vuorovaikutusopas kansainvälisille opiskelijoille TTY Teknis-taloudellinen
1.3Lohkorakenne muodostetaan käyttämällä a) puolipistettä b) aaltosulkeita c) BEGIN ja END lausekkeita d) sisennystä
 puolipistettä b) aaltosulkeita c) BEGIN ja END lausekkeita d) sisennystä") OULUN YLIOPISTO Tietojenkäsittelytieteiden laitos Johdatus ohjelmointiin 81122P (4 ov.) 30.5.2005 Ohjelmointikieli on Java. Tentissä saa olla materiaali mukana. Tenttitulokset julkaistaan aikaisintaan
OULUN YLIOPISTO Tietojenkäsittelytieteiden laitos Johdatus ohjelmointiin 81122P (4 ov.) 30.5.2005 Ohjelmointikieli on Java. Tentissä saa olla materiaali mukana. Tenttitulokset julkaistaan aikaisintaan
Tietorakenteet ja algoritmit
 Tietorakenteet ja algoritmit Taulukon edut Taulukon haitat Taulukon haittojen välttäminen Dynaamisesti linkattu lista Linkatun listan solmun määrittelytavat Lineaarisen listan toteutus dynaamisesti linkattuna
( ,5 1 1,5 2 km
 Tuulivoimala Rakennukset Asuinrakennus Liikerak. tai Julkinen rak. Lomarakennus Teollinen rakennus Kirkollinen rakennus Varjostus "real case" h/a 1 h/a 8 h/a 20 h/a 4 5 3 1 2 6 7 8 9 10 0 0,5 1 1,5 2 km
TM ETRS-TM35FIN-ETRS89 WTG
 SHADOW - Main Result Assumptions for shadow calculations Maximum distance for influence Calculate only when more than 20 % of sun is covered by the blade Please look in WTG table WindPRO version 2.8.579
The Viking Battle - Part Version: Finnish
 The Viking Battle - Part 1 015 Version: Finnish Tehtävä 1 Olkoon kokonaisluku, ja olkoon A n joukko A n = { n k k Z, 0 k < n}. Selvitä suurin kokonaisluku M n, jota ei voi kirjoittaa yhden tai useamman
TM ETRS-TM35FIN-ETRS89 WTG
 SHADOW - Main Result Assumptions for shadow calculations Maximum distance for influence Calculate only when more than 20 % of sun is covered by the blade Please look in WTG table 22.12.2014 11:33 / 1 Minimum
Statistical design. Tuomas Selander
 Statistical design Tuomas Selander 28.8.2014 Introduction Biostatistician Work area KYS-erva KYS, Jyväskylä, Joensuu, Mikkeli, Savonlinna Work tasks Statistical methods, selection and quiding Data analysis
Research plan for masters thesis in forest sciences. The PELLETime 2009 Symposium Mervi Juntunen
 Modelling tree and stand characteristics and estimating biomass removals and harvesting costs of lodgepole pine (Pinus contorta) plantations in Iceland Research plan for masters thesis in forest sciences
Co-Design Yhteissuunnittelu
 Co-Design Yhteissuunnittelu Tuuli Mattelmäki DA, associate professor Aalto University School of Arts, Design and Architecture School of Arts, Design and Architecture design with and for people Codesign
The role of 3dr sector in rural -community based- tourism - potentials, challenges
 The role of 3dr sector in rural -community based- tourism - potentials, challenges Lappeenranta, 5th September 2014 Contents of the presentation 1. SEPRA what is it and why does it exist? 2. Experiences
Miksi Suomi on Suomi (Finnish Edition)
") Miksi Suomi on Suomi (Finnish Edition) Tommi Uschanov Click here if your download doesn"t start automatically Miksi Suomi on Suomi (Finnish Edition) Tommi Uschanov Miksi Suomi on Suomi (Finnish Edition)
Miksi Suomi on Suomi (Finnish Edition) Tommi Uschanov Click here if your download doesn"t start automatically Miksi Suomi on Suomi (Finnish Edition) Tommi Uschanov Miksi Suomi on Suomi (Finnish Edition)
TM ETRS-TM35FIN-ETRS89 WTG
 SHADOW - Main Result Assumptions for shadow calculations Maximum distance for influence Calculate only when more than 20 % of sun is covered by the blade Please look in WTG table WindPRO version 2.8.579
7.4 Variability management
 7.4 Variability management time... space software product-line should support variability in space (different products) support variability in time (maintenance, evolution) 1 Product variation Product
TM ETRS-TM35FIN-ETRS89 WTG
 SHADOW - Main Result Assumptions for shadow calculations Maximum distance for influence Calculate only when more than 20 % of sun is covered by the blade Please look in WTG table WindPRO version 2.8.579
Constructive Alignment in Specialisation Studies in Industrial Pharmacy in Finland
 Constructive Alignment in Specialisation Studies in Industrial Pharmacy in Finland Anne Mari Juppo, Nina Katajavuori University of Helsinki Faculty of Pharmacy 23.7.2012 1 Background Pedagogic research
National Building Code of Finland, Part D1, Building Water Supply and Sewerage Systems, Regulations and guidelines 2007
 National Building Code of Finland, Part D1, Building Water Supply and Sewerage Systems, Regulations and guidelines 2007 Chapter 2.4 Jukka Räisä 1 WATER PIPES PLACEMENT 2.4.1 Regulation Water pipe and its
TIEKE Verkottaja Service Tools for electronic data interchange utilizers. Heikki Laaksamo
 TIEKE Verkottaja Service Tools for electronic data interchange utilizers Heikki Laaksamo TIEKE Finnish Information Society Development Centre (TIEKE Tietoyhteiskunnan kehittämiskeskus ry) TIEKE is a neutral,
Fighting diffuse nutrient load: Multifunctional water management concept in natural reed beds
 PhD Anne Hemmi 14.2.2013 RRR 2013 Conference in Greifswald, Germany Fighting diffuse nutrient load: Multifunctional water management concept in natural reed beds Eutrophication in surface waters High nutrient
Group 2 - Dentego PTH Korvake. Peer Testing Report
 Group 2 - Dentego PTH Korvake Peer Testing Report Revisions Version Date Author Description 1.0 Henrik Klinkmann First version Table of Contents Contents Revisions... 2 Table of Contents... 2 Testing...
How to handle uncertainty in future projections?
 How to handle uncertainty in future projections? Samu Mäntyniemi, Fisheries and Environmental Management group (FEM), University of Helsinki http://www.helsinki.fi/science/fem/ Biotieteellinen tiedekunta
1. SIT. The handler and dog stop with the dog sitting at heel. When the dog is sitting, the handler cues the dog to heel forward.
 START START SIT 1. SIT. The handler and dog stop with the dog sitting at heel. When the dog is sitting, the handler cues the dog to heel forward. This is a static exercise. SIT STAND 2. SIT STAND. The
MUSEOT KULTTUURIPALVELUINA
 Elina Arola MUSEOT KULTTUURIPALVELUINA Tutkimuskohteena Mikkelin museot Opinnäytetyö Kulttuuripalvelujen koulutusohjelma Marraskuu 2005 KUVAILULEHTI Opinnäytetyön päivämäärä 25.11.2005 Tekijä(t) Elina
3 9-VUOTIAIDEN LASTEN SUORIUTUMINEN BOSTONIN NIMENTÄTESTISTÄ
 Puhe ja kieli, 27:4, 141 147 (2007) 3 9-VUOTIAIDEN LASTEN SUORIUTUMINEN BOSTONIN NIMENTÄTESTISTÄ Soile Loukusa, Oulun yliopisto, suomen kielen, informaatiotutkimuksen ja logopedian laitos & University
SIMULINK S-funktiot. SIMULINK S-funktiot
 S-funktio on ohjelmointikielellä (Matlab, C, Fortran) laadittu oma algoritmi tai dynaamisen järjestelmän kuvaus, jota voidaan käyttää Simulink-malleissa kuin mitä tahansa valmista lohkoa. S-funktion rakenne
RANTALA SARI: Sairaanhoitajan eettisten ohjeiden tunnettavuus ja niiden käyttö hoitotyön tukena sisätautien vuodeosastolla
 TURUN YLIOPISTO Hoitotieteen laitos RANTALA SARI: Sairaanhoitajan eettisten ohjeiden tunnettavuus ja niiden käyttö hoitotyön tukena sisätautien vuodeosastolla Pro gradu -tutkielma, 34 sivua, 10 liitesivua
Olet vastuussa osaamisestasi
 Olet vastuussa osaamisestasi Ohjelmistoammattilaisuuden uudet haasteet Timo Vehmaro 02-12-2015 1 Nokia 2015 Mitä osaamista tulevaisuudessa tarvitaan? Vahva perusosaaminen on kaiken perusta Implementaatio
Sisällysluettelo Table of contents
 Sisällysluettelo Table of contents OTC:n Moodlen käyttöohje suomeksi... 1 Kirjautuminen Moodleen... 2 Ensimmäinen kirjautuminen Moodleen... 2 Salasanan vaihto... 2 Oma käyttäjäprofiili... 3 Työskentely
x = y x i = y i i = 1, 2; x + y = (x 1 + y 1, x 2 + y 2 ); x y = (x 1 y 1, x 2 + y 2 );
; x y = (x 1 y 1, x 2 + y 2 );") LINEAARIALGEBRA Harjoituksia/Exercises 2017 1. Olkoon n Z +. Osoita, että (R n, +, ) on lineaariavaruus, kun vektoreiden x = (x 1,..., x n ), y = (y 1,..., y n ) identtisyys, yhteenlasku ja reaaliluvulla
LINEAARIALGEBRA Harjoituksia/Exercises 2017 1. Olkoon n Z +. Osoita, että (R n, +, ) on lineaariavaruus, kun vektoreiden x = (x 1,..., x n ), y = (y 1,..., y n ) identtisyys, yhteenlasku ja reaaliluvulla
Academic Opening. Opening - Introduction. In this essay/paper/thesis I shall examine/investigate/evaluate/analyze General opening for an essay/thesis
 - Introduction In this essay/paper/thesis I shall examine/investigate/evaluate/analyze General opening for an essay/thesis Tässä esseessä / tutkielmassa / opinnäytetyössä tutkin / tarkastelen / arvioin/
Tarua vai totta: sähkön vähittäismarkkina ei toimi? 11.2.2015 Satu Viljainen Professori, sähkömarkkinat
 Tarua vai totta: sähkön vähittäismarkkina ei toimi? 11.2.2015 Satu Viljainen Professori, sähkömarkkinat Esityksen sisältö: 1. EU:n energiapolitiikka on se, joka ei toimi 2. Mihin perustuu väite, etteivät
7. Product-line architectures
 7. Product-line architectures 7.1 Introduction 7.2 Product-line basics 7.3 Layered style for product-lines 7.4 Variability management 7.5 Benefits and problems with product-lines 1 Short history of software
Rakennukset Varjostus "real case" h/a 0,5 1,5
 Tuulivoimala Rakennukset Asuinrakennus Liikerak. tai Julkinen rak. Lomarakennus Teollinen rakennus Kirkollinen rakennus Varjostus "real case" h/a 1 h/a 8 h/a 20 h/a 1 2 3 5 8 4 6 7 9 10 0 0,5 1 1,5 2 km
Mat Seminar on Optimization. Data Envelopment Analysis. Economies of Scope S ysteemianalyysin. Laboratorio. Teknillinen korkeakoulu
 Mat-2.4142 Seminar on Optimization Data Envelopment Analysis Economies of Scope 21.11.2007 Economies of Scope Introduced 1982 by Panzar and Willing Support decisions like: Should a firm... Produce a variety
FinFamily PostgreSQL installation ( ) FinFamily PostgreSQL
 FinFamily PostgreSQL") FinFamily PostgreSQL 1 Sisällys / Contents FinFamily PostgreSQL... 1 1. Asenna PostgreSQL tietokanta / Install PostgreSQL database... 3 1.1. PostgreSQL tietokannasta / About the PostgreSQL database...
FinFamily PostgreSQL 1 Sisällys / Contents FinFamily PostgreSQL... 1 1. Asenna PostgreSQL tietokanta / Install PostgreSQL database... 3 1.1. PostgreSQL tietokannasta / About the PostgreSQL database...
Salasanan vaihto uuteen / How to change password
 Salasanan vaihto uuteen / How to change password Sisällys Salasanakäytäntö / Password policy... 2 Salasanan vaihto verkkosivulla / Change password on website... 3 Salasanan vaihto matkapuhelimella / Change
LANSEERAUS LÄHESTYY AIKATAULU OMINAISUUDET. Sähköinen jäsenkortti. Yksinkertainen tapa lähettää viestejä jäsenille
 tiedote 2 / 9.3.2017 LANSEERAUS LÄHESTYY AIKATAULU 4.3. ebirdie-jäsenkortti esiteltiin Golfliiton 60-vuotisjuhlaseminaarissa 17.3. ebirdie tulee kaikkien ladattavaksi Golfmessuilla 17.3. klo 12:00 alkaen
HARJOITUS- PAKETTI A
 Logistiikka A35A00310 Tuotantotalouden perusteet HARJOITUS- PAKETTI A (6 pistettä) TUTA 19 Luento 3.Ennustaminen County General 1 piste The number of heart surgeries performed at County General Hospital
TM ETRS-TM35FIN-ETRS89 WTG
 SHADOW - Main Result Assumptions for shadow calculations Maximum distance for influence Calculate only when more than 20 % of sun is covered by the blade Please look in WTG table WindPRO version 2.8.579
Kvanttilaskenta - 2. tehtävät
 Kvanttilaskenta -. tehtävät Johannes Verwijnen January 8, 05 edx-tehtävät Vastauksissa on käytetty edx-kurssin materiaalia.. Problem The inner product of + and is. Edelleen false, kts. viikon tehtävä 6..
Kysymys 5 Compared to the workload, the number of credits awarded was (1 credits equals 27 working hours): (4)
: (4)") Tilasto T1106120-s2012palaute Kyselyn T1106120+T1106120-s2012palaute yhteenveto: vastauksia (4) Kysymys 1 Degree programme: (4) TIK: TIK 1 25% ************** INF: INF 0 0% EST: EST 0 0% TLT: TLT 0 0% BIO:
Tilasto T1106120-s2012palaute Kyselyn T1106120+T1106120-s2012palaute yhteenveto: vastauksia (4) Kysymys 1 Degree programme: (4) TIK: TIK 1 25% ************** INF: INF 0 0% EST: EST 0 0% TLT: TLT 0 0% BIO:
Rekisteröiminen - FAQ
 Rekisteröiminen - FAQ Miten Akun/laturin rekisteröiminen tehdään Akun/laturin rekisteröiminen tapahtuu samalla tavalla kuin nykyinen takuurekisteröityminen koneille. Nykyistä tietokantaa on muokattu niin,
Oma sininen meresi (Finnish Edition)
") Oma sininen meresi (Finnish Edition) Hannu Pirilä Click here if your download doesn"t start automatically Oma sininen meresi (Finnish Edition) Hannu Pirilä Oma sininen meresi (Finnish Edition) Hannu Pirilä
Oma sininen meresi (Finnish Edition) Hannu Pirilä Click here if your download doesn"t start automatically Oma sininen meresi (Finnish Edition) Hannu Pirilä Oma sininen meresi (Finnish Edition) Hannu Pirilä
I. Principles of Pointer Year Analysis
 I. Principles of Pointer Year Analysis Fig 1. Maximum (red) and minimum (blue) pointer years. 1 Fig 2. Principle of pointer year calculation. Fig 3. Skeleton plot graph created by Kinsys/Kigraph programme.
Capacity utilization
 Mat-2.4142 Seminar on optimization Capacity utilization 12.12.2007 Contents Summary of chapter 14 Related DEA-solver models Illustrative examples Measure of technical capacity utilization Price-based measure
BDD (behavior-driven development) suunnittelumenetelmän käyttö open source projektissa, case: SpecFlow/.NET.
 suunnittelumenetelmän käyttö open source projektissa, case: SpecFlow/.NET.") BDD (behavior-driven development) suunnittelumenetelmän käyttö open source projektissa, case: SpecFlow/.NET. Pekka Ollikainen Open Source Microsoft CodePlex bio Verkkosivustovastaava Suomen Sarjakuvaseura
BDD (behavior-driven development) suunnittelumenetelmän käyttö open source projektissa, case: SpecFlow/.NET. Pekka Ollikainen Open Source Microsoft CodePlex bio Verkkosivustovastaava Suomen Sarjakuvaseura
Tilausvahvistus. Anttolan Urheilijat HENNA-RIIKKA HAIKONEN KUMMANNIEMENTIE 5 B RAHULA. Anttolan Urheilijat
 7.80.4 Asiakasnumero: 3000359 KALLE MANNINEN KOVASTENLUODONTIE 46 51600 HAUKIVUORI Toimitusosoite: KUMMANNIEMENTIE 5 B 51720 RAHULA Viitteenne: Henna-Riikka Haikonen Viitteemme: Pyry Niemi +358400874498
Hankkeiden vaikuttavuus: Työkaluja hankesuunnittelun tueksi
 Ideasta projektiksi - kumppanuushankkeen suunnittelun lähtökohdat Hankkeiden vaikuttavuus: Työkaluja hankesuunnittelun tueksi Erasmus+ -ohjelman hakuneuvonta ammatillisen koulutuksen kumppanuushanketta
Returns to Scale Chapters
 Return to Scale Chapter 5.1-5.4 Saara Tuurala 26.9.2007 Index Introduction Baic Formulation of Retur to Scale Geometric Portrayal in DEA BCC Return to Scale CCR Return to Scale Summary Home Aignment Introduction
RINNAKKAINEN OHJELMOINTI A,
 RINNAKKAINEN OHJELMOINTI 815301A, 18.6.2005 1. Vastaa lyhyesti (2p kustakin): a) Mitkä ovat rinnakkaisen ohjelman oikeellisuuskriteerit? b) Mitä tarkoittaa laiska säikeen luominen? c) Mitä ovat kohtaaminen
1.3 Lohkorakenne muodostetaan käyttämällä a) puolipistettä b) aaltosulkeita c) BEGIN ja END lausekkeita d) sisennystä
 puolipistettä b) aaltosulkeita c) BEGIN ja END lausekkeita d) sisennystä") OULUN YLIOPISTO Tietojenkäsittelytieteiden laitos Johdatus ohjelmointiin 811122P (5 op.) 12.12.2005 Ohjelmointikieli on Java. Tentissä saa olla materiaali mukana. Tenttitulokset julkaistaan aikaisintaan
OULUN YLIOPISTO Tietojenkäsittelytieteiden laitos Johdatus ohjelmointiin 811122P (5 op.) 12.12.2005 Ohjelmointikieli on Java. Tentissä saa olla materiaali mukana. Tenttitulokset julkaistaan aikaisintaan
Toppila/Kivistö 10.01.2013 Vastaa kaikkin neljään tehtävään, jotka kukin arvostellaan asteikolla 0-6 pistettä.
 ..23 Vastaa kaikkin neljään tehtävään, jotka kukin arvostellaan asteikolla -6 pistettä. Tehtävä Ovatko seuraavat väittämät oikein vai väärin? Perustele vastauksesi. (a) Lineaarisen kokonaislukutehtävän
MEETING PEOPLE COMMUNICATIVE QUESTIONS
 Tiistilän koulu English Grades 7-9 Heikki Raevaara MEETING PEOPLE COMMUNICATIVE QUESTIONS Meeting People Hello! Hi! Good morning! Good afternoon! How do you do? Nice to meet you. / Pleased to meet you.