Cardiovascular Risk Factors and Arterial Function After Gestational Diabetes Mellitus
|
|
|
- Hanna-Mari Hukkanen
- 6 vuotta sitten
- Katselukertoja:
Transkriptio


1 Acta Universitatis Tamperensis 2394 TIINA VILMI-KERÄLÄ Cardiovascular Risk Factors and Arterial Function After Gestational Diabetes Mellitus Role of obesity and metabolic syndrome
2 TIINA VILMI-KERÄLÄ Cardiovascular Risk Factors and Arterial Function After Gestational Diabetes Mellitus Role of obesity and metabolic syndrome ACADEMIC DISSERTATION To be presented, with the permission of the Faculty Council of the Faculty of Medicine and Life Sciences of the University of Tampere, for public discussion in the auditorium of Finn-Medi 5, Biokatu 12, Tampere, on 24 August 2018, at 12 o clock. UNIVERSITY OF TAMPERE
3 TIINA VILMI-KERÄLÄ Cardiovascular Risk Factors and Arterial Function After Gestational Diabetes Mellitus Role of obesity and metabolic syndrome Acta Universitatis Tamperensis 2394 Tampere University Press Tampere 2018
4 ACADEMIC DISSERTATION University of Tampere, Faculty of Medicine and Life Sciences Kanta-Häme Central Hospital, Department of Emergency Medicine and Department of Obstetrics and Gynecology, Hämeenlinna Linnan Klinikka, Cardiometabolic Unit, Hämeenlinna Finland Supervised by Professor Ari Palomäki University of Tampere Finland Docent Jukka Uotila University of Tampere Finland Docent Outi Palomäki University of Tampere Finland Reviewed by Docent Pirjo Mustonen University of Eastern Finland Finland Emeritus Professor Tapani Rönnemaa University of Turku Finland The originality of this thesis has been checked using the Turnitin OriginalityCheck service in accordance with the quality management system of the University of Tampere. Copyright 2018 Tampere University Press and the author Cover design by Mikko Reinikka Acta Universitatis Tamperensis 2394 Acta Electronica Universitatis Tamperensis 1903 ISBN (print) ISBN (pdf) ISSN-L ISSN X ISSN Suomen Yliopistopaino Oy Juvenes Print Tampere Painotuote
5 To my Family: Johannes, Vilma, Elias and Niilo Obstacles are those frightful things you see when you take your eyes off your goals. ~ Henry Ford
6
7 ABSTRACT Gestational diabetes mellitus (GDM) is a common metabolic complication that affected 17.5% of pregnancies in Finland in Although glucose homeostasis most often normalizes after delivery, women with previous GDM have a sevenfold risk of type 2 diabetes mellitus (T2DM) in the future. Moreover, affected women are also at an increased risk of developing cardiovascular disease (CVD) or metabolic syndrome (MetS) later in life. MetS is an accumulation of disadvantageous health conditions, and although it is evidently associated with the risk of CVD, occasionally its utility in this regard has been questioned in general practice. Nevertheless, MetS is a growing issue and it is linked to many conditions unique to women s health, including GDM. With this background, the aim of this study was to examine (in a setting of two cohorts) whether or not women s CVD risk, assessed by traditional as well as novel biomarkers and measures of arterial function, is already increased a few years after GDM. Additionally, another goal was to compute the effect of obesity on the results. Further, we wanted to study the utility of MetS diagnosis when estimating individualized CVD risk. For this, differences in arterial stiffness were determined between individually paired fertile women with and without MetS. Altogether, 240 women were selected in the follow-up study of two cohorts, and all of the women had both delivered in Kanta-Häme Central Hospital during and undergone a 75-g oral glucose tolerance test during the index pregnancy. In Studies I III, a total of 120 women with a history of GDM during the index pregnancy were compared with 120 age-matched women with normal glucose metabolism during pregnancy by assessing MetS prevalence, glucose and lipid metabolism, variables of low-grade inflammation and values of arterial function. To evaluate the effect of obesity on the results, the whole study population was divided into four subgroups according to body mass index (BMI) and previous GDM. In this original study population including 240 participants, there were 27 women with MetS. In Study IV, twenty-seven women with MetS were compared with individually matched counterparts without the syndrome. In addition to previous GDM, the counterparts without MetS were matched according to age, and serum concentrations of both LDL-cholesterol (LDL-C) and
8 total cholesterol (TC). Further, there was no significant difference in smoking history between the individually paired study groups. In Studies I III, when investigated on average 3.7 years after delivery, women with a history of GDM were found to have a 2.4-fold increased prevalence of MetS, and they were also more insulin resistant (as measured by using homeostasis model assessment of insulin resistance [HOMA-IR]) than those without previous GDM. Reflecting low-grade inflammation in the GDM cohort, serum concentrations of tissue inhibitor of metalloproteinase-1 (TIMP-1) were significantly upregulated after prior GDM. Moreover, women with previous GDM had higher values of pulse wave velocity (PWV), indicating that their arteries are less distensible than those in women with previous normoglycemic pregnancy. Most of the findings were more evident in obese participants; the influence of obesity frequently exceeded that of GDM. In Study IV, when arterial function was measured by three non-invasive methods, fertile women with MetS had increased arterial stiffness, a predictor of future CVD events, when compared with individually paired women without the syndrome. These results support the clinical use of MetS when revealing increased individual CVD risk, particularly among fertile-aged women.
9 TIIVISTELMÄ Raskausdiabetes eli gestationaalinen diabetes mellitus (GDM) tarkoittaa poikkeavaa glukoosiaineenvaihduntaa, joka todetaan ensimmäisen kerran raskauden aikana. Vuonna 2016 GDM komplisoi 17,5% raskauksista Suomessa. Yleensä poikkeava glukoosiaineenvaihdunta normalisoituu synnytyksen jälkeen, mutta raskausdiabeetikoilla on todettu seitsemän kertaa suurempi riski sairastua tyypin 2 diabetekseen (T2DM) myöhemmin elämänsä aikana. Lisäksi raskausdiabeetikoilla on tulevaisuudessa lisääntynyt sydän- ja verisuonitauti- sekä metabolisen oireyhtymän (MBO) riski. Jälkimmäisellä tarkoitetaan valtimotaudin riskitekijöiden kasaumaa. Vaikka MBO on liitetty kohonneeseen sydän- ja verisuonitautiriskiin, sen käyttöä kliinisessä työssä on myös kyseenalaistettu. Väitöskirjatutkimuksen tavoitteena on ollut selvittää, onko aiemmissa tutkimuksissa osoitettu raskausdiabeteksen jälkeinen kohonnut sydän- ja verisuonitautiriski todettavissa herkillä määrityksillä jo muutama vuosi synnytyksen jälkeen. Lisäksi on pyritty tutkimaan lisääntyvän lihavuuden vaikutuksia tuloksiin. Tutkimuksessa analysoitiin myös MBO-diagnoosin käyttökelpoisuutta kliinisessä työssä arvioitaessa yksilön sydän- ja verisuonitautiriskiä. Tutkimuksen kahteen, GDM- ja kontrollikohorttiin valittiin yhteensä 240 vuosina Kanta-Hämeen keskussairaalassa synnyttänyttä naista, joista 120 oli raskausaikana glukoosirasituskokeella diagnosoitu GDM ja 120 todettu normaali sokeriaineenvaihdunta. Osatöissä I III verrattiin näiden tutkimuskohorttien seurantatutkimusten haastattelun, fysikaalisten mittausten, laboratorio- ja valtimoiden toimintakokeiden tuloksia MBO:n esiintyvyyden, sokeri- ja rasva-aineenvaihdunnan, matala-asteisen tulehdustilan sekä valtimoiden elastisuuden suhteen. Arvioitaessa lihavuuden vaikutusta tuloksiin tutkimuspotilaat jaettiin neljään alaryhmään GDM-statuksen sekä painoindeksin mukaan. Yhteensä 27 naisella alkuperäisestä 240 tutkimuspotilaan populaatiosta todettiin MBO. Osatyössä IV verrattiin pareittain näiden 27 MBO:ää sairastavan naisen valtimoiden elastisuustuloksia 27 tunnettujen sydän- ja verisuonitaudin riskitekijöiden suhteen täsmätyn oireyhtymää sairastamattoman naisen vastaaviin tuloksiin. Osatöissä I III keskimäärin 3,7 vuotta synnytyksen jälkeen tehdyissä seurantatutkimuksissa todettiin, että raskausdiabeetikoilla esiintyi 2,4-kertaisesti
10 metabolista oireyhtymää verrattuna raskausaikana glukoosiaineenvaihdunnaltaan terveiksi todettuihin naisiin. Myös insuliiniresistenssi oli merkittävästi yleisempää raskausdiabeteksen sairastaneilla naisilla. Matala-asteiseen tulehdusreaktioon viittaava seerumin metalloproteinaasin inhibiittoripitoisuus oli koholla raskausdiabeteksen jälkeen. Lisäksi GDM-ryhmässä naisilla oli suurempi pulssiaallon kulkunopeus viitaten kontrolliryhmän naisia jäykempiin valtimoihin. Suurin osa löydöksistä korostui lihavilla naisilla ylittäen aiemmin sairastetun GDM:n aiheuttaman vaikutuksen. Osatyössä IV tutkittiin metabolista oireyhtymää sairastavien naisten verisuonten elastisuutta. Tuloksia verrattiin tarkasti tunnettujen sydän- ja verisuonitautien riskitekijöiden suhteen täsmättyjen, mutta oireyhtymää sairastamattomien naisten tuloksiin. Kolmella ei-kajoavalla menetelmällä mitattuna metabolista oireyhtymää sairastavilla naisilla oli jäykemmät valtimot oireyhtymää sairastamattomien naisten tuloksiin verrattuna. Tulokset tukevat MBO-diagnoosin kliinistä käyttökelpoisuutta etenkin fertiili-ikäisillä naisilla.
11 LIST OF ORIGINAL PUBLICATIONS This thesis is based on the following original publications, which are referred to in the text by their Roman numerals (I IV). I Vilmi-Kerälä T, Palomäki O, Vainio M, Uotila J, Palomäki A. The risk of metabolic syndrome after gestational diabetes mellitus a hospital-based cohort study. Diabetology & Metabolic Syndrome 2015; 7: 43. II Vilmi-Kerälä T, Palomäki O, Kankkunen P, Juurinen L, Uotila J, Palomäki A. Oxidized LDL, insulin resistance and central blood pressure after gestational diabetes mellitus. Acta Obstet Gynecol Scand. 2016; 95(12): III Vilmi-Kerälä T, Lauhio A, Tervahartiala T, Palomäki O, Uotila J, Sorsa S, Palomäki A. Subclinical inflammation associated with prolonged TIMP-1 upregulation and arterial stiffness after gestational diabetes mellitus: a hospitalbased cohort study. Cardiovasc Diabetol. 2017; 16(1): 49. IV Vilmi-Kerälä T, Koivistoinen T, Palomäki O, Uotila J, Palomäki A. Arterial stiffness in fertile women with metabolic syndrome. Ann Med. 2017; 49(8): The publications were adapted with the permission of the copyright owners.
12 ABBREVIATIONS ACOG ADA ALAT AlbCre AMI ANOVA BMI BP C1 C2 C&C cbp CDA CI CV CVD D DM Dt f fp g American Congress of Obstetricians and Gynecologists American Diabetes Association alanine transaminase albumin to creatinine ratio acute myocardial infarction analysis of variance body mass index blood pressure large arterial compliance small arterial compliance Carpenter and Coustan central blood pressure Canadian Diabetes Association confidence interval cardiovascular cardiovascular disease distance diabetes mellitus time delay/transit time fasting fasting plasma gram(s)
13 GCT GDM Gluc h HAPO HbA1c HDL HDL-C HOMA-IR HR hscrp IADPSG IDF i.e. IFG IGT Insu IR LDL LDL-C MetS MMP NCEP NDDG NO NPV glucose challenge test gestational diabetes mellitus glucose hours Hyperglycemia and Adverse Pregnancy Outcome glycosylated hemoglobin A1c high-density lipoprotein high-density lipoprotein cholesterol homeostasis model assessment of insulin resistance hazard ratio high sensitivity C-reactive protein International Association of the Diabetes and Pregnancy Study Groups International Diabetes Federation id est impaired fasting glucose impaired glucose tolerance insulin insulin resistance low-density lipoprotein low-density lipoprotein cholesterol metabolic syndrome matrix metalloproteinase National Cholesterol Education Program National Diabetes Data Group nitric oxide negative predictive value
14 NS OGTT OR oxldl PCOS PCSK9 PP PPV PWV QUICKI ROS RR SD TC TG TIMP T1DM T2DM VLDL WC WHO nonsignificant oral glucose tolerance test odds ratio oxidized low-density lipoprotein polycystic ovary syndrome proprotein convertase subtilisin/kexin type-9 pulse pressure positive predictive value pulse wave velocity quantitative insulin sensitivity check index reactive oxygen species relative risk standard deviation total cholesterol triglyceride tissue inhibitor of metalloproteinase type 1 diabetes mellitus type 2 diabetes mellitus very low-density lipoprotein waist circumference World Health Organization
15 TABLE OF CONTENTS Abstract... 5 Tiivistelmä... 7 List of Original Publications... 9 Abbreviations Introduction Review of the literature Gestational diabetes mellitus Definition and pathogenesis Diagnosis and prevalence Long-term outcomes of mothers after gestational diabetes mellitus Type 2 diabetes mellitus Metabolic syndrome Cardiovascular diseases Implications for clinical care Metabolic syndrome and obesity Definition and prevalence of metabolic syndrome Classification and prevalence of obesity Challenges of obesity in health care The atherosclerotic process Low-density lipoprotein particles in the arterial wall Risk factors of atherosclerosis Traditional risk factors Insulin resistance Dyslipidemias Other non-traditional biomarkers of increased risk: oxidized low-density lipoprotein, high sensitivity C-reactive protein and matrix metalloproteinase Arterial dysfunction Arterial compliance Pulse wave velocity Central blood pressure... 53
16 3 Aims of the study Subjects and Methods Subjects and study design Methods Individual interviews Physical examinations Clinical chemistry and immunoassays Oxidized low-density lipoprotein Matrix metalloproteinase-8, and -9 and tissue inhibitor of metalloproteinase The homeostasis model of insulin resistance Non-invasive measurements of arterial function Arterial compliance Pulse wave velocity Central blood pressure Statistical analyses Ethical considerations Results Follow-up study of gestational diabetes mellitus and control cohort (I III) Risk factors of cardiovascular disease after gestational diabetes mellitus (I III) Metabolic syndrome (MetS) (I) Glucose metabolism and homeostasis model of insulin resistance (I & II) Lipids and oxidized low-density lipoprotein (I & II) Low-grade inflammation (III) Arterial function after gestational diabetes mellitus (II & III) Effect of obesity (I III) Arterial stiffness in fertile women with MetS (IV) Women with metabolic syndrome and individually paired counterparts without the syndrome (IV) Arterial compliance, pulse wave velocity and central blood pressure (IV) Discussion Long-term outcomes of mothers after gestational diabetes mellitus (I III) Metabolic syndrome (I) Glucose metabolism and lipids (I & II) Low-grade inflammation (III) Arterial function (II & III)... 83
17 6.2 Effect of obesity (I III) Arterial stiffness in fertile women with metabolic syndrome (IV) Strengths and limitations of the study Future considerations Summary and Conclusions Challenge of long-term follow-up after gestational diabetes mellitus Acknowledgements References Original Publications
18
19 1 INTRODUCTION Gestational diabetes mellitus (GDM) has long been defined as glucose intolerance with first recognition during pregnancy (American Diabetes Association. 2003). In recent decades, the prevalence of GDM has multiplied globally along with increasing rates of obesity, advancing maternal age and inactive lifestyles (Dabelea et al. 2005, Schmidt et al. 2012, Vuori & Gissler. 2014). In Finland, GDM complicated 17.5% of pregnancies in 2016 (Vuori & Gissler. 2017). In most cases, glucose intolerance normalizes after delivery (Järvelä et al. 2006, Kim et al. 2002, The Expert Committee on the Diagnosis and Classification of Diabetes Mellitus. 1997), but women with a history of GDM have at least a sevenfold risk of developing type 2 diabetes (T2DM) in the future (Bellamy et al. 2009). Additionally, affected women are at a higher risk of developing cardiovascular disease (CVD) or metabolic syndrome (MetS) years after the pregnancy (Goueslard et al. 2016, Y. Xu et al. 2014). Metabolic syndrome (MetS) is an accumulation of disadvantageous health conditions, including central obesity, elevated blood pressure, dyslipidemia and abnormal glucose tolerance, which altogether increase the risk of cardiovascular disease (National Cholesterol Education Program (NCEP) Expert Panel on Detection, Evaluation, and Treatment of High Blood Cholesterol in Adults (Adult Treatment Panel III). 2002). MetS is a growing issue and linked to many conditions unique to women s health, including GDM. The prevalence of MetS is higher in women and it has rapidly increased in recent decades in parallel with growing obesity and sedentary lifestyles (E. L. Miller & Mitchell. 2006, Y. Xu et al. 2014). The central component of MetS is insulin resistance, which is associated with an enhanced inflammatory state and vascular endothelial dysfunction (Pickup. 2004). Although MetS is evidently associated with the risk of CVD, in general practice its utility in this regard has occasionally been questioned (Balkau et al. 2002, Bauduceau et al. 2007, Borch-Johnsen & Wareham. 2010, Kahn et al. 2005, Mente et al. 2010, Simmons et al. 2010, Woodward & Tunstall-Pedoe. 2009). Atherosclerosis is a chronic process that is crucial for the development of CVD (Furie & Mitchell. 2012, Rocha & Libby. 2009). It begins with accumulation of lipoproteins, particularly low-density lipoprotein (LDL), into the arterial wall, 17
20 which are then subjected to oxidative modifications (Stocker & Keaney. 2004). Circulating oxidized LDL (oxldl) seems to reflect the level of oxidative stress (Sigurdardottir et al. 2002), and increased amounts of circulating oxldl are associated with the occurrence of coronary heart disease (Holvoet et al. 1998, Holvoet et al. 2001). Besides elevated oxidative stress, inflammation is important in atherosclerosis (Feng et al. 2011, Stocker & Keaney. 2004), and it seems to be a predictor of women s cardiovascular (CV) complications (Ridker et al. 2002). Elevated levels of high-sensitivity C-reactive protein (hscrp) represent a significant risk factor of atherosclerosis (Karadeniz et al. 2015). The group of matrix metalloproteinases (MMPs) and their inhibitors, tissue inhibitors of metalloproteinases (TIMPs), have also been related to the formation of atherosclerosis and its progression in humans (Goncalves et al. 2009, Paim et al. 2013, Siasos et al. 2012). Further, arterial endothelial dysfunction is a major, early, and possibly reversible step in the atherosclerotic process (Berliner et al. 1995, Healy. 1990, Ross. 1993, Smith et al. 2004). With this background, the present series of studies was aimed at exploring whether or not women s CVD risk, assessed by traditional as well as novel biomarkers and values of arterial function, is already increased a few years after GDM. Another goal was to evaluate the effect of obesity on the results. Further, we wanted to study the utility of MetS diagnosis when estimating individual CVD risk. Therefore, differences in arterial stiffness were explored in individually paired fertile women with and without MetS. 18
21 2 REVIEW OF THE LITERATURE 2.1 Gestational Diabetes Mellitus Definition and pathogenesis In 1882, Matthews Duncan first reported that diabetes existing before pregnancy may have severe adverse effects on fetal and neonatal outcomes (Duncan. 1882). In the 1940s, it was recognized that women who developed diabetes years after pregnancy had suffered unusually high fetal and neonatal mortality (H. C. Miller. 1946). By the 1950s the term gestational diabetes was applied to a temporary hyperglycemic condition that influenced fetal outcomes unfavorably, which then was normalized after delivery (Carrington et al. 1957). In 1965, the World Health Organization (WHO) Expert Committee on Diabetes Mellitus released the first guideline on diabetes, in which gestational diabetes mellitus (GDM) was defined as hyperglycemia of diabetic levels occurring during pregnancy (WHO. 1999). Consequently, GDM is a form of hyperglycemia (American Diabetes Association. 2003). For many years, it was defined as any degree of carbohydrate intolerance resulting in hyperglycemia with onset or first recognition during pregnancy (The Expert Committee on the Diagnosis and Classification of Diabetes Mellitus. 1997). According to Finnish Current Guidelines this still is the definition of GDM (Gestational diabetes. Current Care Guidelines. 2013). However, GDM can be diagnosed only when other types of diabetes are excluded. For example, nowadays couples are generally postponing parenthood across the developed countries (Schmidt et al. 2012). In Europe, the mean age of primiparous women has increased, being currently between 28 and 29 years (T. J. Matthews & Hamilton. 2014, Schmidt et al. 2012). With age, the prevalence of type 2 diabetes (T2DM) increases, and additionally, the ongoing epidemic of obesity has led to more T2DM in women of reproductive age. Therefore, there is an increased number of pregnant women with undiagnosed T2DM (Lawrence et al. 2008). 19
22 Normally, fasting and postprandial glucose concentrations are lower in the first and early second trimester than in normoglycemic nonpregnant women. Elevated fasting or postprandial plasma glucose levels at this time in pregnancy may well reflect the presence of diabetes which has already existed before the pregnancy (WHO. 1999). In 2013, the WHO divided hyperglycemia in pregnancy as follows: 1) diabetes in pregnancy, which means pregnancy occurring in a woman with known diabetes, overt diabetes first detected during pregnancy, or pre-gestational diabetes, and 2) GDM (WHO. 2014). Recently, the American Diabetes Association (ADA) suggested that women diagnosed with diabetes in the first trimester should be classified as having overt or preexisting pre-gestational diabetes, meaning T2DM or, very rarely, type 1 diabetes (T1DM). According to the ADA, GDM is diabetes that is first diagnosed in the second or third trimester of pregnancy and that is not clearly either preexisting T1DM or T2DM (American Diabetes Association. 2017). The pathogenesis of GDM results mainly from two causes: increased insulin resistance (IR) and β-cell dysfunction (Buchanan & Xiang. 2005). IR is generally defined by a decrease in insulin sensitivity in the peripheral tissues (Hurrle & Hsu. 2017). Pregnancy is normally characterized by increased IR that begins near midpregnancy and progresses through the third trimester to levels that approximate the IR seen in individuals with T2DM (Catalano et al. 1999). Increased maternal IR is physiologically important, since carbohydrate is the major fuel for fetal growth (Catalano et al. 2003). IR during pregnancy seems to result from a combination of increased maternal adiposity and the insulin-desensitizing effects of hormonal products of the placenta. The fact that in the majority of GDM cases, glucose regulation will return to normal after delivery suggests that the major contributors to this state of resistance are placental hormones (Barbour et al. 2007). The second point is that pancreatic β-cells normally increase their insulin secretion to compensate for the IR of pregnancy (Buchanan & Xiang. 2005). However, various stressful stimuli, such as nutrient overload, advanced glycation, and oxidative stress followed by lipoxidation have been shown to lead to β-cell dysfunction (Sasson. 2017). Pregnant women with GDM tend to have greater IR than women with normoglycemic pregnancy (Catalano et al. 1991, Catalano et al. 1999). As a result, changes in circulating glucose levels over the course of pregnancy are relatively small compared with the large changes in insulin sensitivity. Strong β-cell function before increasing IR with advancing gestational age is the hallmark of standard glucose regulation during pregnancy (Buchanan & Xiang. 2005). 20
23 Other factors that may affect IR during pregnancy include body composition, the prevalence of metabolic syndrome (MetS), and other obesity-related chronic diseases (Cossrow & Falkner. 2004, Ervin. 2009). Further, there is evidence of a genetic association between common T2DM-risk gene variants with GDM (Mao et al. 2012). The published literature provides support for genetic variants having an effect on T2DM and β-cell function, but understanding of the genetic basis of IR remains more limited (Manning et al. 2012, Walford et al. 2016). One explanation for that could be that adiposity may hide the localization of genetic variants influencing IR by introducing extra variance in the outcome that is not attributable to genetic variation (Prudente et al. 2009). However, up to now few additional loci associated with fasting insulin and other IR-associated traits have been observed (Manning et al. 2012) Diagnosis and prevalence Insulin sensitivity increases in the first and early second trimester, and since both fasting and postprandial glucose levels are lower in early stages of pregnancy than in normoglycemic nonpregnant women, the diagnostic criteria of GDM are lower than those of DM (Diabetes. Current Care Guidelines. 2018, Gestational diabetes. Current Care Guidelines. 2013). While the earliest GDM criteria were based mostly on the future risk of developing diabetes, the more recent thresholds of GDM have been based on adverse perinatal outcomes (International Association of Diabetes and Pregnancy Study Groups Consensus Panel et al. 2010, Mishra et al. 2016). In 1964, O Sullivan and Mahan provided the first evidence that screening, diagnosis and treatment of glucose intolerance during pregnancy in women not previously known to have diabetes improved outcomes (O Sullivan & Mahan. 1964). Based on data obtained from oral glucose tolerance tests (OGTTs) performed on 752 gravidas, the authors proposed the first diagnostic criteria for GDM based on the results of 3-hour (h) 100-gram (g) OGTTs, which were 5.0 mmol/l when fasting (f), and after a 100-g oral glucose intake 9.2 mmol/l at 1 h, 8.0 mmol/l at 2 h and 6.9 mmol/l at 3 h. O Sullivan and Mahan published cutoff values based on whole-blood glucose values two standard deviations (SDs) above the mean at each of these time points, and an abnormal OGTT result was defined as two or more pathological values out of four (O Sullivan & Mahan. 1964). Moreover, in 1973 O'Sullivan et al. first introduced a universal 50-g blood 21
24 glucose challenge test (GCT) with a cut-off value of 7.2 mmol/l in all pregnant women. The sensitivity of the GCT was 79 % and specificity 87 % for GDM in a population of 752 pregnant women, all of whom also underwent the diagnostic 100-g, 3-h OGTT (O Sullivan et al. 1973). Nevertheless, the positive (PPV) and negative predictive value (NPV) of the GCT depended greatly on the prevalence of GDM in the studied population (Mishra et al. 2016). In 1979 and 1982, the international panel of the National Diabetes Data Group (NDDG), along with Carpenter and Coustan (C&C) recommended new diagnostic cut-off values for the 100-g OGTT, both illustrated in Table 1 (Carpenter & Coustan. 1982, NDDG. 1979). In addition, the WHO established uniform definitions of diabetes for nonpregnant individuals in 1980, and extended this recommendation to pregnant women (WHO. 1999). The NDDG first preferred the use of plasma instead of whole blood for glucose analysis. Because the concentration of plasma glucose is about % higher than in whole blood, the glycemic cut-offs were raised by the NDDG (Holtkamp et al. 1975, NDDG. 1979). The NDDG panel supported a two-step method, first with universal screening by using the 50-g GCT, followed by a 100-g OGTT if the screen GCT was positive, whereas the WHO proposed a one-step screening strategy by using two values, i.e. fasting and 2-h plasma glucose levels in connection with the 2-h 75-g OGTT as diagnostic test for diabetes and glucose intolerance (NDDG. 1979, WHO. 1999). In 1998, the International Association of Diabetes and Pregnancy Study Groups (IADPSG) was established to find universal agreement between many national and international recommendations addressing diabetes in pregnancy. This multinational delegation reviewed the data of the elaborate Hyperglycemia and Adverse Pregnancy Outcome (HAPO) study (HAPO Study Cooperative Research Group et al. 2008). In 2010, the IADPSG suggested universal screening with a single-step approach and new diagnostic criteria for GDM that was based on a 2-h, 75-g OGTT. While all the earlier GDM criteria were based mostly on future risk of developing diabetes, not on adverse perinatal outcomes (Mishra et al. 2016), the new thresholds of the IADPSG were placed according to an 1.75 odds ratio (OR) of having complications seen in the HAPO study (International Association of Diabetes and Pregnancy Study Groups Consensus Panel et al. 2010). A basis on adverse perinatal outcomes is the great advantage of IADPSG criteria, but one criticism has been that it increases the number of GDM diagnoses, as a relatively low cut-off value of fasting plasma glucose is used (Rani & Begum. 2016). Further, at the beginning, a second limitation was that the HAPO study was performed 22
25 mainly among Caucasian women (Mishra et al. 2016). Later, it was proved that IADPSG criteria can be adopted for women of Indian origin (Seshiah et al. 2012). Thus, after several decades of research there is still no global consensus on screening or diagnostic methods and criteria for GDM (Negrato & Gomes. 2013, Rani & Begum. 2016). In general practice, the WHO, for instance, has now adopted the IADPSG recommendations, whereas the American Congress of Obstetricians and Gynecologists (ACOG) advises continuing with the two-step screening procedure (The Committee on Obstetric Practice. 2011, WHO. 2013a). Currently, the ADA accept both the one- and two-step methods to screen and diagnose GDM, agreeing with the ACOG and IADPSG recommendations (Agarwal. 2015). Further, depending on the country, screening and diagnostic methods can be risk-based or universal one- or two-step procedures. The diagnosis of GDM is made by using 75-g or 100-g OGTTs. Risk factors of GDM include, for instance, obesity, previous GDM or a previous macrosomic infant weighing 4.5 kg or more, known history of DM in first-degree relatives, ethnic family origin (non-caucasian women) with a high prevalence of DM, and clinical conditions associated with IR such as polycystic ovary syndrome (PCOS) (Gestational diabetes. Current Care Guidelines. 2013, Rani & Begum. 2016). However, there is evidence that % of women diagnosed as having GDM have no risk factors for it (Avalos et al. 2013, Chevalier et al. 2011). In Finland, GDM screening using a 75-g 2-h OGTT is offered to all pregnant women, except those who are at the lowest risk: primiparous women less than 25 years old and body mass index (BMI) 25 kg/m 2 or below and no known history of DM in first-degree relatives, or multiparous women less than 40 years old and no GDM in previous pregnancy or pregnancies and BMI 25 kg/m 2 or below before the current pregnancy (Gestational diabetes. Current Care Guidelines. 2013). Formal systematic testing is normally done between 24 and 28 weeks of gestation. However, the first screening is already offered at 12 to 16 gestational weeks for women at high risk of GDM. Factors indicating high GDM risk are GDM in previous pregnancy or pregnancies, BMI over 35 kg/m 2 before the pregnancy, glucosuria, T2DM in first-degree relatives, oral medication with glucocorticoids, and PCOS. To determine if GDM is present in pregnant women, a standard OGTT is recommended after overnight fasting by giving 75 g anhydrous glucose in ml water. Venous plasma glucose is measured in fasting samples, and after one and two hours (Gestational diabetes. Current Care Guidelines. 2013). The diagnostic criteria for GDM according to Finnish Current Guidelines and some of the most commonly used criteria worldwide are presented in Table 1 (Agarwal. 23
26 2015, Carpenter & Coustan. 1982, Gestational diabetes. Current Care Guidelines. 2013, Rani & Begum. 2016). Table 1. Commonly used guidelines globally for the diagnosis of GDM. Organization Year Advice for screening Method of screening (positive cut-off) 50 g GCT ( 7.8) Glucose load, g Glucose thresholds (mmol/l) fasting 1-h 2-h 3-h No. of OGTT values for diagnosis ACOG 2013 all except low risk C&C 1982 none OGTT CDA 2013 not 50 g GCT specified ( 7.8) EASD 1991 not not or specified specified 6.0 Finnish 2013 all except OGTT Guidelines low risk IADPSG 2010 universal OGTT NDDG 1979 none 50 g GCT ( 7.8) NICE 2015 clinical risk OGTT WHO 1999 not OGTT specified WHO 2013 universal OGTT ACOG: American Congress of Obstetricians and Gynecologists; C&C: Carpenter & Coustan; CDA: Canadian Diabetes Association; EASD: European Association for the Study of Diabetes; GCT: glucose challenge test; GDM: gestational diabetes mellitus; IADPSG: International Association of the Diabetes and Pregnancy Study Groups; OGTT: oral glucose tolerance test; NDDG: National Diabetes Data Group; NICE: National Institute for Health and Care Excellence; No.: number; WHO: World Health Organization. During the last decade, the prevalence of GDM has increased across the developed world, placing it as one of the most common metabolic complications of pregnancy (American Diabetes Association. 2014). Globally, the prevalence of GDM varies from 2% to 32%; a median estimate for North America is 9% and for Europe 6% (Zhu & Zhang. 2016). Recently, the prevalence of GDM has also quickly grown in Finland, being 17.5% in 2016 (Vuori & Gissler. 2017). The prevalence is increasing mostly because of the older age and higher BMI of gravidas. In Finland, the Current Guidelines were published in 2008 and updated in 2013 without any change in the diagnostic criteria of GDM. However, the Finnish diagnostic criteria and screening strategy of GDM were changed in At that time OGTT screening during pregnancy was extended from risk-based to consider 24
27 all pregnant women, expect those at low risk (Gestational diabetes. Current Care Guidelines. 2013). The extended screening procedure might also have an affect on the increased prevalence of GDM in Finland. Figure 1 shows the prevalence of GDM in Finland in Further, it presents both the mean age and BMI of parturients in Finland in the same time period. The prevalence of GDM varies widely depending mostly on the population screened, different strategies for detection of GDM and the diagnostic test and criteria being used (Akgöl et al. 2017, American Diabetes Association. 2017, WHO. 2013a). For example, according to Akgöl et al. (2017), the new IADPSG criteria lead to a higher GDM prevalence and more diagnoses in young women when compared with other strategies (Akgöl et al. 2017). Figure 1. Average age and BMI of parturients, and prevalence of GDM in Finland in (Vuori & Gissler. 2017) ,1 30,1 30,1 30,2 30,3 30,4 30,5 30,6 30,7 24,2 24,3 24,4 24,5 24,5 24,6 24,5 24,6 24,7 Average age of parturients (years) Average BMI of parturients (kg/m2) Prevalence of GDM (%) ,6 8,9 11,2 12,5 12, ,9 15,9 17, Year Long-term outcomes of mothers after gestational diabetes mellitus Pregnancy has been said to be a window to the future health of a woman (Catov & Margerison-Zilko. 2016, Gilmore et al. 2015). Although in the majority of GDM 25
28 cases, glucose regulation will return to normal after delivery (The Expert Committee on the Diagnosis and Classification of Diabetes Mellitus. 1997), several studies have indicated that a diagnosis of GDM has significant implications for the future health of the mother. For instance, women with prior GDM have a higher risk of recurrence of GDM in future pregnancy, the rate of recurrence varying between 30 to 84% (Kim et al. 2002, Kim, Berger et al. 2007). GDM also appears to be associated with depressive symptoms shortly after delivery (Varela et al. 2017). Further, there is at least a sevenfold risk of T2DM after GDM (Bellamy et al. 2009). In addition, studies reported earlier have shown a greater prevalence of metabolic syndrome in women with prior GDM (Y. Xu et al. 2014). Research data have also revealed subclinical inflammation and vascular dysfunction after GDM (Heitritter et al. 2005), contributing to a higher risk of cardiovascular disease (CVD) (Goueslard et al. 2016, Shah et al. 2008, Vrachnis et al. 2012). Postpartum glucose testing is important in screening for T2DM in women with previous GDM (Poola- Kella et al. 2017) Type 2 diabetes mellitus Although shortly after birth following GDM glucose tolerance is usually restored to pregestational levels, independent of population or ethnic group, affected women remain at an increased risk of developing type 2 diabetes mellitus (Ben- Haroush et al. 2004, Hunt & Schuller. 2007, Järvelä et al. 2006, Kim et al. 2002). The incidences of both GDM and T2DM are rising throughout the world, consequently resulting in huge health-care and economic costs (Hunt & Schuller. 2007, Lipscombe & Hux. 2007). In 2002, Kim et al. published a review of 28 studies to examine the association between GDM and T2DM. They noticed that the cumulative incidence of T2DM after pregnancies complicated by GDM increased from 2.6% to over 70% when the follow-up of women was lengthened from 6 weeks to 28 years postpartum. The growth in incidence occurred markedly in the first five years after delivery and then plateaued after 10 years. During pregnancy, the level of fasting glucose was the factor which was most commonly associated with the risk of future T2DM (Kim et al. 2002). For instance, Steinhart et al. (1997) reported that the risk of future T2DM was increased 11-fold (OR 11.05; 95% CI ), when the concentration of fasting glucose was over 5.83 mmol/l during pregnancy when compared with that in GDM women with lower levels (Steinhart et al. 1997). 26
29 Subsequently, Bellamy et al. published another, often-cited review in The meta-analysis of twenty studies, covering over women with T2DM, confirmed undoubtedly the strong association between GDM and T2DM. According to Bellamy et al. (2009) women with earlier GDM have a relative risk (RR) of 7.43 (95% CI ) of developing T2DM later in life when compared with women with previous normoglycemic pregnancies (Bellamy et al. 2009). Recently, research evidence revealed that among GDM women, both pregestational obesity and excessive weight gain from pre-pregnancy to the postpartum period magnifies the risk of T2DM after delivery (Liu et al. 2014). Further, decreased insulin sensitivity, β-cell compensation and recurrent GDM may contribute, and maternal factors such as lactation may reduce the risk of developing T2DM (Poola-Kella et al. 2017). Unquestionably, the association between GDM and T2DM is strong. Further, the knowledge that several risk factors are the same suggests that these two disorders might have an overlapping cause (Kim et al. 2002). This hypothesis has been supported by the results of candidate gene studies (Y. M. Cho et al. 2009, Lauenborg et al. 2009). For long periods of time, T2DM can be a silent disease leading to people being unaware of having the condition. Unfortunately, untreated disease is harmful due to the fact that both microvascular and macrovascular diabetic complications start to develop before typical symptoms of diabetes occur. The nature of T2DM is progressive, finally after many years of hyperglycemia culminating in end-organ damage and complications. Upon diagnosis of T2DM, about half of the pancreatic β-cell function is lost (Holman. 1998). In high-risk populations, including women with previous GDM, early detection of diabetes followed by necessary interventions may preserve β-cell function and reduce the risk of complications (DeFronzo & Abdul-Ghani. 2011). This is why women with prior GDM should be reclassified by means of OGTTs six weeks or more after delivery into one of the following categories: diabetes, impaired fasting glucose (IFG), impaired glucose tolerance (IGT), or normoglycemia (The Expert Committee on the Diagnosis and Classification of Diabetes Mellitus. 1997). In cases of medically treated GDM, medication is discontinued immediately after delivery. Finnish guidelines recommend OGTT screening six to twelve weeks after delivery in cases of medicated GDM during pregnancy, and one year after delivery in diet-treated GDM. If the first screen is abnormal (IFG or IGT), a subsequent OGTT test is suggested after one year (Gestational diabetes. Current Care Guidelines 2013). Moreover, if the screening result is normal, GDM women should undergo frequent 27
30 testing every three years by means of OGTTs for rest of their lives (Gestational diabetes. Current Care Guidelines. 2013, Kim, Herman et al. 2007, Metzger et al. 2007) Metabolic syndrome Metabolic syndrome (MetS) is an international health problem, the hallmarks of which are considered to be accumulation of abdominal obesity, hypertension, dyslipidemia and abnormal glucose tolerance or diabetes (National Cholesterol Education Program (NCEP) Expert Panel on Detection, Evaluation, and Treatment of High Blood Cholesterol in Adults (Adult Treatment Panel III). 2002). GDM shares common features with MetS, including dyslipidemia, insulin resistance and endothelial dysfunction (Anastasiou et al. 1998, Gobl et al. 2014, Hannemann et al. 2002, Heitritter et al. 2005, Isomaa et al. 2001). A variety of organizations have recommended slightly different definitions of MetS. These include the WHO, the National Cholesterol Education Program (NCEP) and the International Diabetes Federation (IDF) (Alberti & Zimmet. 1998, International Diabetes Federation. 2006, National Cholesterol Education Program (NCEP) Expert Panel on Detection, Evaluation, and Treatment of High Blood Cholesterol in Adults (Adult Treatment Panel III). 2002). (There are more details in Section 2.2.1, below.) In the 21 st century, several investigators have explored the association between MetS and previous GDM (Table 2) (Akinci et al. 2011, Derbent et al. 2011, Di Cianni et al. 2007, Ijäs et al. 2013, Karoli et al. 2015, Lauenborg et al. 2005, Li et al. 2015, Mai et al. 2014, Noctor et al. 2015, Puhkala et al. 2013, Retnakaran et al. 2010, Tam, Ma, Yang et al. 2012, Verma et al. 2002, Wijeyaratne et al. 2006). Tam et al. (2007) reported similar rates of MetS in women with and without a history of GDM (7.5% vs. 8.1%; p = 0.85) followed up at a median of eight years (range 7 10) after delivery (Tam et al. 2007). Further, at a 5-year follow-up, Albareda et al. (2005) compared 262 women with former GDM with 66 normoglycemic controls. In accordance with NCEP ATP III criteria, women with a history of GDM differed only in the rate of fasting hyperglycemia and showed a trend toward a higher rate of hypertension, but the difference in prevalence of MetS (11.1% vs. 6.1%) was not significant (Albareda et al. 2005). 28
31 Table 2. Prevalence of MetS in women with and without prior GDM according to the current literature. Diagnostic criteria of MetS are shown in Table 3. Author and publication year Number of GDM/ non-gdm Treatment of GDM Diagnostic criteria of GDM Followup, years Prevalence of MetS in GDM/non- GDM, % Diagnostic criteria of MetS (see Table 3) Akinci et al /71 M C&C /5.6 NCEP ATP III Derbent et al /40 NA NDDG /7.5 NCEP ATP III Di Cianni et al /98 M C&C /1.0 NCEP ATP III Ijäs et al /55 M Finnish /30.9 NCEP ATP III guidelines Karoli et al /50 NA ADA or C&C mean 64/10 IDF GDM 4.6/ nongdm 4.5 Lauenborg et al /987 D Danish /14.8 NCEP ATP III quidelines Li et al / NA WHO / IDF Mai et al /80 NA ADA mean 20/0 NCEP ATP III GDM 2.5/ nongdm 2.6 Noctor et al /378 NA IADPSG mean 25.3/6.6 NCEP ATP III GDM 2.6/ nongdm 3.3 Puhkala et al / NA Finnish guidelines 1 16 (18)/ NCEP ATP III (IDF) Retnakaran et al /259 NA NDDG 3 months 19.7/10.0 IDF Tam et al /94 NA WHO /14.9 IDF Verma et al /51 NA C&C /8.2 NCEP ATP III Wijeyaratne et al /67 NA WHO /6 IDF ADA: American Diabetes Association; C&C: Carpenter & Coustan; D: diet only; GDM: gestational diabetes mellitus; IADPSG: International Association of the Diabetes and Pregnancy Study Groups; IDF: International Diabetes Federation; M: GDM cohort also includes medicated subjects; MetS: metabolic syndrome; NA: not available; NCEP ATP III: National Cholesterol Education Program Adult Treatment Panel III; NDDG: National Diabetes Data Group; WHO: World Health Organization Recently, Xu et al. (2014) reported a meta-analysis (17 studies) demonstrating evidence of an increased risk of MetS after previous GDM. The odds ratio (OR) for MetS after GDM compared with normoglycemic pregnancy in BMI-matched groups was 2.53 (95% CI ) (Y. Xu et al. 2014). Lauenborg et al. (2005) observed that obese women (BMI > 30 kg/m 2 ) with previous GDM treated with diet only had a more than sevenfold higher prevalence of MetS when compared with normal-weight women after GDM (BMI < 25 kg/m 2 ). Xu et al. (2014) also noticed that mothers with higher BMI had an elevated risk of MetS after GDM. Additionally, on average nineteen years after index pregnancies, Ijäs et al. (2013) 29
32 reported that pre-pregnancy overweight was the most powerful predictive component as regards developing MetS later in life. However, the risk of MetS was highest when both GDM and pre-pregnancy overweight were present (Ijäs et al. 2013). There is also evidence for an increased prevalence of MetS even among women who were normoglycemic when tested ten years after GDM, compared with controls (Lauenborg et al. 2005) Cardiovascular disease In women, atherosclerotic cardiovascular disease (CVD) remains the leading cause of death (S. K. Lee et al. 2017). While the association between GDM and T2DM is obvious, the link between GDM and CVD is more uncertain. Because of the time lag, typically two or three decades between GDM diagnosis and CVD events, epidemiological studies on the association are difficult to conduct. Further, such studies are greatly limited by the manner of ascertainment of GDM; universal screening and strategies for GDM are still missing (Kim. 2010a). However, the results of several studies suggest that GDM is an independent risk factor of CVD later in life (Fadl et al. 2014, Goueslard et al. 2016, Gunderson et al. 2014, Karoli et al. 2015, Lekva et al. 2017, Retnakaran & Shah. 2017), while other studies report that the raised prevalence of CVD risk is evident only in women who develop T2DM or abnormal glucose tolerance after GDM (Henry & Beischer. 1991, Kerenyi et al. 1999, Shah et al. 2008). A review of four studies (n = ) concerned the long-term risk of CVD when the time of follow-up ranged from 1.2 to 74.0 years. The risk of CVD among women with prior GDM varied between 0.28% and 15.5% (Hopmans et al. 2015). In a recent study on a population of 8127 North American women, CVD was diagnosed on average 22.9 years after a diagnosis of GDM. When multivariableadjusted for socioeconomic, demographic, and lifestyle components including smoking habits, previous GDM was associated with 63% higher odds of CVD (OR 1.63; 95% CI ; p = 0.04). However, the association became nonsignificant after additional adjustment for BMI (Shostrom et al. 2017). In a prospective cohort of 3416 women, GDM independently raised the risk of CVD (OR 1.26; 95% CI ) (Fraser et al. 2012). Shah et al. (2008) found that women with previous GDM had a 70% increased incidence of CVD compared with women with earlier normoglycemic pregnancy, within just 11 years after the index pregnancy (Shah et al. 2008). Recently, within seven years postpartum, previous GDM was identified as an independent risk factor of CVD by Goueslard et al. They studied a database 30
33 of more than 1.5 million deliveries and found that the incidence of myocardial infarction was 0.04% in women with a previous diagnosis of GDM and 0.02% without (Goueslard et al. 2016). Further, Retnakaran and Shah (2017) reported a retrospective study of over 1.5 million women. Although the absolute rates of CVD events were very low, they noticed that women with a history of GDM had a higher risk of CVD events even in the absence of diabetes, but microvascular risk, including retinal and renal complications, emerged only in those women in whom T2DM developed (Retnakaran & Shah. 2017). Mechanisms that contribute to a risk of CVD in women with previous GDM are mostly still uncertain. The fact that the risks of MetS and T2DM are increased after previous GDM naturally also contributes to the risk of CVD. Besides the chronic insulin resistance, β-cell failure and dyslipidemia, endothelial dysfunction is believed to be an important factor in the development of atherosclerosis after pregnancy complicated by GDM (Di Cianni et al. 2010, Landmesser et al. 2004). CVD risk postpartum seems to be potentiated by increased inflammatory markers among GDM women (Poola-Kella et al. 2017). There is also some evidence that adipokine imbalance in the presence of metabolic dysfunction may be a key event in promoting CVD (Lekva et al. 2017). Especially when combined with GDM, prepregnancy overweight has been shown to be an essential risk factor not only for subsequent diabetes, but also hypertension, which is a well-known traditional risk factor of CVD (Pirkola et al. 2010). In contrast, Gunderson et al. (2014) concluded that a history of GDM may be a marker of early atherosclerosis independent of pre-pregnancy obesity among women who have not developed T2DM or MetS (Gunderson et al. 2014). Historically, medical trials on CVD prevention have been focused on men, and consequently there has been decreased awareness of the burden of CVD in women until recently. According to an interview survey, awareness of CVD risk increased among randomly selected women in the USA between 1997 and 2006 from 30% to 57%, but plateaued in 2009 (Mosca et al. 2010). Current literature shows that women with previous GDM have an increased risk of developing CVD later in life. At least in the absence of other recognized CVD risk factors, such as smoking, obesity and chronic hypertension, GDM is a useful marker of increased CVD risk (Fadl et al. 2014). It is very important that in daily practice GDM is recognized as a CVD risk factor unique to women. 31
34 2.1.4 Implications for clinical care On a global basis, approximately 20 to 50% of people with T2DM remain undiagnosed. Early detection of T2DM is important, especially since treatment is proportionally economical and effective compared with treatment of later disease when management tends to be more complicated (International Diabetes Federation. 2011, Tong et al. 2008, Waugh et al. 2013). Knowing that women with GDM are at an increased risk of T2DM, the main focus of clinical practice should be on diminishing the risk of diabetes after pregnancy among these women. In addition, health care professionals should concentrate on detecting and treating diabetes that does develop. In the immediate postpartum period, determination of fasting glucose will identify women with impaired fasting glucose (IFG) in the diabetic range (Buchanan & Xiang. 2005). Moreover, all women should undergo OGTT screening at six weeks or later postpartum and, if screen-negative, have frequent testing for T2DM for rest of their lives (Gestational diabetes. Current Care Guidelines. 2013, Metzger et al. 2007). OGTT screening every three years seems to result in the lowest cost per case of detected diabetes (Kim et al. 2007) Women with prior GDM are also at increased risk of recurrence of GDM in future pregnancy (Kim et al. 2002, Kim et al. 2007), so family planning is crucial to reduce the occurrence of unplanned pregnancies in the presence of glucose intolerance (Kjos et al. 1998). The increased proportion of preexisting diabetes, particularly among younger women early in their reproductive years, should also be of concern (Lawrence et al. 2008). Maternal hyperglycemia antedating pregnancy has implications for both maternal and infant health. If the presence of poor glucose control continues into the period of organogenesis, i.e. at 5 8 gestational weeks, women with preexisting diabetes expose their fetuses to a higher risk of congenital malformations and other complications (Lawrence et al. 2008). Achieving a normal body weight is crucially essential to all GDM mothers after delivery (Gestational diabetes. Current Care Guidelines. 2013). Not surprisingly, the presence of both high maternal weight and GDM contribute to the risk of developing T2DM (Kaul et al. 2015). Consequently, women with both pregestational overweight or obesity and previous GDM require even more weight control after delivery. It has been suggested that pre-pregnancy weight and gestational weight gain are positively associated with women s long-term cardiometabolic risks, including MetS, T2DM and CVD (Fraser et al. 2011, Liu et al. 2014, Willett et al. 1995). Hence, interventions that concentrate on reducing overweight and obesity should also be the focus of future public health care. This 32
35 would prevent or delay the onset of T2DM, and the risks of CVD or MetS in all women (Lawrence et al. 2008). Early postpartum lifestyle intervention should be taken to reduce the likelihood of postpartum weight gain and subsequent adverse cardiometabolic consequences (Li et al. 2015). More effective public-health interventions aimed at prevention of T2DM are required, as well as enhanced resources to take care of the massive amount of individuals living longer with the disease (Lipscombe & Hux. 2007). Both epidemiological studies and clinical trials have revealed that the onset of T2DM in individuals at high risk can be delayed or even be prevented through lifestyle modifications such as diet and exercise, or pharmacological intervention including metformin, thus improving insulin sensitivity (Ben-Haroush et al. 2004, DeFronzo & Abdul-Ghani. 2011, Knowler et al. 2002, X. R. Pan et al. 1997, H. Tuomilehto et al. 2009, J. Tuomilehto et al. 2001). For example, after an average follow-up period of 2.8 years, metformin reduced the incidence of diabetes by 31% among subjects with impaired glucose tolerance (IGT) compared with placebo. In addition, the effect was even greater in those who were more obese, had higher fasting glucose or a history of GDM (Aroda et al. 2017). Further, metformin treatment for diabetes prevention has been estimated to be cost-saving (Aroda et al. 2017). In particular, targeting women with elevated levels of fasting glucose during pregnancy may have a considerable influence (Kim et al. 2002). Lifestyle interventions among the IGT population leading to at least a 5% reduction in weight have appeared to decrease the risk of T2DM by 58%, which is even more than treatment with metformin (Lindström et al. 2003). However, the changes in living may be hard to maintain. GDM uncovers a β-cell defect persisting after pregnancy and typically becoming worse over time, increasing the risk of T2DM in the future. Further, coexisting obesity and incremental weight gain are additive elements as regards development to T2DM. Health care professionals including obstetricians play an important part in informing women with GDM about their lifelong risk of T2DM. In addition, primary health care should manage better in encouraging GDM women to participate in recommended screening and long-term follow-up after delivery (Durnwald. 2015). Although the importance of postpartum OGTT screening after GDM is known, rates of participation are alarmingly low, varying worldwide between 14 and 61 percent (Clark et al. 2009, Shea et al. 2011). Moreover, because GDM women, even before development of diabetes have significant differences in CVD risk factors, postpartum screening should not only be concentrated on glucose intolerance, but efforts should also be made to 33
36 minimize modifiable CVD risk factors, including hypertension, visceral adiposity, and dyslipidemia (Karoli et al. 2015). 2.2 Metabolic syndrome and obesity Metabolic syndrome (MetS) is a term used to cover a cluster of metabolic and CVD risk factors including central adiposity, elevated BP, and abnormal lipid and glucose metabolism. Globally, MetS affects approximately one quarter of the adult population, women being influenced more often than men (Aguilar et al. 2015, Hess et al. 2017, International Diabetes Federation. 2006, Kaur. 2014, Mottillo et al. 2010, Shin et al. 2013). Among the MetS population, when compared with healthy controls, the chance of developing CVD is estimated to be six to eight times higher, and that of mortality related to CVD two to three times higher, the latter particularly among women (Gami et al. 2007, Haffner et al. 1998, Lakka et al. 2002, Sattar et al. 2003, Vanhala et al. 1997). Moreover, according to Hess et al. (2017), MetS is independently associated with a 70% increase in the risk of sudden cardiac death. Race or gender did not influence this association, which actually was even greater when the number of MetS components became larger. In particular, elevated BP, impaired fp-gluc and low HDL-C drove this observed increased risk of sudden cardiac death (Hess et al. 2017). Furthermore, the longer the duration of MetS, the greater the risk of both DM and CVD (H. Hu et al. 2017, Ohnishi et al. 2016). Despite the above-mentioned research data, the clinical definition of MetS has sometimes been an issue of considerable debate (Balkau et al. 2002, Bauduceau et al. 2007, Borch-Johnsen & Wareham. 2010, Kahn et al. 2005, Mente et al. 2010, Simmons et al. 2010, Woodward & Tunstall-Pedoe. 2009). Central obesity is one of the cardinal components of MetS. Generally, obesity means an excess of adipose tissue, and it can be assessed by body mass index (BMI) or waist circumference (WC) (Obesity (adult). Current Care Guidelines. 2013, Report of a WHO consultation. 2000). Obesity is related to endothelial dysfunction. Further, high BMI is correlated to a complicated interaction of inflammatory and metabolic features, and associated with a range of long-term disorders, disability, and decreased longevity (Berrington de Gonzalez et al. 2010, Fruhbeck et al. 2013, Global BMI Mortality et al. 2016, Meyers & Gokce. 2007). Research data have revealed that obesity raises the risk of both metabolic and cardiovascular (CV) diseases (Kopelman. 2000). In particular, visceral fat in comparison with subcutaneous fat is a more critical determining factor of CVD 34
37 risk and vascular structural modification (Lefferts et al. 2017). In clinical practice, measuring WC offers additional value to measuring BMI only (Tchernof & Despres. 2013) Definitions and prevalence of metabolic syndrome A number of organizations, including the WHO and the National Cholesterol Education Program (NCEP), have proposed somewhat different definitions of MetS. Regardless of which definition is used, the presence of MetS is believed to increase the risk of CVD at any concentration of LDL-C (Fruchart et al. 2004). MetS definitions for women according to WHO (Alberti & Zimmet. 1998), NCEP (Third report of the National Cholesterol Education Program 2001) and IDF (International Diabetes Federation. 2006) recommendations are presented in Table 3. Table 3. MetS definitions for women according to WHO, NCEP ATP III and IDF recommendations. Clinical measures WHO (1998) NCEP ATP III (2001) IDF (2005) Central obesity waist-to-hip ratio > 0.85 WC 88 cm Increased (populationspecific) and/or BMI > 30 kg/m 2 WC fp-gluc, mmol/l IGT, IFG or T2DM 6.1 or diabetes 5.6 or diabetes BP, mmhg 140/90 130/85 130/85 or treatment for hypertension TGs, mmol/l or treatment for this lipid abnormality HDL-C, mmol/l 1.0 < 1.3 < 1.3 or treatment for this lipid abnormality Other Microalbuminuria Definition IGT, IFG, T2DM, or lowered insulin sensitivity + any 2 of the components any 3 of the components Increased WC + any 2 of the components BP: blood pressure; fp-gluc: fasting plasma glucose; IDF: International Diabetes Federation; IFG: impaired fasting glucose; IGT: impaired glucose tolerance; HDL-C: high-density lipoprotein cholesterol; MetS: metabolic syndrome; NCEP ATP III: National Cholesterol Education Program Adult Treatment Panel III; TGs: triglycerides; T2DM: type 2 diabetes mellitus; WC: waist circumference; WHO: World Health Organization In recent decades, the prevalence of MetS has rapidly increased in parallel with sedentary lifestyles (Y. Xu et al. 2014). Nowadays, MetS is a major health problem affecting about 25% of the adult population worldwide (Kaur. 2014). Although 35
38 globally MetS affects women more often than men, MetS was present in about 22% of the women and 39% of the men in the middle-aged FINRISK cohort in 2004 (Ilanne-Parikka et al. 2004). The prevalence of MetS is almost double according to the IDF classification vs. that of the NCEP ATP III, because of the stricter values of fp-gluc and abdominal obesity in the former. However, the NCEP ATP III classification better identifies the presence of insulin resistance (IR) than that of the IDF (Castro Dufourny et al. 2009) Classification and prevalence of obesity Body mass index is commonly used to classify both under- and overweight conditions and obesity in adults. It is defined as the weight in kilograms divided by the square of the height in meters (kg/m 2 ) (Report of a WHO consultation. 2000). Classification of overweight and obesity according to BMI is set out in Table 4 (Report of a WHO consultation. 2000). The classification is in agreement with that suggested by the WHO earlier (Report of a WHO Expert Committee. 1995), and is based primarily on the association between BMI and mortality (Report of a WHO consultation. 2000). Briefly, individuals having a BMI of at least 25 and under 30 kg/m 2 are overweight, and those having a BMI over 30 kg/m 2 are obese. Further, waist circumference (WC) is practical in clinical use when estimating central obesity. WC over 100 centimeters in men and over 90 cm in women increases the risk of death and comorbidity (Obesity (adult). Current Care Guidelines. 2013). Table 4. Classification of overweight and obesity in adults according to BMI. Classification BMI (kg/m 2 ) Risk of comorbidity Normal Average Overweight 25.0 pre-obese Increased obese grade I Moderate obese grade II Severe obese grade III 40.0 Very severe According to Non-Communicable Diseases (NCD) Risk Factor Collaboration (2016), the global prevalence of obesity varies from 11% to 15% (NCD Risk Factor Collaboration (NCD-RisC). 2016). In contrast, according to the WHO, obesity is observed in 30% of the world population (WHO. 2015). In developed 36
39 countries, the prevalence of overweight and obesity is high and still increasing; the proportion of overweight women increased from 30% in 1980 to 38% in 2013 (Flegal et al. 2012, Ng et al. 2014). In the USA in , among women between 20 to 39 years of age 55.8% (95% CI ) were overweight or obese (Flegal et al. 2012). According to the FINRISK 2012 study, over a half of the adult population are overweight and every fifth adult is obese in Finland. The prevalence of obesity among Finnish women was 20%, and that of an overweight condition 46% in 2012 (Borodulin et al. 2014) Challenges of obesity in health care Aging is associated with a decrease in resting metabolic rate; a decline in basal metabolism with age can be 1 2% per decade (Keys et al. 1973, Valiani et al. 2017). Therefore, weight usually increases with age, culminating in middle age (Peltonen et al. 2008). The prevalence of obesity has risen among Finnish men since the 1970s and among women since the 1980s. The fundamental cause of obesity is an energy imbalance between calories consumed and expended. Globally, there has been an increased intake of energy-dense food and a decrease in physical activity due to the increasingly sedentary nature of many forms of work, changing modes of transportation and increasing urbanization (Hruby & Hu. 2015, WHO. 2013b). The growing prevalence of obesity seems to have plateaued during the last decade. In Finland, there is less obesity among adults living near the region of the capital, and in those areas with higher education (Borodulin et al. 2014, Peltonen et al. 2008). An overload of adipose tissue increases an individual s risk of several comorbidities such as T2DM, CV and metabolic diseases, osteoarthritis, gout, asthma, sleep apnea, liver and renal diseases, depression, dementia and several types of cancer (Guh et al. 2009, Kivimäki et al. 2017, Obesity (adult). Current Care Guidelines. 2013). Treatment of obesity should be provided in primary health care. The aim is to prevent comorbidities of obesity through at least a stable 5% reduction in weight, which seems to decrease the risk of T2DM by 58% (Lindström et al. 2003). The main element in therapy is lifestyle counseling on diet and physical activity. Lifestyle changes are supported with very-low-energy diets and medication, such as orlistat. If appropriate conservative treatments do not lead to sufficient weight loss, bariatric surgery is indicated in cases of morbid obesity (Obesity (adult). Current Care Guidelines. 2013). In Finland, obesity and its comorbidities represent a huge 37
40 financial burden in public health care. The Finnish National Institute for Health and Welfare has estimated that 1.4 7% of all the expenses of public health care result from obesity. In 2011, obesity and its comorbidities cost approximately 330 million euros (Finnish National Institute for Health and Welfare. 2015). Because of the health risks and significant increase in prevalence worldwide in recent decades, obesity has also become a major global health challenge. In contrast to other major global risks, there is little evidence of successful population-level intervention strategies to reduce the increasing incidence (Ng et al. 2014). For example, there is an ongoing global prevention program, incorporated into the WHO s strategy, targeted at a 25% decrease in mortality caused by obesity by Despite this worldwide strategy, the population mean for BMI has continued to increase, with a minor sign of plateauing (Kivimäki et al. 2017, NCD Risk Factor Collaboration (NCD-RisC). 2016, Pearce et al. 2014, WHO. 2013b). In contrast, long-term follow-up in the randomized Finnish Diabetes Prevention Study (DPS) revealed that lifestyle intervention among individuals at a high risk of T2DM induces a more permanent lifestyle change, resulting in longterm prevention of progression to T2DM (Lindström et al. 2013). In addition, bariatric surgery using the gastric bypass technique is an effective treatment for severe obesity, with long-term durability of weight loss, remission and prevention of comorbidities, and an improved quality of life (Adams et al. 2017, Nguyen et al. 2017). Further, a randomized controlled trial exposed the positive effect of a weight-management program delivered by social media on weight and risk features of MetS among overweight and obese adults. The participants in the Facebook Group reported a 4.8% reduction in initial weight after 24 weeks of follow-up when compared with a control group (Jane et al. 2017). However, like many other trials on obesity management, this study is too short to allow conclusions on possible long-term benefit. In conclusion, obesity impairs the health of people and results in enormous financial costs, and, furthermore, it decreases working ability and the quality of life among the affected population. Since over 50% of the Finnish adult population are at least overweight (Borodulin et al. 2014), the prevention of obesity is a great challenge in public health. Increasing rates of overweight and obesity both in childhood and among adolescents should also be of concern, because overweight and obesity in childhood is usually maintained in adulthood (A. S. Singh et al. 2008). 38
.")
41 2.3 The atherosclerotic process Atherosclerosis is a chronic process that begins at an early age and is progressive in nature, leading to the development of both CV and cerebrovascular diseases (Furie & Mitchell. 2012, C. J. Lee & Park. 2014, Rocha & Libby. 2009). Atherosclerotic lesions are not associated with any symptoms at an early stage, but their initial presentation may result in catastrophic CVD events such as myocardial infarction and stroke resulting from plaque rupture and thrombosis (Giroud et al. 1992, Schroeder & Falk. 1995). The clinical manifestations of atherosclerotic disease depend on the site of the plaque (Dwivedi et al. 2018, R. B. Singh et al. 2002). Atherosclerotic plaque formation is illustrated in Figure 2 and it involves: 1) lowdensity lipoprotein (LDL) accumulation in the intima; 2) oxidation of LDL; 3) recruitment of circulating monocyte-derived macrophages; 4) uptake of oxidized LDL (oxldl) by macrophage scavenger receptors, and transformation of macrophages into foam cells; and 5) formation of a fibrous cap containing smooth muscle cells, which permits stabilization of the plaque (Tedgui & Mallat. 1999). Buildup of plaques narrows the lumen of arteries, restricting blood flow to organs and tissues, leading to ischemia (Schroeder & Falk. 1995). Figure 2. Process of atherosclerotic plaque formation. LDL: low-density lipoprotein; MMP: matrix metalloproteinase; oxldl: oxidized low-density lipoprotein; ROS: reactive oxygen species; SMC: smooth muscle cell 39
42 Nowadays, there is evidence that chronic inflammation and increased oxidative stress are important elements of atherosclerosis (Feng et al. 2011, Kattoor et al. 2017, Stocker & Keaney. 2004). Oxidative stress means imbalance in favor of increased generation of reactive oxygen species (ROS) and/or reduced native antioxidant defense systems of the body (Peluso et al. 2012). Reactive oxygen species play an essential role in inflammatory responses, cell growth, and apoptosis. Locally, the role of ROS is crucial when altering vascular tone as well as initiating oxidation of LDL (Figure 2). Oxidized LDL is considered more important in atherogenesis than innate LDL (Zhang & Gutterman. 2007). In addition, the process of intimal calcification has long been associated with coronary atherosclerosis (Dwivedi et al. 2018) Low-density lipoprotein particles in the arterial wall In humans, the first visible lesion of atherosclerosis is called the foam cell. These foam cells are primarily derived from arterial-wall macrophages with accumulated lipoproteins, particularly low-density lipoproteins (LDLs) (Steinberg. 2009). Circulating monocyte-derived macrophages cannot take up native LDL rapidly enough to cause lipid loading (Goldstein et al. 1979). However, a high plasma concentration of LDL increases the transportation of LDL particles in the intimae of arterial walls. In the intimae of arteries, in other words in the subendothelial space, LDL may undergo oxidative modification. Oxidized LDL is considered to be atherogenic, and this oxidation process represents one of the first steps of the atherosclerotic process (Bowie et al. 1993, Steinberg. 1988, Stocker & Keaney. 2004). Smooth muscle cells and endothelial cells in lesions can also load lipid droplets, but foamy macrophage formation predominates (Steinberg. 2009). Besides oxidative modification, LDL particles may also undergo glycosylation, which consequently increases their susceptibility to oxidation. Thus, glycosylation of LDL partly explains the increased incidence of atherosclerosis in individuals with DM (Bowie et al. 1993). Reverse cholesterol transport is a pathway defined as the transportation of accumulated cholesterol from the vessel wall to the liver for excretion, thus preventing atherosclerosis. Major components of reverse cholesterol transport include acceptors such as high-density lipoprotein (HDL) and apolipoprotein A-I, and enzymes such as lecithin cholesterol acyl transferase (Ohashi et al. 2005, Small. 1988). The protective effects of HDL are mediated by cell-surface HDL receptors, 40
43 and HDL may function as an acceptor, transporter and inactivator of oxldls (R. B. Singh et al. 2002) Risk factors of atherosclerosis Atherosclerosis is a multifactorial disease involving the interplay of genetic and environmental factors (R. B. Singh et al. 2002). In accordance with the fact that oxidative stress and inflammation are important features in the development of atherosclerosis, the risk factors are commonly associated with excess production of reactive oxygen species and oxidation of LDL in the vessel wall (Förstermann et al. 2017). In the general population, the impact of traditional risk factors such as age, sex, family history, obesity, hypertension, smoking, high levels of LDL cholesterol (LDL-C), and low levels of HDL cholesterol (HDL-C) on CVD has long been established beyond any doubt (Faxon et al. 2004, Fruchart et al. 2004). Further, several studies have shown that raised levels of triglycerides (TGs) are associated with increased CVD risk (Yarnell et al. 2001). Additionally, many novel risk factors of the atherosclerotic process have been recognized in recent decades. It is important to identify individuals at a raised risk of CVD, and consequently, modify their risk factors early on. Also, the treatment of advanced atherosclerosis is less effective than inhibition of atherosclerosis progression (Insull. 2009) Traditional risk factors Conventional CVD risk factors include age, male gender, high concentrations of LDL-C, elevated blood pressure, smoking, and further, family history, obesity, physical inactivity and a high-fat diet (Bertoluci & Rocha. 2017, Faxon et al. 2004, Fruchart et al. 2004, Martin-Timon et al. 2014, Vogel. 1997). Age is the most powerful non-modifiable risk element of CVD. Gender aside, growth in CVD risk with the level of each risk factor is continuous and progressive (Bertoluci & Rocha. 2017). In general, the age-adjusted incidence of a new myocardial infarction is higher in men than in women, with a hazard ratio (HR) of 2.56 (95% CI ) (Booth et al. 2006). In individuals with DM, the difference between genders is narrower, but still higher in men. However, women with DM seem to have a greater relative risk than diabetic men when considering the rate of mortality from coronary causes (Haffner et al. 1998, Huxley et al. 2006). In a meta-analysis of 37 prospective cohort studies, the rate of fatal coronary heart disease was substantially 41
44 higher in people with diabetes than in those without (5.4% vs. 1.6%). This difference was even more apparent among women with and without DM (7.7% vs. 1.2%) than among men with and without DM (4.5% vs. 2.0%) (Huxley et al. 2006). In addition, a family history of CVD, generalized obesity determined by BMI and abdominal obesity assessed by waist circumference (WC) as well as a high-fat diet are associated with a higher risk of CVD (Martin-Timon et al. 2014, Pandey et al. 2013, Vogel. 1997, Weir. 2007). On the other hand, regular physical exercise has long been correlated with a lower risk of CVD morbidity and mortality, and there may simultaneously be other positive aspects of a lifestyle including regular physical activity (Powell et al. 1987, Shephard & Balady. 1999). Hypercholesterolemia means elevated levels of cholesterol in the blood, which can be a result of either monogenic (such as familial hypercholesterolemia) or polygenic inheritance, or environmental factors (Taylor et al. 2017). Hypercholesterolemia is a strong and independent risk factor of CVD mortality, which is potentiated by diabetes. Further, LDL-C is one of the most important reversible risk components of CVD morbidity and mortality (Stamler et al. 1993). When reducing levels of LDL-C by 1 mmol/l via statin therapy, the RR of CVD will decrease by 20% (Cholesterol Treatment Trialists (CTT) Collaborators et al. 2008). This phenomenon is linear and it is likely to occur similarly at any level of baseline LDL-C, at least down to 1.3 mmol/l. In individuals with DM, per each mmol/l of reduction in concentrations of LDL-C, statin therapy brings about a relative reduction of 9% in total mortality (p = 0.02) and a 21% reduction in the incidence of major CVD events (p < ) such as acute myocardial infarction (AMI) and stroke. In addition, there are also significant changes in coronary revascularization (Cholesterol Treatment Trialists (CTT) Collaborators et al. 2008). Cigarette smoking is one of the most important reversible risk factors of CVD. Compared with women who have never smoked, the incidence of AMI is raised sixfold in women who smoke at least 20 cigarettes per day (Njolstad et al. 1996). In a meta-analysis of 46 studies, including approximately patients with DM, the RR of smokers compared with nonsmokers was 1.48 (95% CI ) for total mortality, 1.36 (95% CI ) for CVD mortality, 1.54 (95% CI ) for CVD events, 1.44 (95% CI ) for stroke and 1.52 (95% CI ) for AMI (Qin et al. 2013). Among diabetic individuals, active smoking is correlated with the greatest risk of total mortality and CVD events, whereas finishing smoking is associated with a decreased risk in both. A large meta-analysis of 89 cohorts was carried out to evaluate the effect of active smoking on mortality. Comparing participants who were active smokers with former smokers and those 42
45 who had never smoked, active smoking was associated with more than 50% growth in mortality and CVD events in comparison with nonsmokers. However, former smokers were at a higher risk of mortality and CVD events than individuals who had never smoked. Among patients with DM, there is a crucial advantage in stopping smoking, but a major remnant risk, which seems to be proportional to the exposed time of smoking, indicating that smoking should be stopped as early as possible (A. Pan et al. 2015). Hypertension, i.e. elevated blood pressure (BP), affects all parts of the CV system and is a well-verified risk element of CVD (Koller. 2002). At all ages, isolated systolic hypertension is an important CVD risk factor, both in women and men (James et al. 2014). In the Framingham study, diastolic BP was the most powerful predictor of CVD risk in individuals of less than 50 years of age. In patients aged between 50 and 59 years, all parameters of BP were prognostic for CVD, whereas in those more than 60 years old, pulse pressure (PP) had the strongest prognostic value (Lloyd-Jones et al. 1999). In both T1DM and T2DM, hypertension is a remarkable risk component as regards microvascular complications and atherosclerotic CVD events. In T1DM, hypertension is commonly the result of underlying diabetic kidney disease, while in T2DM, it usually coexists with other cardiometabolic risk elements (American Diabetes Association. 2016). In a recent review of 40 studies, including over one hundred thousand adults with T2DM, lowering of systolic BP was evaluated. Research data revealed that for each 10 mmhg drop in systolic BP there were significant decreases in the risks of many outcomes such as: mortality (RR: 0.87; 95% CI ), CVD events (RR: 0.89; 95% CI ), coronary heart disease (RR: 0.88; 95% CI ) and stroke (RR: 0.73; 95% CI ) (Emdin et al. 2015). In 2016, the American Diabetes Association (ADA) recommended a goal of 140 mmhg for systolic BP and 90 mmhg for diastolic BP when treating people with DM and hypertension (American Diabetes Association. 2016). In Finland, BP under 140/80 mmhg is a target for diabetic individuals (Diabetes. Current Care Guidelines. 2018). Evidently, classic CVD risk factors such as a high serum cholesterol level, cigarette smoking, and elevated BP are significant predictors of CVD mortality. Further, these three major risk factors have been shown to have an additive influence on CVD mortality. In a cohort of over men, age-adjusted CVD death rates progressively increased with an increasing number of these three major risk factors. The relative risk of CVD death was 2.0 for non-diabetic men with any one factor only, 3.7 for those with any two only, and 7.9 for those with all three 43
46 risk factors present. Moreover, the presence of risk factors, separately or in combination, was associated with an even more progressive increase in CVD mortality among diabetic vs. non-diabetic men (Stamler et al. 1993) Insulin resistance Insulin maintains euglycemia via transporting glucose from the circulation into the muscles and other tissues (Dongerkery et al. 2017). Additionally, insulin pushes glucose conversion into glycogen in the liver and skeletal muscle, promotes accumulation of TGs in adipose tissue, and downregulates significant gluconeogenic enzymes in the liver (Choi et al. 2010). Dysregulation of insulin signaling may result in IR, where the ability of cells to respond to the action of insulin is diminished, leading the pancreas to synthesize more insulin. As long as anyone can produce enough insulin to overcome IR, plasma glucose levels remain normal. Once the pancreas is no longer able to keep up, levels of plasma glucose begin to rise. IR is the earliest feature in the pathogenesis of T2DM and it develops in multiple organs including skeletal muscle, liver, adipose tissue and the heart (Stafeev et al. 2017). Hyperinsulinemia, as a result of IR, occurs before diagnosis of T2DM (Mitsuhashi et al. 2011, Muntoni et al. 2008, Pyörälä. 1979, Stout. 1990). Further, IR and arterial stiffness are interrelated, leading to increased CVD morbidity and mortality (Westerbacka & Yki-Järvinen. 2002). The onset of hyperglycemia and DM is generally antedated by many years of IR. Insulin favors abdominal obesity, which actually plays an important part in IR (Bhatia et al. 2012, Dongerkery et al. 2017). Further, this phenomenon provides an important link between T2DM and the accumulation of fat (Bhatia et al. 2012). Consequently, a negative vicious circle is completed when a major proportion of individuals with T2DM are obese (Hossain et al. 2007). There are several methods to measure IR. At present, the hyperinsulinemic euglycemic clamp remains a gold standard for accurately determining IR, but due to the invasive and time-consuming technique, it is not implemented on a routine basis (DeFronzo et al. 1979, Gutch et al. 2015, Park et al. 2015). Therefore, some more simple methods have been validated for clinical practice. For example, the quantitative insulin sensitivity check index (QUICKI) and homeostasis model assessment of insulin resistance (HOMA-IR) are suitable for clinical use (Gutch et al. 2015). The latter, HOMA-IR, was first developed in 1985 by Matthews et al., and for now, it has proved to be a robust clinical and epidemiological tool for the assessment of IR (Antuna-Puente et al. 2011, Lann & LeRoith. 2007, D. R. 44
47 Matthews et al. 1985). HOMA-IR involves use of fasting plasma glucose (fp-gluc) and insulin (fp-insu) levels to quantify both IR and β-cell function. A final result is mathematically derived from use of the insulin-glucose product: fp-gluc fp- Insu, divided by 22.5 (D. R. Matthews et al. 1985) Dyslipidemias Lipoproteins are macromolecular complexes consisting of core lipids, which mainly are TG and cholesteryl esters, surface phospholipids, free cholesterol, and one or more apolipoproteins. Based on physical characteristics, molecular weight, diameter, and chemical composition, lipoproteins can be divided into five classes including chylomicrons, very low-density lipoproteins (VLDLs), intermediatedensity lipoproteins (IDLs), which may also be referred to as remnants of VLDL, LDL, and HDL (Ginsberg. 1998, Gotto et al. 1986). Dyslipidemias include disorders of lipoprotein metabolism leading to the overproduction of potentially atherogenic lipoproteins, LDL, VLDL and IDL. Furthermore, there may be a decrease in the levels of HDL and an increase in the levels of small dense LDL particles (Chang & Robidoux. 2017). Dyslipidemias, in particular hypercholesterolemia, are common clinical conditions (Sanin et al. 2017). In the general population, high levels of total cholesterol (TC), LDL-C, and TGs, and low levels of HDL-C represent all essential determinants of atherosclerotic CVD (Mikolasevic et al. 2017). In the artery wall, HDL acts as a protector against LDL oxidation, and therefore high levels of HDL-C have an inverse relationship as regards the risk of atherosclerotic clinical events (Berliner et al. 1995). Further, non- HDL-C is a strong and independent predictor of CVD. It is more strongly associated with subclinical atherosclerosis than all other conventional lipid values. Non-HDL-C is defined as TC minus HDL-C (Orakzai et al. 2009). Treatments to normalize dyslipidemias and reduce the risk of CVD events include both lifestyle modifications and medication (Khavandi et al. 2017). Reducing LDL-C has been the main therapeutic target to diminish the risk of CVD. Cholesterol-lowering types of medication, particularly statins, have been used to provide both primary and secondary prevention of CV conditions for many years (Sanin et al. 2017). Lately, lipid management has continued to evolve. Beyond maximum statin therapy among high-risk populations, ezetimibe further reduced LDL-C levels in cases of CVD (Khavandi et al. 2017). Further, LDL-C reduction may also be achieved by inhibition of the enzyme proprotein convertase subtilisin/kexin type-9 (PCSK9). Other treatments, more focused on TGs, are less 45
48 well supported by the results of randomized clinical trials and should be used on an individual basis. Up to now, trials aimed at pharmacologically increasing plasma HDL concentrations have failed to prevent CVD events. Some still-ongoing trials are focused more on HDL functionality and not just the absolute levels of HDL-C (Kampangkaew et al. 2017, Khavandi et al. 2017) Other non-traditional biomarkers of increased risk: oxidized low-density lipoprotein, high sensitivity C-reactive protein and matrix metalloproteinase-8 Atherosclerosis begins with accumulation of lipoproteins, particularly low-density lipoprotein, in the arterial wall, where they are then subjected to oxidative modifications (Stocker & Keaney. 2004). Oxidized low-density lipoprotein (oxldl) is a possible inflammatory molecule inducer and is considered to be the typical atherogenic form of LDL (Catapano et al. 2000, Steinberg. 2009). Circulating oxldl seems to reflect the level of local atherosclerotic oxidative stress (Sigurdardottir et al. 2002). Further, increased amounts of circulating oxldl are associated with the occurrence of coronary heart disease (Holvoet et al. 1998, Holvoet et al. 2001). There is also accumulating evidence that T2DM is associated with increased oxidative stress (Njajou et al. 2009, Odegaar et al. 2016). Oxidized LDL, when accumulating in the arterial wall, injures its endothelium, leading to endothelial dysfunction (Stocker & Keaney. 2004). Endothelial dysfunction leads to impaired arterial elasticity at an early stage in the atherosclerotic process (Cohn. 1999). Thus, both in the prevention of and therapeutic intervention in the atherosclerotic process, lowering concentrations of LDL-C and, consequently, inhibiting LDL oxidation have become an important focus (Parthasarathy et al. 1992, Ridker et al. 2009). Concurrently with accumulation of oxldl, inflammation may develop, which is a significant predictor of CVD complications (Faxon et al. 2004, Ridker et al. 2002). High-sensitivity C-reactive protein (hscrp) is a known acute-phase protein and a sensitive biomarker of chronic low-grade systemic inflammation. An elevated concentration of hscrp has been shown to be a strong risk factor as regards atherosclerosis, with an additive value in predicting CVD risk with extra atherothrombotic complications on top of traditional risk factors (Karadeniz et al. 2015, Ridker et al. 2002, van der Meer et al. 2002, Yamashita et al. 2003). Further, recent drug trials focusing on reduction of hscrp have shown that decreasing the levels of hscrp with rosuvastatin or canakinumab significantly reduced the incidence of major CVD events (Ridker et al. 2008, Ridker et al. 2017). The 46
49 pathogenicity of low-grade inflammation may also be mediated by inducing vascular dysfunction (Heitritter et al. 2005, Meigs et al. 2004). Table 5. The location of production and functions of hscrp, MMP-8, MMP-9 and TIMP-1 according to the literature (Brew & Nagase. 2010, Craig et al. 2015, Kamath et al. 2015, Kormi et al. 2017, Y. S. Lee et al. 2009, Pepys & Hirschfield. 2003). Variable of Synthesized mainly by Function low-grade inflammation hscrp hepatocytes Acute-phase reactant: elevated in response to acute infections, inflammatory conditions and trauma Predictive value in T2DM, MetS, increased MMP-8 MMP-9 TIMP-1 polymorphonuclear cells; at lower levels by lymphocytes, chondrocytes, lung epithelial, dendritic, mesenchymal stem, endothelial, smooth muscle and natural killer cells, fibroblasts, fibrocytes, activated monocytes and macrophages leukocytes, fibroblasts, macrophages, epithelial and endothelial cells cardiac myocytes, fibroblasts, endothelial and smooth-muscle cells, monocytes and macrophages carotid intima-media thickness, CVD Involved in wound healing and tissue remodeling during inflammation Capable of digesting extracellular matrix components Implicated in the pathogenesis of several chronic inflammatory diseases including cystic fibrosis, rheumatoid arthritis, periodontal disease, and chronic skin wounds Present within atherosclerotic lesions Degrades extracellular matrix proteins including gelatin, collagen, elastin, and laminin Modulates the activities of other proteases, growth factors, cytokines and chemokines through proteolytic cleavage Tissue destruction and remodeling, inflammation The most important endogenous inhibitor of MMPs Various biological activities including modulation of cell proliferation, cell migration and invasion, anti-angiogenesis, anti- and pro-apoptosis and synaptic plasticity Potential role in inflammatory response CVD: cardiovascular disease; hscrp: high sensitivity C-reactive protein; MetS: metabolic syndrome; MMP: matrix metalloproteinase; T2DM: type 2 diabetes mellitus; TIMP: tissue inhibitor of metalloproteinase The group of matrix metalloproteinases (MMPs) contains over 20 structurally and functionally involved but genetically distinct members (Lenglet et al. 2013, Sorsa et al. 2006). Normally, both expression and activity are low, but they are increased in several pathophysiological circumstances. MMPs can modulate immunological responses, and can be either defensive or destructive (Sorsa et al. 2006). Both upregulation and downregulation of MMP-8 and -9 have been 47
50 associated with many noninfectious as well as infectious inflammatory conditions (Lauhio, Salo et al. 1994, Lauhio, Konttinen et al. 1994, Lauhio et al. 1995, Lauhio, Saikku et al. 2011, Lauhio, Hastbäcka et al. 2011, Lauhio et al. 2016, Rautelin et al. 2009). MMPs have also been implicated in the formation of atherosclerosis and its progression in humans (Goncalves et al. 2009, Paim et al. 2013, Siasos et al. 2012). The major regulators of MMP activity are tissue inhibitors of matrix metalloproteinases (TIMPs), TIMP-1 being the most potent and well-studied of the four major endogenous inhibitors (Brew & Nagase. 2010). Circulating TIMP-1 has also been reported to be an independent predictor of CVD events and cardiac death (Cavusoglu et al. 2006, Lubos et al. 2006). The imbalance between MMP-8 and TIMP-1 may play a part in vulnerability of the atherosclerotic plaque to rupture, indicating an important role in CVD risk (Goncalves et al. 2009, Pussinen et al. 2013, Sorsa et al. 2011, Tuomainen et al. 2007). In summary, Table 5 illustrates the location of production and functions of hscrp, MMP-8, MMP-9 and TIMP Arterial dysfunction The endothelium once considered only a semipermeable barrier separating the lumen from the vessel wall has already long been recognized as an essential endocrine organ responsible for a variety of physiological processes crucial for vascular homeostasis (Vane et al. 1990, Vanhoutte. 1989). Endothelial cells not only transduce several physiological stimuli, but also produce numerous signaling molecules that exert both paracrine and autocrine effects. These include the regulation of vascular tone, luminal diameter and blood flow, hemostasis and thrombosis, inflammatory processes, vessel-wall interactions with both platelets and leukocytes, and control of vascular permeability, tissue growth and remodeling (Lane et al. 2006). The balance between vasoconstriction and vasodilatation is mostly controlled by the interaction between the vascular smooth muscle layer and endothelium-derived vasoactive mediators. As such, endothelial nitric oxide (NO) is a powerful vasodilator and one of the most significant controllers of vascular tone (Vane et al. 1990, Vanhoutte. 1989). Arterial endothelial dysfunction is a key, early, and potentially reversible step in the process of atherogenesis and is characterized by impaired NO bioavailability (Berliner et al. 1995, Healy. 1990, Ross. 1993). Dysfunction of endothelial cells causes impaired vasomotor responses to numerous neurohumoral stimuli which may lead to temporary myocardial ischemia, thrombosis, plaque rupture, and 48
51 myocardial infarction (Maseri et al. 1978). So far, many well-established conventional CVD risk components, such as hypercholesterolemia, smoking, hypertension, obesity, microalbuminuria, IR and T2DM have been associated with endothelial dysfunction (Anderson et al. 1995, Goodfellow et al. 1996, Koller. 2002, McVeigh et al. 1992, Monhart. 2011, Treasure et al. 1995, Westerbacka & Yki- Järvinen. 2002, I. L. Williams et al. 2002, S. B. Williams et al. 1996). The extent of endothelial dysfunction is related to the rate of progression of atherosclerosis and CVD events (Schächinger et al. 2000, Widlansky et al. 2003). Therefore, arterial endothelial function is of significance, not only in determining predisposition to atherosclerotic disease, but also in determining prognosis in clinically affected individuals (Lane et al. 2006). Both intima and media calcifications are associated with increased arterial stiffness, leading to higher rates of morbidity and mortality (Wilson et al. 2001), but they alter arterial functions by different mechanisms (Briet et al. 2012). Intima plaque calcification induces arterial dysfunction resulting from narrowing of the arterial lumen, with ischemia affecting the tissues and organs downstream (O'Rourke. 1995), which is common in atherosclerosis (London & Drueke. 1997). In turn, media calcification does not extend into the arterial lumen in its typical pure form, and it is associated with arterial-hardening arteriosclerosis (Guerin et al. 2000). The first consequence of mediasclerosis is increased systolic BP, resulting in elevated cardiac afterload and left ventricular hypertrophy. The second one is decreased diastolic BP and impaired coronary perfusion (O'Rourke. 1995). Apart from age, diabetes is one of the most common causes of medial vascular calcification (Tolle et al. 2015). Large elastic arteries, such as the aorta and pulmonary trunk, have thick, highly developed tunica media, of which elastic fibers are the dominant component. Vessel wall compliance is dependent on the status of two major proteins: collagen and elastin (Zieman et al. 2005). Normally, there is a tightly regulated balance between synthesis and degradation of these two proteins. Anomalies occur in this regulatory system such as that which accrues from inflammatory change, where collagen is overproduced and elastin synthesis is undermined (Johnson et al. 2001). Such asymmetry contributes to arterial stiffening. In addition, increased luminal pressure such as in hypertension also tends to favor collagen production at the expense of elastin (C. Xu et al. 2000). Generally, vascular stiffening occurs as a consequence of a complex interplay between several independent as well as interdependent factors. Figure 3 summarizes different mechanisms of arterial stiffening and locations in the arterial wall (Zieman et al. 2005). 49
.")
52 Endothelial status and large artery stiffness can be measured in numerous ways using invasive or noninvasive methods in the coronary and peripheral circulation (Lane et al. 2006, Laurent et al. 2006). When considering noninvasive techniques, arterial compliance can be measured by using a radial artery tonometer (Laurent et al. 2006, McVeigh et al. 2002). However, carotid to femoral pulse wave velocity (PWV) has arisen as the gold standard to quantify arterial dysfunction. Further, values of central blood pressure (cbp) provide even more information concerning wave reflections (Laurent et al. 2006). Figure 3. Different mechanisms of arterial stiffening and locations in the arterial wall according to Zieman et al. (2005). Further, perivascular fat related to abdominal obesity may independently increase arterial stiffness (Lim & Meigs. 2013). AGE: advanced glycation end-product; MMP: matrix metalloproteinase; NaCl: sodium chloride; VSMC: vessel smooth-muscle cell Arterial compliance Systemic arterial compliance can be assessed noninvasively by using radial artery pulse wave analysis (Laurent et al. 2006, Nichols. 2005). The methodology gives measures of proximal capacitive compliance of large arteries (C1), including the aorta, and distal oscillatory compliance, which concerns endothelial function of the microvascular circulation or small arteries (C2) (Cohn. 1999, Laurent et al. 2006). This technique involves use of a modified Windkessel pulse-contour method, in 50
53 which the arterial system is likened to a fire-hose system: an air-filled dome, which softens flow pulsations generated by an occasionally working pump, is compared to the large arteries, the wide-bore hose acting as a pipeline, and the fire-hose nozzle is assimilated with the peripheral arterioles (Cohn et al. 1995, Nichols & O Rourke. 2005, Nichols & McDonald. 1972). In practice, the equipment automatically records arterial pulse waves at the level of the radial artery and identifies the reflections in diastole as a decaying sinusoidal wave (Cohn et al. 1995, Finkelstein et al. 1988, McVeigh et al. 1999, McVeigh. 2003). The higher the arterial compliance, the more elastic the wall of the vessel is considered to be. Further, when there is a reduction in compliance, mean BP usually increases. However, due to higher pressure oscillations, there seems to be a disproportionate increase in systolic BP and only a minor change in diastolic BP (Nichols & McDonald. 1972). By relying on numerous theoretical estimations following direct measurement of one peripheral and yet often distal parameter, there are some practical and technical limitations in the clinical use of arterial compliance. Decreased values of arterial compliance indices have been observed to be associated with MetS (Ge et al. 2008) and increased CVD risk as estimated by using SCORE and FINRISK risk models (Pohjantähti-Maaroos et al. 2012). Further, arterial compliance has broader clinical importance as it is associated with the pathogenesis of some non-cv outcomes including a variety of cognitive deficits such as Alzheimer s disease, cerebral white-matter lesions, and kidney dysfunction (Kalaria et al. 2012, Mikael et al. 2017, Mitchell. 2004) Pulse wave velocity At every heartbeat, a pulse wave is generated, which then travels along the arterial tree. As a result of heterogeneity caused by cellular, molecular, and histological variation of the arterial wall, the elastic qualities of arteries change along the arterial system, with stiffer distal arteries and more elastic proximal ones (Bezie et al. 1998, Latham et al. 1985, Laurent et al. 2005, Mikael et al. 2017). In addition, the wall of the artery loses elasticity with aging, becoming more rigid (Kelly et al. 1989, Nichols. 2005, Vaitkevicius et al. 1993). Pulse wave velocity (PWV) is the speed at which the forward flow wave or pressure is transmitted from the aorta through the arterial bed (Cheung. 2010). In humans, PWV increases from 4 5 m/s in the ascending aorta to 5 6 m/s in the abdominal aorta, and further, to 8 9 m/s in the iliac and femoral arteries (Latham et al. 1985, Nichols & O Rourke. 2005). PWV is 51
54 correlated inversely to arterial distensibility. In other words, the faster the PWV, the stiffer the artery. By providing a measure of mean stiffness of an arterial segment, PWV may provide a good reflection of overall vascular health (Cheung. 2010). The measurement of PWV is frequently accepted to be a robust, reproducible and straightforward non-invasive technique to assess arterial stiffness (Laurent et al. 2006). Furthermore, increased PWV is a powerful predictor of CVD events and mortality. According to a review written by Vlachopoulos et al. (2010), an increase in PWV of 1 m/s is correlated to a 14 15% increase in CVD events and mortality, as well as all-cause mortality (Vlachopoulos et al. 2010). PWV is most often determined using the foot-to-foot velocity technique from diverse waveforms, which are commonly obtained transcutaneously at the right common carotid artery as well as the right femoral artery, and the time delay (Dt or transit time) is measured between the feet of the two waveforms (Laurent et al. 2006). The foot of the pulse wave seems to be relatively unaffected by wave reflections, and it is determined at the end of diastole, when the steep rise of the wavefront begins (Cheung. 2010, Laurent et al. 2006). The distance (D) along which the pulse travels is usually estimated by direct superficial measurement between the two pressure transducers or other devices used to register the pulse. Recording of the pulse waves at these two sites can be carried out simultaneously or by gating separate recordings to the R wave of the electrocardiogram, the first upward deflection after the P wave (Cheung. 2010). PWV is calculated as D (meters) divided by Dt (seconds). This so called carotid femoral PWV is a direct measurement, and it fits the widely accepted propagative model of the arterial tree (Laurent et al. 2006). There are several ways to register arterial pulse waves noninvasively, including using an oscillometric device, pressure-sensitive transducers, whole-body impedance cardiography, applanation tonometry, photoplethysmography, Doppler ultrasonography, and magnetic resonance imaging (Asmar et al. 1995, Cortez- Cooper et al. 2003, Kontis & Gosling. 1989, Loukogeorgakis et al. 2002, Mohiaddin et al. 1993, Wilenius et al. 2016, Wilkinson et al. 1998, Wright et al. 1990). Regardless of the method used, a possible source of error when measuring arterial pulse waves noninvasively is the necessity to use the nearest superficial arteries as a surrogate site for inaccessible central arteries as well as approximation of the actual D between recording sites by using surface measurements. The shorter the D between two recording sites, the greater the absolute error in determining Dt. Some investigators suggest either using the total D between the carotid and femoral sites of measurement or subtracting the distance from the carotid location 52
55 to the sternal notch from the total D, or subtracting the distance from the carotid location to the sternal notch from the distance between the sternal notch and the femoral site of measurement (Van Bortel et al. 2002, van der Heijden-Spek et al. 2000). Despite these limitations, carotid femoral PWV is definitely a gold standard method, and probably the most widely used for assessment of arterial stiffness (Cheung. 2010, Laurent et al. 2006) Central blood pressure Hypertension a major risk feature of a variety of CV diseases is commonly diagnosed by measuring BP at the brachial artery (Papaioannou et al. 2009). The prognostic value of brachial BP is well known (Agabiti-Rosei et al. 2007). However, such a measurement may exactly determine diastolic BP, but does not accurately reflect systolic BP. The BP waveform is distorted when travelling outward from the heart as a result of the presence of wave reflections from the peripheral arteries. Because of this aberration, brachial BP provides an inaccurate measure of central aortic systolic pressure (Papaioannou et al. 2009). Vital organs are exposed to central rather than brachial BP (Kostapanos et al. 2016). Central BP (cbp) represents the true load imposed on the brain, heart and kidneys, and the central blood flow influences the local flow into these vital organs. An elevation of cbp has a direct adverse impact on the target organ and, thus, the prognosis of CVD in individuals with hypertension (Hashimoto. 2014). Among the different groups of antihypertensive drugs, beta-blockers appear to lower cbp less than brachial BP (Kostapanos et al. 2016). This difference may explain the decreased efficacy of beta-blockers in the prevention of CVD outcomes compared with the other classes of antihypertensive drugs, which lower central and brachial BP to a similar extent. Nevertheless, this differential effect might not be relevant to the newer beta-blockers with vasodilating properties (Kostapanos et al. 2016). Systolic cbp is an important factor determining cardiac function and work, while diastolic cbp may determine coronary flow (Papaioannou et al. 2009). Today, cbp can be estimated noninvasively from peripheral pressure pulses through the use of several devices (Kostapanos et al. 2016, Miyashita. 2012). Accurate peripheral pressure pulse recording has been made possible by the introduction of arterial applanation tonometry, for which the radial artery may be the optimal site. In terms of objectivity and reproducibility, an automated tonometry device utilizing a sensor array is preferable. Calibration of a peripheral pressure waveform carries 53
56 unsolved problems for any estimation method. However, if central and peripheral pressure calibrations are equivalent, two major methods to estimate cbp based on generalized pressure transfer function or radial late systolic pressure may be comparable in their preciseness of cbp estimation (Miyashita. 2012). Although values of cbp are indirect surrogate measures of arterial stiffness, they provide further information concerning pulse wave reflections (Nichols. 2005). Considerable evidence suggests that noninvasively determined cbp is pathophysiologically more relevant and a better predictor of end-organ damage than peripheral pressure (Kostapanos et al. 2016, Nelson et al. 2010, B. Williams et al. 2006). Furthermore, cbp also correlates with CVD risk in apparently healthy individuals (Agabiti-Rosei et al. 2007). 54
57 3 AIMS OF THE STUDY The aim of this work was to study non-traditional biomarkers of CVD risk factors and arterial stiffness 2 6 years after pregnancy with and without gestational diabetes in order to elucidate the higher CVD risk in women with previous GDM. Another aim was to examine the effect of obesity on the results. Moreover, we wanted to assess the utility of MetS diagnosis when estimating individual CVD risk. The specific aims of the study were to 1. determine the prevalence of MetS after previous GDM (I). 2. examine whether oxldl, HOMA-IR or cbp differ between women with and without previous GDM (II). 3. investigate possible differences in the serum concentrations of hscrp, MMP-8, -9 and TIMP-1, and in the measures of arterial stiffness after pregnancy complicated by GDM compared with normoglycemic pregnancy (III). 4. study the influence of obesity on the results (I III). 5. assess the utility of MetS diagnosis when estimating individual CVD risk by evaluating the differences in arterial stiffness and CVD risk features between individually paired fertile women with and without MetS (IV). 55
58 4 SUBJECTS AND METHODS 4.1 Subjects and study design This thesis consists of four substudies, referred to as I IV in the text. All the examinations were performed at Kanta-Häme Central Hospital and Linnan Klinikka, Hämeenlinna, Finland. Both recruitment and examinations were carried out between August 2011 and July 2014 (I IV). Studies I III were hospital-based studies of two cohorts. In these follow-up studies of 240 women, all of whom had undergone a 75-g OGTT during the index pregnancy, a total of 120 women with a history of GDM during the index pregnancy were compared with 120 age-matched women with normal glucose metabolism during pregnancy. All the participants were of Caucasian origin, and they had delivered 2 6 years earlier at Kanta-Häme Central Hospital, Finland, i.e. after the publication of Finnish Current Guidelines for screening GDM (I III) (Gestational diabetes. Current Care Guidelines. 2013). GDM was defined as any pathological value in a 2-h 75-g OGTT during pregnancy (venous plasma glucose 5.3 mmol/l when fasting, 10.0 mmol/l at 1 h or 8.6 mmol/l at 2 h). The diagnostic criteria of GDM were the same as in Finnish Current Guidelines, which were published in 2008 and updated in 2013 without any change in the diagnostic criteria of GDM (Gestational diabetes. Current Care Guidelines. 2013). The electronic database of Kanta-Häme Central Hospital was used to pick up the cases and controls (Figure 4). In summary, inclusion and exclusion criteria were as follows: singleton index pregnancy and delivery 2 6 years before participating in the follow-up study; GDM cohort: GDM defined as a pathological value in the 75-g OGTT according to Finnish Guidelines during the pregnancy (see above) (Gestational diabetes. Current Care Guidelines. 2013); Control cohort: normal OGTT results during the index pregnancy, no GDM in earlier pregnancy/pregnancies, and birth weight of the newborn < 4.5 kg. Women were also excluded if they had suspected or verified endocrine or malignant disease, diagnosed T1DM or T2DM before the index pregnancy, substance abuse or treatment, a known clinical history of psychiatric 56
59 illness or if they were pregnant at time of the study. Controls without GDM were excluded if they had been diagnosed with GDM in earlier pregnancy (I III) deliveries in Kanta-Häme Central Hospital during OGTTs during the index pregnancy 3880 low-risk pregnancies without OGTT According to OGTT 726 GDM 2143 normoglycemic pregnancies Follow-up study of two cohorts 120 GDM participants 120 controls _ Subgroups created according to BMI cut-off of 30 kg/m 2 43 GDM with BMI 30 kg/m 2 77 GDM with BMI < 30 kg/m 2 32 controls with BMI 30 kg/m 2 88 controls with BMI < 30 kg/m 2 Figure 4. Flow chart describing the recruitment of two cohorts in Studies I III. Further, under the dashed line it illustrates the division of four subgroups in Studies II & III. In Finland, GDM screening using a 75-g OGTT is offered to all pregnant women except those who are at the lowest risk: primiparous women < 25 years old, BMI 25 kg/m 2 and no known history of DM in first-degree relatives, or multiparous women < 40 years old, no GDM in previous pregnancy or pregnancies and BMI 25 kg/m 2 before the current pregnancy (Gestational diabetes. Current Care Guidelines. 2013). During the study period, we found 726 GDM women from the database of Kanta-Häme Central Hospital. GDM participants (n = 120) were selected randomly from the hospital database, which included both diet- and drug-treated gravidas with GDM. The BMI used in subgroup analyses was measured during the follow-up study. 57
60 During the study period, 42.5% of parturients had undergone OGTT screening for GDM in Kanta-Häme Central Hospital, meaning that 57.5% of pregnant women at that time were at the lowest risk and thus excluded from our study (I III). Power analyses were conducted to estimate the required number of participants. Concerning continuous variables, we worked on a difference of 10% with a standard deviation of 25% (Cohen s d = 0.40). Regarding the presentation of MetS the expected proportions were 10% and 25%. When the significance level was set at 5% and power at 80%, the estimated numbers of participants as regards continuous and categorical variables were 99 and 100 in both groups, respectively (I III). Metabolic syndrome (MetS) was defined according to the National Cholesterol Education Program Adult Treatment Panel III (NCEP ATP III) for women as the presence of at least three of the following five criteria (National Cholesterol Education Program (NCEP) Expert Panel on Detection, Evaluation, and Treatment of High Blood Cholesterol in Adults (Adult Treatment Panel III). 2002): 1) WC > 88 cm; 2) serum TGs 1.7 mmol/l; 3) serum HDL-C < 1.3 mmol/l; 4) BP 130/85 mmhg; 5) plasma glucose level 6.1 mmol/l, or DM. Further, impaired fasting glucose (IFG), impaired glucose tolerance (IGT) or T2DM were defined in a 2-h 75-g OGTT as follows: IFG: venous plasma glucose mmol/l when fasting; IGT: venous plasma glucose mmol/l at 2 h; T2DM: venous plasma glucose 7.0 mmol/l when fasting or > 11.0 at 2 h (Diabetes. Current Care Guidelines. 2018, WHO. 1999). To study the effect of obesity on the results, the whole study population was divided into four subgroups according to BMI and previous GDM. In Study I, the whole study group of 240 women was divided into two halves according to median BMI, which was 27 kg/m 2. The BMI cut-off of 27 kg/m 2 represents the average BMI of among Finnish women relatively well (26.8 kg/m 2 according to the FINRISK 2012 Study (Borodulin et al. 2014)). In medical investigations of obesity, agencies have used a BMI cut-off point of 30 kg/m 2, but also 27 kg/m 2 with comorbidity (Colman. 2012). In Studies II and III, obesity was classified according to the WHO recommendation as BMI of 30 kg/m 2 (Report of a WHO consultation. 2000). In (cross-sectional) Study IV, concerning the utility of MetS diagnosis when estimating individual CVD risk, 27 women with MetS were included from a total of 240 participants in the original study population. Every woman with MetS was compared with an individually paired counterpart without the syndrome. To avoid 58
61 the confounding effects of well-known CVD risk factors, the counterparts without MetS were matched according to age, previous GDM status, and serum concentrations of LDL-C and TC (IV) (Figure 5). Further, there was no significant difference in smoking history between the paired study groups. Original study population of 240 women GDM (n = 120) Controls (n = 120) 27 MetS GDM (n = 19) Controls (n = 8) 27 individually paired counterparts without MetS GDM (n = 19) Controls (n = 8) Figure 5. Flow chart illustrating the study population in the cross-sectional Study IV. Besides GDM status, the matching parameters between MetS women and individually paired counterparts without the syndrome were age and serum concentrations of both TC and LDL-C. There was no significant difference in the proportion of current smokers between the paired study groups. 4.2 Methods Individual interviews Information on each participant s medical history, CVD in the family, dietary habits, smoking, alcohol consumption, physical activity and lifetime weight loss was collected during a standardized interview. More closely, dietary habits were evaluated by inquiring about the consumption of meat, fish, sausage, berries, milk or low-fat milk products, sweets and sweet baked goods, butter, and margarine. Alcohol consumption was calculated as g/day according to the quantity of ethanol in different beverages such as beer, cider, wine or other alcoholic drinks, and the frequency of each beverage consumption. The participants were also asked about their average times, durations, types and intensity levels (four predetermined choices) of physical exercise per week. Further, the participants were interviewed as 59
62 regards their history of trauma or infectious diseases during the month before follow-up examinations. Information on the index pregnancy, delivery and perinatal outcome was collected using the hospital database. Smoking status was categorized as current, former or never. Lifetime tobacco exposure was calculated as pack-years by multiplying smoking years by the average number of packs smoked daily. One pack-year was defined as twenty cigarettes smoked every day for one year (Saquib et al. 2013). Initially successful weight loss followed by weight regain, i.e. so called yo-yo dieting or weight cycling, is associated with bodyweight excess and abdominal fat accumulation (Cereda et al. 2011). To analyze that, total lifetime weight loss was estimated by adding together kilograms lost during every previous intentional weight-loss period Physical examinations Weight (kg) and height (cm) of the participants were measured according to general recommendations. Brachial BP and heart rate were recorded by using an automatic electronic BP meter after at least ten minutes of rest in a semi-sitting position. At least three consecutive measurements of BP (with resolution of 1 mmhg) were performed to achieve average results for every woman. Pulse pressure (PP) was calculated as systolic minus diastolic BP. Waist circumference (WC) was measured midway between the lowest rib and the iliac crest at the midaxillar line to the nearest centimeter. BMI was calculated as weight in kilograms divided by height in meters squared (kg/m 2 ) Clinical chemistry and immunoassays Basic blood cell count (Laboratory of Linnan Klinikka, Hämeenlinna, Finland) and serum levels of creatinine, alanine transaminase (ALAT), fp-gluc, TC, HDL-C, LDL-C and TGs, and the urinary albumin to creatinine ratio, as well as plasma fibrinogen, were analyzed according to validated methods. Direct analyses of TC, HDL-C, LDL-C and TGs were carried out by using commercial reagents from Beckman Coulter (Brea, CA, USA). Non-HDL-C was calculated by subtracting HDL-C from TC (Orakzai et al. 2009). Analyses of ALAT (IFCC method), creatinine (Jaffé method), plasma glucose (hexokinase method), and glycosylated hemoglobin (HbA1c) were carried out by using commercial reagents from Beckman Coulter, with an Olympus AU640 analyzer, and analyses of fibrinogen 60
63 (Clauss method) by using Siemens BCS XP equipment. Plasma insulin levels were measured by electrochemiluminescence immunoassay (ECLIA) (Roche Cobas, Basel, Switzerland). Serum concentrations of hscrp were analyzed according to validated immunonephelometric (United Medix Laboratories Ltd., Espoo, Finland) and immunoturbidimetric methods (Chenillot et al. 2000, Sanchez et al. 2002). All the samples were collected into EDTA, lithium-heparin gel, or sodium fluoride tubes according to laboratory instructions after at least 12 hours of fasting and, after cold centrifugation, samples were stored at -80 ᵒC until analyzed. Clinical chemistry and immunoassays were carried out by VITA Healthcare Services Ltd., Vita Laboratory, Helsinki, Finland, if not mentioned otherwise Oxidized low-density lipoprotein Plasma concentrations of oxldl were determined by using a validated enzymelinked immunosorbent assay (ELISA) (Mercodia AB, Uppsala, Sweden). The reagents include the same monoclonal antibody (4E6) as originally described by Holvoet et al. (Holvoet et al. 1998, Holvoet et al. 2001). Plasma samples were diluted with sample buffer in two steps to gain a final dilution 1/6561. Of each calibrator, control and diluted sample, 25 µl were pipetted into wells containing mouse monoclonal anti-oxidized LDL. Assay buffer (100 µl) was added to each well, after which the plate was incubated on a plate shaker for 120 minutes at room temperature. After the incubation period, the samples were washed six times with an automatic washer before 100 µl peroxidase-conjugated mouse monoclonal antiapob was added to the wells. After 60-minute incubation at room temperature, the samples were washed again and the bound conjugate was detected by reaction with 200 µl 3.3, 5.5 -tetramethylbenzidine. The reaction was stopped by adding 50 µl H 2SO 4 at 0.5 mmol/l and the colorimetric endpoint was read spectrophotometrically at 450 nm. An Evolis ELISA analyzer (Bio-Rad, Marnes-la- Coquette, France) was used to run the assays. Analysis of plasma levels of oxldl is based on the standards included in each separate assay. The results were expressed as units per liter (U/L). The total coefficient of variation of the assay including both inter-assay and intra-assay variability was 8.5% (II). 61
64 Matrix metalloproteinase-8, and -9 and tissue inhibitor of metalloproteinase-1 Concentrations of MMP-8 were measured by a time-resolved immunofluorometric assay (IFMA) (Medix Biochemica, Espoo, Finland). Monoclonal MMP-8-specific antibodies 8708 and 8706 were used as a catching antibody and a tracer antibody, respectively. The tracer antibody was labeled with europium chelate. The assay buffer contained 20 mm Tris-HCl, ph 7.5, 0.5 µm NaCl, 5 mm CaCl 2, 50 µm ZnCl 2, 0.5% bovine serum albumin, 0.05% sodium azide, and diethylenetriaminepenta-acetic acid (DTPA) at 20 mg/l. Samples were diluted in assay buffer and incubated for 1 h, followed by incubation for 1 h with tracer antibody. Enhancement solution was added, and after 5 min fluorescence was measured using a 1234 Delfia Research Fluorometer (Wallac, Turku, Finland) (Hanemaaijer et al. 1997). The coefficient of variation of inter-assay for MMP-8 was 4.1%, and that of intra-assay 2.5% (III). Serum levels of MMP-9 and TIMP-1 (the Scientific Laboratory of the Department of Oral and Maxillofacial Diseases, Helsinki University and University Hospital, Finland) were determined by using commercially available ELISA kits. Biotrak ELISA systems kits for MMP-9 (Amersham Biosciences, GE Healthcare, Buckinghamshire, UK) were used according to the manufacturer s instructions. DuoSet ELISA development Systems kits for TIMP-1 (R&D Systems, Minneapolis, USA) were used correspondingly. All samples were analyzed in duplicate. According to the manufacturers the MMP-9 and TIMP-1 ELISAs detect active, pro-, complexed and fragmented forms of the analytes. The secondary antibody in each kit was conjugated with horseradish peroxidase, and tetramethylbenzidine was used as a substrate. Absorbance was measured at 450 nm using Labsystems Multiskan RC equipment (Thermo Bioanalysis Corporation, Santa FE, USA). The levels of MMP-8 and -9 and TIMP-1 were expressed as ng per ml, and for calculation of MMP-8 and -9/TIMP-1 molar ratios the levels were converted to mol per L (Rautelin et al. 2009). The coefficient of variation of interassay for MMP-9 was 8.8%, and for TIMP-1, 13.1%; and those of intra-assay for MMP-9 was 5.1% and for TIMP-1, 10.1% (III) The homeostasis model of insulin resistance The homeostasis model assessment of insulin resistance (HOMA-IR) index is based on single measurements of glucose and insulin in the blood and is commonly 62
65 used as a parameter reflecting the severity of IR (Monzillo & Hamdy. 2003). HOMA-IR was calculated by multiplying the fasting plasma insulin (fp-insu) level by that of fasting plasma glucose (fp-gluc), and dividing by 22.5 [fp -Insu (mu/l) fp-gluc (mmol/l)/22.5] (D. R. Matthews et al. 1985) (II) Non-invasive measurements of arterial function Altogether, four experienced nurses performed the non-invasive measures of arterial function. Participants were asked to refrain from eating, having caffeinated drinks, smoking and taking medication for 12 hours, and drinking alcohol for two days prior to measurement. All the measurements were done after the subject had had at least ten minutes of rest in a semi-sitting position. At least three consecutive recordings of all non-invasive measurements were performed to achieve average results for every woman (II IV) Arterial compliance Radial artery pulse waves were recorded non-invasively with an arterial tonometer (HDI/PulseWaveTMCR-2000, Hypertension Diagnostics, Inc., Eagan, Minnesota, USA) and the procedure involves the use of a modified Windkessel pulse-contour method (Cohn et al. 1995). Blood volume inertia and systemic vascular resistance were used to analyze arterial compliance. The capacitive compliance of large arteries (C1), including the aorta, and the endothelial function of small arteries (C2) were automatically assessed as a mean of the five most similar pulse waves appearing during thirty seconds of measurement (III & IV) Pulse wave velocity Pulse wave velocity (PWV) was determined using the foot-to-foot velocity method from carotid and femoral waveforms by employing a SphygmoCor device (AtCor Medical, Sydney, Australia) (Figure 6). Transcutaneous readings were gained at the right common carotid artery and the right femoral artery with the subjects in a supine position with direct-contact pulse sensors. The time delay (Dt or transit time) of the two waveforms was registered, and the distance (D) between carotid and femoral recording sites was obtained by subtracting the carotid measurement 63
. Figure 6.")
66 site to sternal notch distance from the sternal notch to the femoral measurement site distance. PWV was calculated as D/Dt (m/s) (Agabiti-Rosei et al. 2007, Laurent et al. 2006). Only measurements that met the automatic quality control cutoff were used in the final analysis (III & IV). Figure 6. PWV measured using the foot-to-foot velocity method from the waveforms of carotid and femoral arteries. D: distance; Dt: Time delay/transit time; PWV: pulse wave velocity Central blood pressure Central blood pressure (cbp) was estimated non-invasively from the radial artery pulse wave by way of a SphygmoCor device (AtCor Medical, Sydney, Australia), which uses radial pulse and a validated generalized transfer function to estimate central pressures from brachial BP and the peripheral pulse waves (Agabiti-Rosei et al. 2007) (II & IV). 64
67 4.3 Statistical Analyses The data were analyzed by using IBM SPSS Statistics Version 22 (copyright 2013) and 23 software (copyright 2015). Variables were tested for normality by way of Shapiro Wilk or Kolmogorov Smirnov tests, as appropriate. Data are presented as mean ± standard deviation (SD) if not mentioned otherwise. A two-tailed probability value of < 0.05 was considered significant (I IV). In Studies I III, differences in continuous variables between GDM and control cohorts were studied by using Student's t-test in cases of normality and by the Mann Whitney U-test in cases of non-normality. Categorical data are presented as percentages and were compared by using the chi-square test. The correlations between different variables were tested by Pearson s or Spearman s correlation analysis, as appropriate. The clinical characteristics of the four subgroups made according to BMI and previous GDM were compared by way of one-way ANOVA in cases of normality and by using the Kruskal Wallis test in cases of non-normality. Post hoc analyses were performed by using Fisher's least significant difference method or, in order to correct for multiple testing, by using a conservative Bonferroni correction factor. Univariate linear regression analyses were conducted to find possible associations with clinically relevant covariates. Multiple linear regression analyses were carried out to examine whether simple associations were changed after adjustment for potential confounders. Finally, stepwise multiple linear regression analyses were done to find relevant covariates in final models. F-statistics was used to optimize the sequential variable selection procedure. In Study IV, differences in continuous variables between MetS participants and individually paired counterparts without the syndrome were studied by using paired t-tests in cases of normality and by using Wilcoxon s test in cases of non-normality. Differences in binomial outcomes between the two paired study groups were tested by using McNemar s test. The Hodges Lehmann estimator was used for assessing differences in medians (with 95% CIs) between MetS participants and their matched controls. 4.4 Ethical considerations The study was conducted in accordance with the ethical principles outlined in the Declaration of Helsinki (World Medical Association Inc. 2009), and the protocol 65
68 was approved by the Ethics Committee of Kanta-Häme Hospital District (reference number 521/2010; date of approval ). Each participant was given both oral and written information on the study before she signed an informed consent document. All data were analyzed anonymously. 66
69 5 RESULTS 5.1 Follow-up study of two cohorts: women with previous gestational diabetes mellitus and controls (I III) Basic information on the index pregnancy and clinical characteristics in the followup study in the GDM and control groups are presented in Table 6. Twenty-three of the 120 women were primiparous in both cohorts. A total of 25 GDM participants had antihyperglycemic medication during their pregnancies (insulin, n = 24; metformin, n = 1), while the rest (n = 95) of the women in the GDM group had only dietary therapy. Almost thirty percent (29.9%, n = 29/97) of the multiparous GDM women had had GDM in an earlier pregnancy. Accumulation of pregnancy-induced hypertensive disorders was more common in GDM pregnancies. In the GDM group, induction of labor was more common than in the control group, but no difference was found in the rate of cesarean section. Regarding perinatal outcome, base excess in umbilical venous blood tended to be higher in controls, but otherwise perinatal outcomes did not differ between the study cohorts. Current Finnish guidelines recommend OGTT screening six to twelve weeks after delivery in cases of medicated GDM during pregnancy, and one year after delivery in diet-treated GDM during pregnancy (Gestational diabetes. Current Care Guidelines. 2013). Despite that, only 41 of the 120 GDM women (34.2%) had undergone an OGTT after delivery. Of these, 39.0% expressed glucose intolerance as follows: 17.1% had IFG, 14.6% had IGT and 7.3% had diabetes. Twenty-five of the 41 cases had normal results in postpartum OGTT screening (Table 6). In both study cohorts, the mean time to follow-up was 3.7 years. During the follow-up study, women were aged 35.8 ± 4.5 (range 25 to 46) in the two groups. There were no differences in family history of coronary heart disease (GDM 16.7% vs. controls 19.2%, p = 0.737) or DM (GDM 26.7% vs. controls 22.5%, p = 0.549), but a family history of cerebrovascular disease (GDM 12.5% vs. controls 4.2%, p = 0.033) differed significantly between the women with and without previous GDM. There were no differences in permanent medication for any chronic disease (GDM 67
70 35.8% vs. controls 29.2%, p = 0.335) or use of hormonal contraception (GDM 49.2% vs. controls 44.2%, p = 0.518) between the cohorts. Table 6. Baseline information on the index pregnancy in GDM and control cohorts. Data on pregestational BMI were available from 110 GDM and 108 control women, and data on smoking during the pregnancy in 99 GDM and 102 control women. GDM n = 120 Controls n = 120 Mean SD Mean SD p value Index pregnancy Pregestational BMI, kg/m Smoking during the pregnancy, n (%) 10 (8.3%) 5 (4.2%) Primiparous, n (%) 23 (19.2%) 23 (19.2%) g OGTT 0-h, mmol/l < h, mmol/l < h, mmol/l < Therapy of GDM Insulin, n (%) 24 (20.0%) Metformin, n (%) 1 (0.8%) Diet only, n (%) 95 (79.2%) Pregnancy-induced hypertension, n (%) 19 (15.8%) 8 (6.7%) Induction of labor, n (%) 42 (35.0%) 26 (21.7%) Rate of cesarean section, n (%) 29 (24.2%) 21 (17.5%) Perinatal outcome Gestational age, days Birth weight of the child, g Apgar at one minute Apgar at five minutes UA-pH UA-BE UV-pH UV-BE OGTT screening after delivery, n (%) 41 (34.2%) IFG, n (%) 7 (17.1%) IGT, n (%) 6 (14.6%) DM, n (%) 3 (7.3%) Normal, n (%) 25 (61.0%) BE: base excess; BMI: body mass index; DM: diabetes mellitus; GDM: gestational diabetes mellitus; IFG: impaired fasting glucose; IGT: impaired glucose tolerance; OGTT: oral glucose tolerance test; UA: umbilical artery; UV: umbilical vein 68
71 During the follow-up study, there were more current or former smokers in the GDM group than in the control group according to study interview data, and packyears of smoking also differed significantly. The groups did not differ in alcohol intake, physical activity, or lifetime weight loss. The proportion of GDM women using margarine weekly was less than in the control group (GDM 53.3% vs. controls 67.5%; p = 0.034), but on the other hand the proportions of weekly use of butter did not differ between the groups (GDM 57.5% vs. controls 55.0%; p = 0.795). The percentage of GDM participants who consumed sweets and sweet baked goods weekly was smaller than in control women (GDM 79.2% vs. controls 92.5%; p = 0.005). Otherwise, no other differences were found in basic nutrition habits between the groups. Of the whole study population, one woman in the GDM group did not take part in laboratory examinations. Basic laboratory results concerning the women with and without previous GDM are presented in Table 7. Concentrations of leukocytes (p = 0.008), hemoglobin (p = 0.001) and creatinine (p = 0.048) were higher among GDM women than in controls. The urinary albumin/creatinine ratio (U-AlbCre) tended to be higher among GDM women, but the difference was nonsignificant (p = 0.070). 69
72 Table 7. Clinical characteristics and laboratory findings in the follow-up study in the GDM and control cohorts. GDM n = 120 Controls n = 120 Mean SD Mean SD p value Follow-up study Average time since delivery (years) Age (years) Smoking status Current, n (%) 24 (20.0%) 12 (10.0%) Former, n (%) 45 (37.5%) 37 (30.8%) Never, n (%) 51 (42.5%) 71 (59.2%) Pack-years of smoking BMI, kg/m WC, cm Systolic BP, mmhg Diastolic BP, mmhg Heart rate, beats per minute Clinical chemistry Leukocytes, 10 9 /L Hemoglobin, g/l Platelets, 10 9 /L ALAT, U/L Creatinine, μmol/l Fibrinogen, g/l U-AlbCre, mg/mmol ALAT: alanine transaminase; BMI: body mass index; BP: blood pressure; GDM: gestational diabetes mellitus; OGTT: oral glucose tolerance test; U-AlbCre: urinary albumin/creatinine ratio; WC: waist circumference 5.2 Risk factors of cardiovascular disease after gestational diabetes mellitus (I III) Metabolic syndrome (I) After pregnancy complicated by GDM, the women fulfilled the criteria of MetS 2.4-fold more often than did the controls. In the whole study population, the prevalence of MetS was 11.3 %, while the prevalence in the GDM cohort was 70
73 15.8% and in the controls, 6.7% (p = 0.039). Defined by NCEP ATP III, the numbers of participants (%) with separate variables of MetS syndrome are presented in Table 8. Three women in the GDM group and five in the control group had permanent antihypertensive medication. Only one woman in the GDM cohort had treatment for lipid abnormality. Previous GDM (OR 2.63, 95% CI ; p = 0.029) was also associated with an increased risk of MetS in univariate logistic regression analysis, along with greater lifetime weight loss (OR 1.02, 95% CI ; p = 0.013), higher BMI values calculated per one BMI unit (OR 1.24, 95% CI ; p < 0.001) and higher levels of TC (OR 1.98, 95% CI ; p = 0.003). Further, multivariate analysis indicated that previous GDM (OR 2.83, 95% CI ; p = 0.040), higher serum concentrations of TC per one mmol/l (OR 1.68, 95% CI ; p = 0.046) and higher BMI values calculated per one BMI unit (OR 1.24, 95% CI ; p < 0.001) appeared to be associated with the manifestation of MetS. Table 8. Prevalence of metabolic syndrome (MetS) and numbers of participants with separate variables of MetS defined by NCEP ATP III in a setting of two cohorts. GDM n = 120 Control n = 120 p value MetS, n (%) 19 (15.8%) 8 (6.7%) WC > 88 cm 89 (74.2%) 73 (60.8%) TGs 1.7 mmol/l 12 (10.0%) 5 (4.2%) HDL-C < 1.3 mmol/l 23 (19.2%) 22 (18.3%) BP 130/85 mmhg 35 (29.2%) 25 (20.8%) fp-gluc 6.1 mmol/l or DM 18 (15.0%) 4 (3.3%) BP: blood pressure; fp-gluc: fasting plasma glucose; HDL-C: high-density lipoprotein cholesterol; DM: diabetes mellitus; GDM: gestational diabetes mellitus; MetS: metabolic syndrome; NCEP ATP III: National Cholesterol Education Program Adult Treatment Panel III; TGs: triglycerides; WC: waist circumference Glucose metabolism and homeostasis model assessment of insulin resistance (I & II) When women with previous GDM pregnancy were compared to women with previous normoglycemic pregnancy, there were significant differences in fasting plasma concentrations of glucose and HbA1c, but no difference in levels of fp- Insu. Further, HOMA-IR index values were significantly higher in the GDM 71
74 cohort. Variables of glucose metabolism in GDM women and controls are illustrated in Table 9. When GDM women with medication (n = 25) were compared with those with diet therapy (n = 95) during the index pregnancy, there was a significant difference only in fp-gluc (6.0 ± 1.0 vs. 5.5 ± 0.4 mmol/l, p = 0.003). When comparing drug-treated GDM women (n = 25), diet-treated GDM women (n = 95) and controls (n = 120), a significant difference was observed in HOMA-IR index values (p = 0.016). The HOMA-IR value among medicated GDM women was 1.6 ± 1.3, among diet-treated GDM women 1.2 ± 0.8 and among controls 1.1 ± 0.8 (p = for controls vs. medicated GDM women; other comparisons were nonsignificant). Table 9. Glucose metabolism and HOMA-IR in women with previous GDM and controls after normoglycemic pregnancy. Variable of GDM n = 119 Controls n = 120 glucose metabolism Mean SD Mean SD p value fp-gluc, mmol/l < fp-insu, mu/l HOMA-IR HbA1c, mmol/mol fp-gluc: fasting plasma glucose; fp-insu: fasting plasma insulin; GDM: gestational diabetes mellitus; HbA1C: glycosylated hemoglobin A1c; HOMA-IR: homeostasis model assessment of insulin resistance According to the International Expert Committee (IEC), glycemic categories based on HbA1c cut-off points are as follows: normal, HbA1c < 42 mmol/mol; prediabetes, HbA1c 42 mmol/mol, but < 48 mmol/mol; and diabetes, HbA1c 48 mmol/mol (Gillett. 2009). In the current study population, one woman had DM and four had prediabetes in the GDM cohort, while all women in the control group were in the normal glycemic category according to their HbA1c levels (p = 0.076). In multiple linear regression analysis, BMI was a significant determinant of the HOMA-IR index. However, previous GDM was not a crucial influencing factor of HOMA-IR in these analyses. 72
75 5.2.3 Lipids and oxidized low-density lipoprotein (I & II) Concentrations of lipids and oxldl in GDM women and controls are demonstrated in Table 10. Between the study cohorts, there was a significant difference only in serum levels of TGs. There were no differences in plasma concentrations of TC, HDL-C or LDL-C. Neither did oxldl levels differ in women with GDM vs. controls. In multiple linear regression analysis, neither BMI nor previous GDM were associated with plasma levels of oxldl. Table 10. Lipids and oxldl in GDM women and controls. GDM n = 119 Controls n = 120 Lipids Mean SD Mean SD p value TC, mmol/l HDL-C, mmol/l LDL-C, mmol/l TGs, mmol/l < non-hdl-c, mmol/l oxldl, U/L HDL-C: high-density lipoprotein cholesterol; GDM: gestational diabetes mellitus; LDL-C: low-density lipoprotein cholesterol; oxldl: oxidized low-density lipoprotein; TC: total cholesterol; TGs: triglycerides Low-grade inflammation (III) During the previous month before follow-up laboratory examinations, no significant differences were found between the GDM and control cohorts in selfreported histories of infectious diseases or traumas. There was no difference in the levels of hscrp between women with and without previous GDM, even when women affected by infectious diseases or traumas were excluded (data not shown). Serum concentrations of hscrp were analyzed by both immunonephelometric and immunoturbidimetric methods, with the same results (data not shown). In multiple-adjusted analysis, only BMI was a significant determinant of hscrp concentrations, but the model explained only 9.6% of hscrp variation. Previous GDM did not explain current hscrp levels. After the index pregnancy, serum concentrations of TIMP-1 were significantly higher in GDM mothers compared with controls. However, no differences were 73
76 observed in the circulating levels of MMP-8 or MMP-9 between the study cohorts. Previous GDM, hscrp and TC were important determinants of MMP-8 concentrations in stepwise multiple-adjusted analysis. Likewise, previous GDM, together with BMI and heart rate were associated with TIMP-1 levels in these analyses. Nevertheless, the model explained only 13.8% of MMP-8 and 6.7% of TIMP-1 variation. All determined variables of low-grade inflammation in the GDM and control cohorts are shown in Table 11. Table 11. Variables of low-grade inflammation in GDM women and controls. Concentrations of hscrp were analyzed by an immunonephelometric method. Variable of low-grade GDM n = 119 Controls n = 120 inflammation Mean SD Mean SD p value hscrp, mg/l MMP-8, ng/ml MMP-9, ng/ml TIMP-1, ng/ml hscrp: high-sensitivity C-reactive protein; GDM: gestational diabetes mellitus; MMP: matrix metalloproteinase; TIMP: tissue inhibitor of metalloproteinase 5.3 Arterial function after gestational diabetes mellitus (II & III) After GDM, PWV values were significantly higher than after normoglycemic pregnancy (Table 12). PWV was associated significantly with age (p < 0.001), BMI (p < 0.001), fp-insu (p < 0.001), heart rate (p < 0.001), systolic BP (p < 0.001), TC (p < 0.001) and previous GDM (p = 0.009) in univariate linear regression analysis. In stepwise multiple-adjusted analysis, significant determinants of PWV values were systolic BP, age, insulin levels, previous GDM and time since the index pregnancy. These variables together explained 47.0% of PWV variation. There was a nonsignificant difference in C1 values between the study groups. Further, no difference was observed in C2 values. In stepwise multiple linear regression analysis, systolic BP, heart rate, BMI and time since the index pregnancy were significant covariates explaining 52.4% of C1 values. Significant determinants of C2 values were systolic BP, heart rate, BMI, age and pack-years of smoking. These covariates explained 31.7% of C2 values. Differences in systolic and diastolic cbp did not reach statistical significance between the study groups. Neither did we find any difference in central mean pressure (90.7 ± 10.3 vs ± 9.5 mmhg; p = 74
77 0.089). All the non-invasive measurements of arterial function in the study cohorts are presented in Table 12. Table 12. Variables of arterial stiffness in GDM women and controls. Determinant of GDM n = 120 Controls n = 120 arterial stiffness Mean SD Mean SD p value C1, ml/mmhg C2, ml/mmhg PWV, m/s Systolic cbp, mmhg Diastolic cbp, mmhg cbp: central blood pressure; C1: large arterial compliance; C2: small arterial compliance; GDM: gestational diabetes mellitus; PWV: pulse wave velocity 5.4 Effect of obesity (I III) Both of the study groups, i.e. all 240 women, were included in subgroup analyses to investigate the effect of excess body weight and obesity on the primary results. In Study I, the whole study population of 240 women was divided into two halves according to median BMI, which was 27 kg/m 2. When using this cut-off point, there were 122 women in the obese group (BMI 27 kg/m 2 ); 65 GDM and 57 control participants. The non-obese group (BMI < 27 kg/m 2 ; n = 118) consisted of 55 GDM and 63 control participants. In Studies II and III, obesity was classified as BMI of 30 kg/m 2. Altogether, there were 75 women in the obese group (BMI 30 kg/m 2 ); 43 GDM and 32 control participants. The non-obese group (BMI < 30 kg/m 2 ; n=165) consisted of 77 GDM and 88 control participants. Regardless of the BMI cut-off point, there were differences in most of the basic clinical characteristics between these four subgroups, particularly between non-obese and obese subgroups. Results of subgroup analyses with a BMI cut-off of 30 kg/m 2 are shown in Table 13, while those with a BMI cut-off of 27 kg/m 2 are presented in Study I. 75
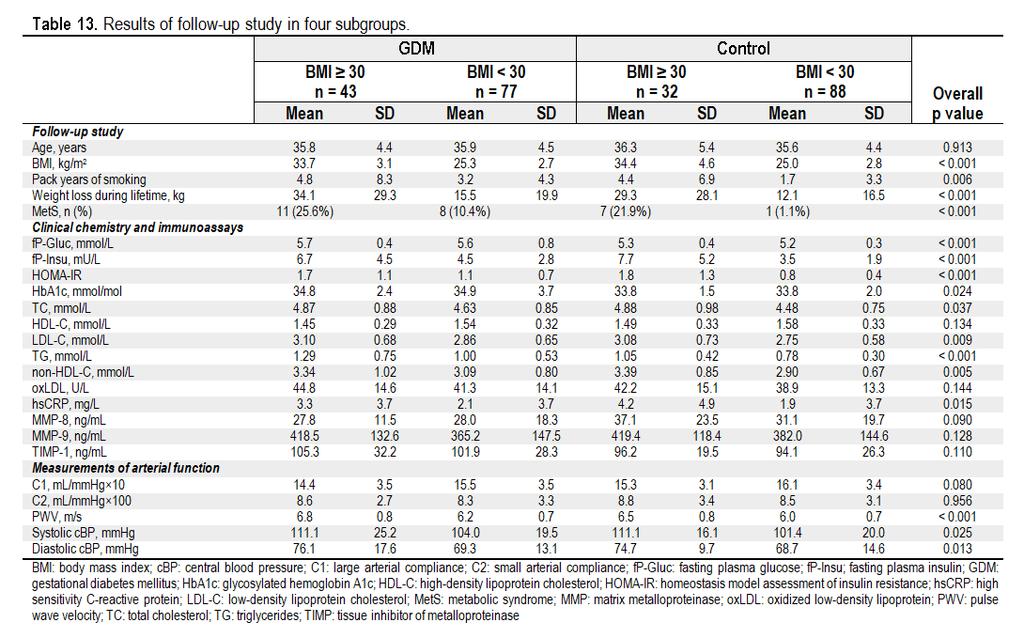
78 76
Mitä raskausdiabeteksen jälkeen?
 Mitä raskausdiabeteksen jälkeen? Diabeteshoitajien valtakunnalliset koulutuspäivät 11.4.2019 Seinäjoki Tiina Vilmi-Kerälä, vs ylilääkäri Naistentaudit ja synnytykset, Kanta-Hämeen keskussairaala Sidonnaisuudet
Capacity Utilization
 Capacity Utilization Tim Schöneberg 28th November Agenda Introduction Fixed and variable input ressources Technical capacity utilization Price based capacity utilization measure Long run and short run
Results on the new polydrug use questions in the Finnish TDI data
 Results on the new polydrug use questions in the Finnish TDI data Multi-drug use, polydrug use and problematic polydrug use Martta Forsell, Finnish Focal Point 28/09/2015 Martta Forsell 1 28/09/2015 Esityksen
HMG-CoA Reductase Inhibitors and safety the risk of new onset diabetes/impaired glucose metabolism
 HMG-CoA Reductase Inhibitors and safety the risk of new onset diabetes/impaired glucose metabolism Final SmPC and PL wording agreed by PhVWP December 2011 SUMMARY OF PRODUCT CHARACTERISTICS New Class Warnings
SVT, diabetes ja metabolinen oireyhtymä
 SVT, diabetes ja metabolinen oireyhtymä Veikko Salomaa, MD, PhD Research Professor 10/21/11 SVT, DM, MeTS / Salomaa 1 10/21/11 Presentation name / Author 2 35-64 - vuo*aiden ikävakioitu sepelval*motau*kuolleisuus
Efficiency change over time
 Efficiency change over time Heikki Tikanmäki Optimointiopin seminaari 14.11.2007 Contents Introduction (11.1) Window analysis (11.2) Example, application, analysis Malmquist index (11.3) Dealing with panel
Valintakoe klo Liikuntalääketiede/Itä-Suomen yliopisto
 Valintakoe klo 13-16 12.5.2015 Liikuntalääketiede/Itä-Suomen yliopisto Mediteknia Nimi Henkilötunnus Tehtävä 1 (max 8 pistettä) Saatte oheisen artikkelin 1 Exercise blood pressure and the risk for future
Benchmarking Controlled Trial - a novel concept covering all observational effectiveness studies
 Benchmarking Controlled Trial - a novel concept covering all observational effectiveness studies Antti Malmivaara, MD, PhD, Chief Physician Centre for Health and Social Economics National Institute for
Statistical design. Tuomas Selander
 Statistical design Tuomas Selander 28.8.2014 Introduction Biostatistician Work area KYS-erva KYS, Jyväskylä, Joensuu, Mikkeli, Savonlinna Work tasks Statistical methods, selection and quiding Data analysis
Other approaches to restrict multipliers
 Other approaches to restrict multipliers Heikki Tikanmäki Optimointiopin seminaari 10.10.2007 Contents Short revision (6.2) Another Assurance Region Model (6.3) Cone-Ratio Method (6.4) An Application of
On instrument costs in decentralized macroeconomic decision making (Helsingin Kauppakorkeakoulun julkaisuja ; D-31)
") On instrument costs in decentralized macroeconomic decision making (Helsingin Kauppakorkeakoulun julkaisuja ; D-31) Juha Kahkonen Click here if your download doesn"t start automatically On instrument costs
On instrument costs in decentralized macroeconomic decision making (Helsingin Kauppakorkeakoulun julkaisuja ; D-31) Juha Kahkonen Click here if your download doesn"t start automatically On instrument costs
Onko eteisvärinä elintapasairaus? Suomen Verenpaineyhdistyksen syysristeily 2015 Päivi Korhonen
 Onko eteisvärinä elintapasairaus? Suomen Verenpaineyhdistyksen syysristeily 2015 Päivi Korhonen Men Women NEJM 1997; 337:1360-69 Two new epidemics of cardiovascular disease are emerging: heart failure
On instrument costs in decentralized macroeconomic decision making (Helsingin Kauppakorkeakoulun julkaisuja ; D-31)
") On instrument costs in decentralized macroeconomic decision making (Helsingin Kauppakorkeakoulun julkaisuja ; D-31) Juha Kahkonen Click here if your download doesn"t start automatically On instrument costs
On instrument costs in decentralized macroeconomic decision making (Helsingin Kauppakorkeakoulun julkaisuja ; D-31) Juha Kahkonen Click here if your download doesn"t start automatically On instrument costs
1. SIT. The handler and dog stop with the dog sitting at heel. When the dog is sitting, the handler cues the dog to heel forward.
 START START SIT 1. SIT. The handler and dog stop with the dog sitting at heel. When the dog is sitting, the handler cues the dog to heel forward. This is a static exercise. SIT STAND 2. SIT STAND. The
Increase of opioid use in Finland when is there enough key indicator data to state a trend?
 Increase of opioid use in Finland when is there enough key indicator data to state a trend? Martta Forsell, Finnish Focal Point 28.9.2015 Esityksen nimi / Tekijä 1 Martta Forsell Master of Social Sciences
Constructive Alignment in Specialisation Studies in Industrial Pharmacy in Finland
 Constructive Alignment in Specialisation Studies in Industrial Pharmacy in Finland Anne Mari Juppo, Nina Katajavuori University of Helsinki Faculty of Pharmacy 23.7.2012 1 Background Pedagogic research
The CCR Model and Production Correspondence
 The CCR Model and Production Correspondence Tim Schöneberg The 19th of September Agenda Introduction Definitions Production Possiblity Set CCR Model and the Dual Problem Input excesses and output shortfalls
Perusterveydenhuollon erilaisten diabeteksen hoitomallien tuloksellisuuden vertailu (painopisteenä tyypin 1 diabetes)
") SYLY- päivät 2014 Helsinki 28.11.2014 Perusterveydenhuollon erilaisten diabeteksen hoitomallien tuloksellisuuden vertailu (painopisteenä tyypin 1 diabetes) Diabeteslääkäri Mikko Honkasalo Nurmijärven terveyskeskus
SYLY- päivät 2014 Helsinki 28.11.2014 Perusterveydenhuollon erilaisten diabeteksen hoitomallien tuloksellisuuden vertailu (painopisteenä tyypin 1 diabetes) Diabeteslääkäri Mikko Honkasalo Nurmijärven terveyskeskus
RANTALA SARI: Sairaanhoitajan eettisten ohjeiden tunnettavuus ja niiden käyttö hoitotyön tukena sisätautien vuodeosastolla
 TURUN YLIOPISTO Hoitotieteen laitos RANTALA SARI: Sairaanhoitajan eettisten ohjeiden tunnettavuus ja niiden käyttö hoitotyön tukena sisätautien vuodeosastolla Pro gradu -tutkielma, 34 sivua, 10 liitesivua
Knowledge expectations from the perspective of aged dialysis patients
 Knowledge expectations from the perspective of aged dialysis patients Mirkka Rantanen, RDH, MNS-student 1 Tapio Kallio, RN, MNSc 3 Kirsi Johansson, RN, PhD, Coordinator 1,2 Sanna Salanterä,RN, PhD, Professor
HEIDI HAKKARAINEN LONG-TERM HEALTH IN WOMEN WHO HAVE HAD GESTATIONAL DIABETES OR AN LGA NEWBORN
 PUBLICATIONS OF THE UNIVERSITY OF EASTERN FINLAND Dissertations in Health Sciences HEIDI HAKKARAINEN LONG-TERM HEALTH IN WOMEN WHO HAVE HAD GESTATIONAL DIABETES OR AN LGA NEWBORN LONG-TERM HEALTH IN WOMEN
On instrument costs in decentralized macroeconomic decision making (Helsingin Kauppakorkeakoulun julkaisuja ; D-31)
") On instrument costs in decentralized macroeconomic decision making (Helsingin Kauppakorkeakoulun julkaisuja ; D-31) Juha Kahkonen Click here if your download doesn"t start automatically On instrument costs
On instrument costs in decentralized macroeconomic decision making (Helsingin Kauppakorkeakoulun julkaisuja ; D-31) Juha Kahkonen Click here if your download doesn"t start automatically On instrument costs
Helsingin Johtajatutkimus 1964-2005. 1919-34 syntyneiden johtajien 26-39 vuoden seurantatutkimus
 Helsingin Johtajatutkimus 1964-05 Timo Strandberg Geriatrian professori Oulun yliopisto Helsingin Johtajatutkimus 1964-05 Elämänlaatu, successful aging, compression of morbidity Painonmuutoksen merkitys
Network to Get Work. Tehtäviä opiskelijoille Assignments for students. www.laurea.fi
 Network to Get Work Tehtäviä opiskelijoille Assignments for students www.laurea.fi Ohje henkilöstölle Instructions for Staff Seuraavassa on esitetty joukko tehtäviä, joista voit valita opiskelijaryhmällesi
Returns to Scale II. S ysteemianalyysin. Laboratorio. Esitelmä 8 Timo Salminen. Teknillinen korkeakoulu
 Returns to Scale II Contents Most Productive Scale Size Further Considerations Relaxation of the Convexity Condition Useful Reminder Theorem 5.5 A DMU found to be efficient with a CCR model will also be
HARJOITUS- PAKETTI A
 Logistiikka A35A00310 Tuotantotalouden perusteet HARJOITUS- PAKETTI A (6 pistettä) TUTA 19 Luento 3.Ennustaminen County General 1 piste The number of heart surgeries performed at County General Hospital
Gap-filling methods for CH 4 data
 Gap-filling methods for CH 4 data Sigrid Dengel University of Helsinki Outline - Ecosystems known for CH 4 emissions; - Why is gap-filling of CH 4 data not as easy and straight forward as CO 2 ; - Gap-filling
Information on preparing Presentation
 Information on preparing Presentation Seminar on big data management Lecturer: Spring 2017 20.1.2017 1 Agenda Hints and tips on giving a good presentation Watch two videos and discussion 22.1.2017 2 Goals
Pricing policy: The Finnish experience
 Pricing policy: The Finnish experience Esa Österberg Senior Researcher Alcohol and Drug Research, STAKES, Helsinki, Finland esa.osterberg@stakes.fi Three pillars of traditional Nordic alcohol control Strict
Uusi Ajatus Löytyy Luonnosta 4 (käsikirja) (Finnish Edition)
 (Finnish Edition)") Uusi Ajatus Löytyy Luonnosta 4 (käsikirja) (Finnish Edition) Esko Jalkanen Click here if your download doesn"t start automatically Uusi Ajatus Löytyy Luonnosta 4 (käsikirja) (Finnish Edition) Esko Jalkanen
Uusi Ajatus Löytyy Luonnosta 4 (käsikirja) (Finnish Edition) Esko Jalkanen Click here if your download doesn"t start automatically Uusi Ajatus Löytyy Luonnosta 4 (käsikirja) (Finnish Edition) Esko Jalkanen
NAO- ja ENO-osaamisohjelmien loppuunsaattaminen ajatuksia ja visioita
 NAO- ja ENO-osaamisohjelmien loppuunsaattaminen ajatuksia ja visioita NAO-ENO työseminaari VI Tampere 3.-4.6.2015 Projektisuunnittelija Erno Hyvönen erno.hyvonen@minedu.fi Aikuiskoulutuksen paradigman
GOOD WORK LONGER CAREER:
 Juhani Ilmarinen, Ville Ilmarinen, Pekka Huuhtanen, Veikko Louhevaara, Ove Näsman GOOD WORK LONGER CAREER: WORK WELL-BEING IN FINNISH TECHNOLOGY INDUSTRIES 2010-2015 Background Collective agreement between
3 9-VUOTIAIDEN LASTEN SUORIUTUMINEN BOSTONIN NIMENTÄTESTISTÄ
 Puhe ja kieli, 27:4, 141 147 (2007) 3 9-VUOTIAIDEN LASTEN SUORIUTUMINEN BOSTONIN NIMENTÄTESTISTÄ Soile Loukusa, Oulun yliopisto, suomen kielen, informaatiotutkimuksen ja logopedian laitos & University
Liikunnan vaikuttavuus ja kuntoutus
 Liikunnan vaikuttavuus ja kuntoutus Urho Kujala Liikuntalääketieteen erikoislääkäri Liikuntalääketieteen professori Terveystieteiden yksikkö, Liikuntatieteellinen tiedekunta Jyväskylän yliopisto urho.m.kujala@jyu.fi
EBM ja laboratorio. Kristina Hotakainen HY ja HUSLAB
 EBM ja laboratorio Kristina Hotakainen HY ja HUSLAB EBLM Arvioidaan laboratoriokokeiden vaikutuksia kliiniseen päätöksentekoon ja potilaan hoitotuloksiin mm. kliinistä epidemiologiaa, tilastotiedettä,
LYTH-CONS CONSISTENCY TRANSMITTER
 LYTH-CONS CONSISTENCY TRANSMITTER LYTH-INSTRUMENT OY has generate new consistency transmitter with blade-system to meet high technical requirements in Pulp&Paper industries. Insurmountable advantages are
16. Allocation Models
 16. Allocation Models Juha Saloheimo 17.1.27 S steemianalsin Optimointiopin seminaari - Sks 27 Content Introduction Overall Efficienc with common prices and costs Cost Efficienc S steemianalsin Revenue
Aiming at safe performance in traffic. Vastuullinen liikenne. Rohkeasti yhdessä.
 Aiming at safe performance in traffic Vastuullinen liikenne. Rohkeasti yhdessä. Medical doctors promoting traffic safety Jukka Terttunen Traffic Medicine Unit Finnish Traffic Safety Agency Vastuullinen
Mitä ylipaino ja metabolinen oireyhtymä tekevät verenkiertoelimistön säätelylle? SVPY:n syyskokous 5.9.2015 Pauliina Kangas, EL Tampereen yliopisto
 Mitä ylipaino ja metabolinen oireyhtymä tekevät verenkiertoelimistön säätelylle? SVPY:n syyskokous 5.9.2015 Pauliina Kangas, EL Tampereen yliopisto Taustaa q Metabolinen oireyhtymä (MBO, MetS) on etenkin
Infrastruktuurin asemoituminen kansalliseen ja kansainväliseen kenttään Outi Ala-Honkola Tiedeasiantuntija
 Infrastruktuurin asemoituminen kansalliseen ja kansainväliseen kenttään Outi Ala-Honkola Tiedeasiantuntija 1 Asemoitumisen kuvaus Hakemukset parantuneet viime vuodesta, mutta paneeli toivoi edelleen asemoitumisen
Elämänkulku ja vanheneminen
 Elämänkulku ja vanheneminen Taina Rantanen Gerontologian ja kansanterveyden professori Gerontologian tutkimuskeskus Terveystieteiden laitos Jyväskylän yliopisto Miksi tutkia pitkäikäisyyttä ja vanhuuden
Land-Use Model for the Helsinki Metropolitan Area
 Land-Use Model for the Helsinki Metropolitan Area Paavo Moilanen Introduction & Background Metropolitan Area Council asked 2005: What is good land use for the transport systems plan? At first a literature
MUSEOT KULTTUURIPALVELUINA
 Elina Arola MUSEOT KULTTUURIPALVELUINA Tutkimuskohteena Mikkelin museot Opinnäytetyö Kulttuuripalvelujen koulutusohjelma Marraskuu 2005 KUVAILULEHTI Opinnäytetyön päivämäärä 25.11.2005 Tekijä(t) Elina
Group 2 - Dentego PTH Korvake. Peer Testing Report
 Group 2 - Dentego PTH Korvake Peer Testing Report Revisions Version Date Author Description 1.0 Henrik Klinkmann First version Table of Contents Contents Revisions... 2 Table of Contents... 2 Testing...
Organisaation kokonaissuorituskyvyn arviointi
 Organisaation kokonaissuorituskyvyn arviointi Aila Järveläinen, 13.3.2018 aila.jarvelainen@trafi.fi Responsible traffic. Courage and co-operation. Hallintojärjestelmä CMS + SMS CMS SMS 29.3.2018 Finnish
Naisnäkökulma sijoittamiseen. 24.3.2007 Vesa Puttonen
 Naisnäkökulma sijoittamiseen 24.3.2007 Vesa Puttonen Miten sukupuolella voi olla mitään tekemistä sijoittamisen kanssa??? Naiset elävät (keskimäärin) pidempään kuin miehet Naiset saavat (keskimäärin) vähemmän
T Statistical Natural Language Processing Answers 6 Collocations Version 1.0
 T-61.5020 Statistical Natural Language Processing Answers 6 Collocations Version 1.0 1. Let s start by calculating the results for pair valkoinen, talo manually: Frequency: Bigrams valkoinen, talo occurred
Kysymys 5 Compared to the workload, the number of credits awarded was (1 credits equals 27 working hours): (4)
: (4)") Tilasto T1106120-s2012palaute Kyselyn T1106120+T1106120-s2012palaute yhteenveto: vastauksia (4) Kysymys 1 Degree programme: (4) TIK: TIK 1 25% ************** INF: INF 0 0% EST: EST 0 0% TLT: TLT 0 0% BIO:
Tilasto T1106120-s2012palaute Kyselyn T1106120+T1106120-s2012palaute yhteenveto: vastauksia (4) Kysymys 1 Degree programme: (4) TIK: TIK 1 25% ************** INF: INF 0 0% EST: EST 0 0% TLT: TLT 0 0% BIO:
Accommodation statistics
 Transport and Tourism 2011 Accommodation statistics 2011, January Nights spent by foreign tourists in Finland increased by per cent in January The number of recorded nights spent by foreign tourists at
Suomen Potilasturvallisuusyhdistys SPTY ry
 Suomen Potilasturvallisuusyhdistys SPTY ry 24.10.2017 Suomen Potilasturvallisuusyhdistys ry Perustettu v. 2010 Perustehtävä: edistää potilasturvallisuutta ja potilasturvallisuuden tutkimusta Suomessa Toimintaa
Innovative and responsible public procurement Urban Agenda kumppanuusryhmä. public-procurement
 Innovative and responsible public procurement Urban Agenda kumppanuusryhmä https://ec.europa.eu/futurium/en/ public-procurement Julkiset hankinnat liittyvät moneen Konsortio Lähtökohdat ja tavoitteet Every
Academic Opening. Opening - Introduction. In this essay/paper/thesis I shall examine/investigate/evaluate/analyze General opening for an essay/thesis
 - Introduction In this essay/paper/thesis I shall examine/investigate/evaluate/analyze General opening for an essay/thesis Tässä esseessä / tutkielmassa / opinnäytetyössä tutkin / tarkastelen / arvioin/
Characterization of clay using x-ray and neutron scattering at the University of Helsinki and ILL
 Characterization of clay using x-ray and neutron scattering at the University of Helsinki and ILL Ville Liljeström, Micha Matusewicz, Kari Pirkkalainen, Jussi-Petteri Suuronen and Ritva Serimaa 13.3.2012
7. Product-line architectures
 7. Product-line architectures 7.1 Introduction 7.2 Product-line basics 7.3 Layered style for product-lines 7.4 Variability management 7.5 Benefits and problems with product-lines 1 Short history of software
Accommodation statistics
 Transport and Tourism 2013 Accommodation statistics 2013, February Nights spent by foreign tourists in Finland down by 2.5 per cent in February 2013 The number of recorded nights spent by foreign tourists
Raskausdiabetes. GDM Gravidassa Tammikuun kihlaus Kati Kuhmonen
 Raskausdiabetes Tammikuun kihlaus GDM Gravidassa 2017 302 potilaalla dg O24.4 Potilaita GDM-kirjalla 164 Sokerisoittoja 618 Ohjauskäyntejä 137 Lääkehoitoisia potilaita 66 Metformiini 41 potilaalle fi insuliini
KASVISSYÖJIEN KOLESTEROLI, VERENPAINE JA YLIPAINO
 KASVISSYÖJIEN KOLESTEROLI, VERENPAINE JA YLIPAINO Näyttöä väestötutkimuksista, 1960 2015 www.puolikiloa.fi 2 Meta- analyysi Tutkimus Maa Vuodet Key ym. 1999 Adven7st Mortality USA 1960 65 Mukana Adven7st
The Finnish healthcare service grid and access in rural Finland
 The Finnish healthcare service grid and access in rural Finland Kimmo Parhiala, M.Soc.Sc Development Manager, National Institute for Health and Welfare TW: @parhialakimmo 20.6.2017 The Finnish healthcare
Lataa Legislating the blind spot - Nikolas Sellheim. Lataa
 Lataa Legislating the blind spot - Nikolas Sellheim Lataa Kirjailija: Nikolas Sellheim ISBN: 9789524849012 Sivumäärä: 292 Formaatti: PDF Tiedoston koko: 22.52 Mb For decades the Canadian seal hunt has
DIABEETIKON SYDÄN MIKKO PUHAKKA KARDIOLOGI JA SISÄTAUTILÄÄKÄRI JYVÄSKYLÄ MPU UEF
 DIABEETIKON SYDÄN MIKKO PUHAKKA KARDIOLOGI JA SISÄTAUTILÄÄKÄRI JYVÄSKYLÄ 11.5.2017 MPU UEF 1 SIDONNAISUUDET UEF kardiologian kliininen opettaja KYS konsultoiva kardiologi, Medisiininen keskus Osallistunut
OP1. PreDP StudyPlan
 OP1 PreDP StudyPlan PreDP The preparatory year classes are in accordance with the Finnish national curriculum, with the distinction that most of the compulsory courses are taught in English to familiarize
anna minun kertoa let me tell you
 anna minun kertoa let me tell you anna minun kertoa I OSA 1. Anna minun kertoa sinulle mitä oli. Tiedän että osaan. Kykenen siihen. Teen nyt niin. Minulla on oikeus. Sanani voivat olla puutteellisia mutta
S-55.1100 SÄHKÖTEKNIIKKA JA ELEKTRONIIKKA
 S-55.00 SÄHKÖKNKKA A KONKKA. välikoe 2..2008. Saat vastata vain neljään tehtävään!. aske jännite U. = 4 Ω, 2 = Ω, = Ω, = 2, 2 =, = A, 2 = U 2 2 2 2. ännitelähde tuottaa hetkestä t = t < 0 alkaen kaksiportaisen
Elixir of life Elixir for Mind and Body
 Elixir of life Elixir for Mind and Body Session C: Horizontality of Industries and future services SHOK Summit April 20th, 2010 Katja Hatakka, PhD, Development Manager, Valio R&D Case Susan Facts about
Julkaisun laji Opinnäytetyö. Sivumäärä 43
 OPINNÄYTETYÖN KUVAILULEHTI Tekijä(t) SUKUNIMI, Etunimi ISOVIITA, Ilari LEHTONEN, Joni PELTOKANGAS, Johanna Työn nimi Julkaisun laji Opinnäytetyö Sivumäärä 43 Luottamuksellisuus ( ) saakka Päivämäärä 12.08.2010
Robert S. Broadhead, Ph.D., University of Connecticut Pavlo Smyrnov, Oleksandra Datsenko and Oksana Matiyash International HIV/AIDS Alliance in
 Robert S. Broadhead, Ph.D., University of Connecticut Pavlo Smyrnov, Oleksandra Datsenko and Oksana Matiyash International HIV/AIDS Alliance in Ukraine Robert S. Broadhead, Ph.D., University of Connecticut
Alternative DEA Models
 Mat-2.4142 Alternative DEA Models 19.9.2007 Table of Contents Banker-Charnes-Cooper Model Additive Model Example Data Home assignment BCC Model (Banker-Charnes-Cooper) production frontiers spanned by convex
7.4 Variability management
 7.4 Variability management time... space software product-line should support variability in space (different products) support variability in time (maintenance, evolution) 1 Product variation Product
Teacher's Professional Role in the Finnish Education System Katriina Maaranen Ph.D. Faculty of Educational Sciences University of Helsinki, Finland
 Teacher's Professional Role in the Finnish Education System Katriina Maaranen Ph.D. Faculty of Educational Sciences University of Helsinki, Finland www.helsinki.fi/yliopisto This presentation - Background
Data quality points. ICAR, Berlin,
 Data quality points an immediate and motivating supervision tool ICAR, Berlin, 22.5.2014 Association of ProAgria Centres Development project of Milk Recording Project manager, Heli Wahlroos heli.wahlroos@proagria.fi
Choose Finland-Helsinki Valitse Finland-Helsinki
 Write down the Temporary Application ID. If you do not manage to complete the form you can continue where you stopped with this ID no. Muista Temporary Application ID. Jos et onnistu täyttää lomake loppuun
National Building Code of Finland, Part D1, Building Water Supply and Sewerage Systems, Regulations and guidelines 2007
 National Building Code of Finland, Part D1, Building Water Supply and Sewerage Systems, Regulations and guidelines 2007 Chapter 2.4 Jukka Räisä 1 WATER PIPES PLACEMENT 2.4.1 Regulation Water pipe and its
Digital Admap Native. Campaign: Kesko supermarket
 Digital Admap Native Campaign: Kesko supermarket Digital Admap Native Campaign: Kesko Supermarket Mainosmuoto: Natiivi Media: IS.fi Campaign period: 25 September Date of measurement: 26 September Unique:
LX 70. Ominaisuuksien mittaustulokset 1-kerroksinen 2-kerroksinen. Fyysiset ominaisuudet, nimellisarvot. Kalvon ominaisuudet
 LX 70 % Läpäisy 36 32 % Absorptio 30 40 % Heijastus 34 28 % Läpäisy 72 65 % Heijastus ulkopuoli 9 16 % Heijastus sisäpuoli 9 13 Emissiivisyys.77.77 Auringonsuojakerroin.54.58 Auringonsäteilyn lämmönsiirtokerroin.47.50
Reliable diagnostic support Ultra-light design
 EN Powerful illumination Intelligent charging management Reliable diagnostic support Ultra-light design VISIOMED Optima UV original scale 1:1 VISIOMED Optima Quality Made Easy and an illumination close
Valuation of Asian Quanto- Basket Options
 Valuation of Asian Quanto- Basket Options (Final Presentation) 21.11.2011 Thesis Instructor and Supervisor: Prof. Ahti Salo Työn saa tallentaa ja julkistaa Aalto-yliopiston avoimilla verkkosivuilla. Muilta
FIS IMATRAN KYLPYLÄHIIHDOT Team captains meeting
 FIS IMATRAN KYLPYLÄHIIHDOT 8.-9.12.2018 Team captains meeting 8.12.2018 Agenda 1 Opening of the meeting 2 Presence 3 Organizer s personell 4 Jury 5 Weather forecast 6 Composition of competitors startlists
Use of spatial data in the new production environment and in a data warehouse
 Use of spatial data in the new production environment and in a data warehouse Nordic Forum for Geostatistics 2007 Session 3, GI infrastructure and use of spatial database Statistics Finland, Population
Lataa Cognitive Function in Opioid Substitution Treated Patiens - Pekka Rapeli. Lataa
 Lataa Cognitive Function in Opioid Substitution Treated Patiens - Pekka Rapeli Lataa Kirjailija: Pekka Rapeli ISBN: 9789523022232 Sivumäärä: 173 Formaatti: PDF Tiedoston koko: 11.54 Mb Opioid substitution
ReFuel 70 % Emission Reduction Using Renewable High Cetane Number Paraffinic Diesel Fuel. Kalle Lehto, Aalto-yliopisto 5.5.
 ReFuel 70 % Emission Reduction Using Renewable High Cetane Number Paraffinic Diesel Fuel Kalle Lehto, Aalto-yliopisto 5.5.2011 Otaniemi ReFuel a three year research project (2009-2011) goal utilize the
S Sähkön jakelu ja markkinat S Electricity Distribution and Markets
 S-18.3153 Sähkön jakelu ja markkinat S-18.3154 Electricity Distribution and Markets Voltage Sag 1) Kolmivaiheinen vastukseton oikosulku tapahtuu 20 kv lähdöllä etäisyydellä 1 km, 3 km, 5 km, 8 km, 10 km
HPV ja irtosolututkimukset, kliinikon näkökulma. Pekka Nieminen Dosentti Klinikkaylilääkäri HYKS, naistentaudit
 HPV ja irtosolututkimukset, kliinikon näkökulma Pekka Nieminen Dosentti Klinikkaylilääkäri HYKS, naistentaudit Human Papilloma Virus DNA-virus Ilman HPV:tä ei synny kohdunkaulan syöpää Harald zur Hausen,
Salasanan vaihto uuteen / How to change password
 Salasanan vaihto uuteen / How to change password Sisällys Salasanakäytäntö / Password policy... 2 Salasanan vaihto verkkosivulla / Change password on website... 3 Salasanan vaihto matkapuhelimella / Change
ATMP-valmisteet ja Fimean rooli ATMP-valvonnassa Suomessa ja EU:ssa
 ATMP-valmisteet ja Fimean rooli ATMP-valvonnassa Suomessa ja EU:ssa Heli Suila, FT Erikoistutkija, BIO-jaosto Farmaseuttis-biologinen-yksikkö Lääkevalmisteiden arviointi Fimea Pitkälle kehitetyn terapian
Ostamisen muutos muutti myynnin. Technopolis Business Breakfast 21.8.2014
 Ostamisen muutos muutti myynnin Technopolis Business Breakfast 21.8.2014 Taking Sales to a Higher Level Mercuri International on maailman suurin myynnin konsultointiyritys. Autamme asiakkaitamme parantamaan
Skene. Games Refueled. Muokkaa perustyyl. napsautt. @Games for Health, Kuopio. 2013 kari.korhonen@tekes.fi. www.tekes.fi/skene
 Skene Muokkaa perustyyl. Games Refueled napsautt. @Games for Health, Kuopio Muokkaa alaotsikon perustyyliä napsautt. 2013 kari.korhonen@tekes.fi www.tekes.fi/skene 10.9.201 3 Muokkaa Skene boosts perustyyl.
Information on Finnish Language Courses Spring Semester 2018 Päivi Paukku & Jenni Laine Centre for Language and Communication Studies
 Information on Finnish Language Courses Spring Semester 2018 Päivi Paukku & Jenni Laine 4.1.2018 Centre for Language and Communication Studies Puhutko suomea? -Hei! -Hei hei! -Moi! -Moi moi! -Terve! -Terve
PULLO PÄIVÄSSÄ RIITTÄÄ. Tee tilaa. kolesterolia alentavalle täydennykselle potilaittesi ruokavalioon
 PULLO PÄIVÄSSÄ RIITTÄÄ Tee tilaa kolesterolia alentavalle täydennykselle potilaittesi ruokavalioon Lähteet 1. Catapano et al. ESC/EAS Guidelines for the management of dyslipidaemias. Atherosclerosis 2016;
Mikä puuttuu. potilaasi kolesterolia alentavasta ruokavaliosta?
 Mikä puuttuu potilaasi kolesterolia alentavasta ruokavaliosta? Alentaa 1-4 kolesterolia todistetun tehokkaasti Terveysvaikutteiset elintarvikkeet, joihin on lisätty kasvistanolia*, tarjoavat tehokkaan
The Viking Battle - Part Version: Finnish
 The Viking Battle - Part 1 015 Version: Finnish Tehtävä 1 Olkoon kokonaisluku, ja olkoon A n joukko A n = { n k k Z, 0 k < n}. Selvitä suurin kokonaisluku M n, jota ei voi kirjoittaa yhden tai useamman
TIEKE Verkottaja Service Tools for electronic data interchange utilizers. Heikki Laaksamo
 TIEKE Verkottaja Service Tools for electronic data interchange utilizers Heikki Laaksamo TIEKE Finnish Information Society Development Centre (TIEKE Tietoyhteiskunnan kehittämiskeskus ry) TIEKE is a neutral,
Mitä uu'a menopaussin hormonihoidosta?
 Mitä uu'a menopaussin hormonihoidosta? Tomi Mikkola! Helsinki University Central Hospital! Department of Obstetrics and Gynecology! Helsinki, Finland!! Hormonihoito - Heilurin liike Government Labels Estrogen
Nuku hyvin, pieni susi -????????????,?????????????????. Kaksikielinen satukirja (suomi - venäjä) (www.childrens-books-bilingual.com) (Finnish Edition)
 (www.childrens-books-bilingual.com) (Finnish Edition)") Nuku hyvin, pieni susi -????????????,?????????????????. Kaksikielinen satukirja (suomi - venäjä) (www.childrens-books-bilingual.com) (Finnish Edition) Click here if your download doesn"t start automatically
Nuku hyvin, pieni susi -????????????,?????????????????. Kaksikielinen satukirja (suomi - venäjä) (www.childrens-books-bilingual.com) (Finnish Edition) Click here if your download doesn"t start automatically
Guideline on Similar biological medicinal products containing biotechnology-derived proteins as active substance: non-clinical and clinical issues
 Guideline on Similar biological medicinal products containing biotechnology-derived proteins as active substance: non-clinical and clinical issues EMA Workshop on Biosimilars, 31 October 2014 Pekka Kurki
AYYE 9/ HOUSING POLICY
 AYYE 9/12 2.10.2012 HOUSING POLICY Mission for AYY Housing? What do we want to achieve by renting apartments? 1) How many apartments do we need? 2) What kind of apartments do we need? 3) To whom do we
The role of 3dr sector in rural -community based- tourism - potentials, challenges
 The role of 3dr sector in rural -community based- tourism - potentials, challenges Lappeenranta, 5th September 2014 Contents of the presentation 1. SEPRA what is it and why does it exist? 2. Experiences
Tupakkapoliittisten toimenpiteiden vaikutus. Satu Helakorpi Terveyden edistämisen ja kroonisten tautien ehkäisyn osasto Terveyden edistämisen yksikkö
 Tupakkapoliittisten toimenpiteiden vaikutus Satu Helakorpi Terveyden edistämisen ja kroonisten tautien ehkäisyn osasto Terveyden edistämisen yksikkö Päivittäin tupakoivien osuus (%) 1978 2006 % 50 40 30
Bounds on non-surjective cellular automata
 Bounds on non-surjective cellular automata Jarkko Kari Pascal Vanier Thomas Zeume University of Turku LIF Marseille Universität Hannover 27 august 2009 J. Kari, P. Vanier, T. Zeume (UTU) Bounds on non-surjective
ELEMET- MOCASTRO. Effect of grain size on A 3 temperatures in C-Mn and low alloyed steels - Gleeble tests and predictions. Period
 1 ELEMET- MOCASTRO Effect of grain size on A 3 temperatures in C-Mn and low alloyed steels - Gleeble tests and predictions Period 20.02-25.05.2012 Diaarinumero Rahoituspäätöksen numero 1114/31/2010 502/10
METELI-projekti lopetuskokous 12.4.2005
 METELI-projekti lopetuskokous 12.4.2005 -hankkeen tavoite -keskeiset tulokset, kliininen ja kineettiset kokeet -johtopäätökset Hankkeen tavoite Tuottaa tietoa antioksidatiivisesti vaikuttavien, terveysvaikutteisten