Methanol Production via CO2 Hydrogenation
|
|
|
- Teemu Pentti Sipilä
- 6 vuotta sitten
- Katselukertoja:
Transkriptio
1 Methanol Production via CO2 Hydrogenation Eero Vesterinen Supervisor: Prof. Martti Larmi Advisor: M.Sc. Mohamed Magdeldin Aalto University School of Engineering Thesis submitted for examination for the degree of Master of Science in Technology. Espoo
2 Author Eero Vesterinen Title of thesis Methanol Production via CO 2 Hydrogenation Master programme Energy Technology Thesis supervisor Professor Martti Larmi Thesis advisor M.Sc. Mohamed Magdeldin Code ENG21 Date Number of pages Language English Abstract Renewable and sustainable solutions in energy and transportation sector are under vast research and development to mitigate anthropogenic emissions and climate change. Alternative fuels to replace the conventional fossil fuel based ones play an essential role to reduce the environmental impact in transportation. Methanol production based on renewable energy provides an interesting option in sustainable fuel production industry. In addition, methanol is extensively applied as a base component in chemical industry. The first part of this thesis provides a literature review on pathways and equipment in methanol production. The second part focuses on a simulation of a methanol production process modelled in Aspen Plus software. A complete process configuration from CO 2 extraction from ambient air and hydrogen production by water electrolysis to methanol synthesis via CO 2 hydrogenation is included in the model. The results are analyzed focusing on viewpoints on material and energy consumption and process optimization. The material and energy requirements in the considered scale ( t of methanol per year) are substantially large especially if considering renewable energy sources exclusively. However, optimization of the processed streams could largely reduce the material consumption. A major share of the electricity consumption is induced by the hydrogen production step. Thus, (at least partial) hydrogen feedstock and/or electricity from other sources is suggested. Heat integration of the plant is investigated applying Aspen Energy Analyzer. The heating requirements of the entire process could be fulfilled with optimized heat integration and purge combustion in the synthesis/distillation step. However, the large amount of purges result in a relatively low carbon conversion rate (76,7 %). In general, the plant performance seems to be reasonable considering key values in efficiency (energy efficiency on LHV basis is 43,1 % and on HHV basis 50,0 %). Keywords methanol, CO 2 hydrogenation, CO 2 capture from ambient air, water electrolysis, Aspen, simulation
3 Tekijä Eero Vesterinen Työn nimi Metanolin tuotanto hiilidioksidin hydrauksella Maisteriohjelma Energy Technology Koodi ENG21 Työn valvoja professori Martti Larmi Työn ohjaaja diplomi-insinööri Mohamed Magdeldin Päivämäärä Sivumäärä Kieli englanti Tiivistelmä Uusiutuvat ja kestävät ratkaisut ovat energiantuotanto- ja liikennesektorilla laaja-alaisen tutkimus- ja kehitystyön kohteena ihmisperäisten päästöjen ja ilmastonmuutoksen hillitsemiseksi. Vaihtoehtoiset polttoaineet perinteisten fossiilisten polttoaineiden korvaamiseksi ovat olennaisessa asemassa liikenteen ympäristövaikutusten vähentämiseksi. Metanolin tuotanto uusiutuvan energian avulla on mielenkiintoinen ala kestävässä polttoaineteollisuudessa. Lisäksi metanolia hyödynnetään laajalti peruskemikaalina kemian tekniikassa. Työn ensimmäinen osa sisältää kirjallisuuskatsauksen metanolin tuotannossa käytetyistä menetelmistä ja laitteistoista. Toinen osa keskittyy Aspen Plus ohjelmistolla tehtyyn simulaatioon metanolin tuotannosta. Malli sisältää koko prosessiketjun hiilidioksidin talteenotosta ilmasta ja vedyntuotannosta vesielektrolyysin avulla synteesiin hiilidioksidin hydrauksella. Tulosten analysointi keskittyy näkökulmiin materiaalien ja energian kulutuksesta, sekä prosessioptimoinnista. Prosessin materiaali- ja energiavaatimukset ovat huomattavia valitussa skaalassa ( tonnia metanolia vuodessa) mikäli tarvittava energia olisi uusiutuvin keinoin tuotettua. Käytettyjen materiaalivirtojen optimointi kuitenkin pienentää suuressa määrin raakaaineiden kulutusta. Selkeästi suurin osa sähköntarpeesta on peräisin vedyntuotantovaiheesta. Täten (ainakin osittainen) muualta saatu vety- ja/tai sähkövirta olisi suositeltua. Prosessin lämmönsiirtoverkon optimointia tutkittiin Aspen Energy Analyzer työkalun avulla. Koko prosessin lämmöntarve pystytään täyttämään optimoidun lämmönsiirtoverkon ja synteesi-/tislausvaiheen ylijäämien polton avulla. Suuri ylijäämävirta kuitenkin johtaa suhteellisen alhaiseen prosessin hiilen konversioarvoon (76,7 %). Yleisesti ottaen prosessin tehokkuuden avainluvut ovat hyväksyttäviä (energiatehokkuus alemman lämpöarvon perusteella 43,1 % ja ylemmän lämpöarvon perusteella 50,0 %). Avainsanat metanoli, hiilidioksidin hydraus, hiilidioksidin talteenotto ilmasta, vesielektrolyysi, Aspen, simulaatio
4 Foreword This master s thesis was conducted as part of research in the Department of Energy Technology in Aalto University, Finland. I would like to thank professor Martti Larmi for his guidance and providing this interesting subject for the thesis, M.Sc. Mohamed Magdeldin for his sincere help and support and professor Annukka Santasalo-Aarnio for her comments and feedback. In addition, I would like to thank my friends, family and fellow students for being there and making this time spent in university a lot easier. Espoo Eero Vesterinen
5 Table of contents 1 Introduction Pathways in methanol production Carbon dioxide hydrogenation Carbon dioxide extraction Carbon dioxide capture from ambient air Sorbents Hydrogen production Alkaline electrolysis Polymer electrolyte membrane electrolysis Solid oxide electrolyser cells Conversion from methane Two-stage conversion Methane-syngas Steam methane reforming Dry methane reforming Autothermal reforming Partial oxidation of methane to syngas Methanol hydrogenation from syngas Direct oxidation Heterogeneous oxidation Homogeneous gas phase oxidation Aqueous homogeneous oxidation Other methanol production methods Carbon dioxide capture from air and direct conversion to methanol....11
6 2.4.2 Bio-catalysis Equipment for methanol synthesis and distillation Synthesis reactors Packed bed reactors Two-stage catalyst bed reactor Fluidized bed membrane reactor Coated catalytic reactors Distillation Modelling approach Description Carbon dioxide extraction Hydrogen production Methanol synthesis and distillation Validation Results Carbon dioxide extraction Hydrogen production Methanol synthesis and distillation Process optimization Power consumption Summary of plant performance Material consumption Energy consumption Suggestions Conclusion..44
7 7 References...46 Appendix 1 Error analysis for determining the synthesis reaction rates Appendix 2 Stream data for the CO2 capture process extracted from the Aspen Plus model Appendix 3 Stream data for the methanol synthesis and distillation processes extracted from the Aspen Plus model
8 List of figures Figure 2.1: Primary pathways in renewable methanol production.2 Figure 2.2: The operational principles of alkaline electrolysis...6 Figure 3.1: Simplified typical process configuration for methanol synthesis..13 Figure 3.2: Typical packed bed reactor design.14 Figure 3.3: Lurgi MegaMethanol two-stage process design.15 Figure 4.1: A simplified illustration of the CO2 capture process..19 Figure 4.2: Aspen flowsheet of the CO2 capture process Figure 4.3: The electrolyser process configuration..23 Figure 4.4: Aspen flowsheet for the water electrolysis in hydrogen production..25 Figure 4.5: Aspen flowsheet of the synthesis and distillation processes..28 Figure 5.1: Illustrated definition for the considered mass balance boundaries 39
9 List of tables Table 4.1: The main units in the CO2 capture process 20 Table 4.2: Key figures for model validation...29 Table 4.3: List of the separator blocks in the model...30 Table 5.1: Key input and output figures for the CO2 capture process.31 Table 5.2: Composition of the produced CO2 stream..32 Table 5.3: Key input and output figures for the hydrogen production process...33 Table 5.4: Key input and output figures for the methanol synthesis process..34 Table 5.5: Key input and output figures for the distillation process Table 5.6: Composition of the produced methanol..36 Table 5.7: Energy analysis results 37 Table 5.8: Electricity loads in different parts of the process 38 Table 5.9: Flow rates in the mass balance 39 Table 5.10: Mass balance inputs, outputs and conversion ratios for different process steps...40 Table 5.11: Shares in the energy efficiency calculations.41 Table 5.12: Comparison of key energy consumption values...42
10 Abbreviations CAMERE DC DMFC Methanol synthesis process applying carbon dioxide hydrogenation via reverse water-gas shift reaction Direct current Direct methanol fuel cell ENRTL-RK Electrolyte non-random two-liquid Redlich-Kwong HHV LHV MeOH MOF PEM PSRK rwgs SOEC STP Higher heating value Lower heating value Methanol Metal-organic frameworks Polymer electrolyte membrane Predictive Soave-Redlich-Kwong Reverse water-gas shift Solid oxide electrolyser cell Standard temperature and pressure Symbols ΔHR,298K Nm 3 Reaction heat in standard conditions Newton cubic metre
11 1 Introduction Climate change and diminishing fossil resources are globally increasing environmental awareness and interest in renewable and sustainable solutions. Low-emission technologies substituting the conventional fossil fuel-based methods are in an essential role in mitigating anthropogenic environmental impact. A major share of the greenhouse gas emissions originate from energy production and transportation. Thus, alternative fuels for replacing the traditional fossil fuels applied in transportation are under vast research and development. Among these, renewable methanol is one of the most promising options in sustainable fuel production industry. The role of renewable methanol production may be different depending on the source of the renewable electricity and feedstocks applied in the process. Considering fluctuating electricity sources such as solar and wind power, large amounts of produced electricity are occasionally curtailed as a surplus electricity when the demand is low. Thus, methanol production may be applied as an energy storage method to compensate the differences between demand and supply. However, dynamic operation of a methanol production plant may not be feasible and electricity storage or additional electricity from the grid would probably be required. Considering steadystate renewable energy sources such as geothermal energy, methanol production is a valid application for fuel production exploiting conventional process equipment. Methanol (CH3OH) is the simplest form of alcohols. In STP conditions, it is a clear liquid-state chemical (boiling point at 64,7 o C and melting point at -97,7 o C). As a liquid-state chemical, methanol may be feasibly stored and transported with the existing infrastructure. The primary applications for methanol cover three different categories: exploitation as a fuel, raw material feedstock for synthetic hydrocarbons and electricity production in a direct methanol fuel cell (DMFC). In fuel applications, methanol may be blended with gasoline. However, both the volumetric and specific energy densities of methanol are approximately half of those for gasoline and diesel. (Olah, 2005) This thesis consists of two major parts. First, a literature review about different methanol production methods and equipment is provided. The second part of the thesis provides an investigation about a simulation modelled with Aspen Plus software. The model includes an entire methanol production process via carbon dioxide hydrogenation. The investigated process covers the whole production scheme from CO2 extraction and hydrogen production finally resulting in distilled high purity methanol. The results are analysing the feasibility of the process together with energy efficiency and mass balance calculations. 1
12 2 Pathways in methanol production This chapter introduces several methanol production processes. In addition, carbon dioxide extraction and hydrogen production processes are examined as methanol production via CO2 hydrogenation is the focus in this study. The primary processes applied in methanol production are hydrogenation from syngas, reductive conversion of CO2 with hydrogen and direct oxidative conversion of methane. For the last few decades, practically every commercial application for methanol production has been operated applying a two-stage process where natural gas (essentially methane) was first converted to syngas and then to methanol. (Gesser et al. 1985) The syngas has traditionally been obtained by coal gasification but steam methane reforming of natural gas is currently the most applied method in syngas production. However, any material containing coal may be applied as a feedstock for methanol production. (Frilund 2016) (Olah 2005) In renewable methanol production, similar pathways may be followed. The primary processes for renewable methanol production are introduced in Figure 2.1. In general, carbon and hydrogen feedstocks are required in any methanol production process. Renewable carbon feedstocks provide options for production of syngas and/or pure CO2. Hydrogen may be produced in several methods such as natural gas reforming and water splitting methods such as electrolysis. (DOE) Considering sustainable hydrogen production, electricity from renewable sources is typically applied in water electrolysis resulting in pure hydrogen and oxygen streams. (Galindo Cifre, Badr 2007) Figure 2.1. Primary pathways in renewable methanol production. (Galindo Cifre, Badr 2007) 2
13 2.1 Carbon dioxide hydrogenation In carbon dioxide hydrogenation, methanol is produced applying pure CO2 and H2 streams as feedstock. Methanol production from pure CO2 feedstock follows three primary reactions. In addition to the CO2 hydrogenation reaction, the reverse water gas-shift reaction is present resulting in carbon monoxide and water. The produced carbon monoxide is further hydrogenated into methanol via another hydrogenation reaction. The reaction rates are dependent on the applied catalyst and operational conditions. (Frilund 2016) The three primary reactions occurring in carbon dioxide hydrogenation to methanol are: CO2 hydrogenation: CO2 + 3 H2 CH3OH + H2O ΔHR,298K = -49,5 kj/mol (Eq. 2.1) Reverse water-gas shift: CO2 + H2 CO +H2O ΔHR,298K = 41,0 kj/mol (Eq 2.2) CO hydrogenation: CO + 2 H2 CH3OH ΔHR,298K = -90,5 kj/mol (Eq 2.3) (Frilund 2016) Additionally, an approach to methanol production from CO2 is the CAMERE process where methanol is produced via CO2-to-CO process. However, this process is proven to be less energyand economically efficient than the direct hydrogenation of CO2. As seen in the CO2 hydrogenation reaction, one third of the hydrogen is converted into water, thus resulting in a large non-desirable by-product yield. (Frilund 2016) Carbon dioxide extraction Stationary applications such as (especially fossil fuel -based) energy production and cement industry are among the largest contributors for anthropogenic CO2 emissions, in addition to mobile sources such as transportation. (EPA) Consequently, CO2 capture applications are principally located along major point sources such as fossil fuel -fired power plants and cement production facilities. Pre-, oxy- and post-combustion capture processes are the three most mature methods for CO2 capture considering power plants. (Leung et al. 2014) In cement industry, post-combustion and oxy-combustion processes are the most promising applications as pre-combustion techniques are too impractical to be applied in the phase (limestone conversion to calcium oxide) in which most of the CO2 is emitted. (Meunier et al. 2014) Various other methods have been developed to produce a pure CO2 stream, as well. Considering this research, CO2 capture from ambient air provides interesting possibilities as such applications may be situated in any location. Consequently, direct air capture equipment may be connected with the primarily discussed power sources, solar and wind power, which are often dependent on the location. 3
14 Carbon dioxide capture from ambient air CO2 capture from ambient air provides several desirable possibilities in producing a CO2 feedstock and reducing the CO2 content in the atmosphere. The method is unrestricted considering location as CO2 emissions are rapidly mixed with air and diluted and conveyed around the globe. As a last resort capture method ignoring the source of emissions, direct air capture is mitigating the fundamental problem of increase in the greenhouse gas concentrations in the atmosphere and even reducing the effect of past emissions. Additionally, atmospheric carbon dioxide may be considered as an abundant feedstock. (Lackner 2009) The price estimations in literature for direct air capture of CO2 largely differ from each other and the method is often discussed not to be economically feasible. However, various sources provide an estimation that is competitive with the average price for CO2 extracted with conventional methods. (Sanz-Pérez et al. 2016) The process applied as the fundamental scheme for this research provided by Keith et al. (2018) is estimated to result in a cost of USD/t of CO2 depending on the configuration and possible operational connections in the complete plant design Sorbents Several sorbent types have been proven to be appropriate for CO2 capture in various, fossil-fuel based flue gas, applications. However, the CO2 concentration in atmosphere is naturally much lower than in the flue gases from fossil fuel combustion. A large share of the sorbents designed for flue gas cleaning offer a poor performance when the CO2 concentration is reduced. Among the applied sorbents in CO2 extraction, chemisorbents such as calcium hydroxide, sodium hydroxide and potassium hydroxide provide the best efficiency when processing a feedstock of low CO2 concentration. (Sanz-Pérez et al. 2016) Most of the current direct air capture applications are applying sodium hydroxide as a sorbent. Such configurations are employing or variating the Kraft process that has been exploited, originally by paper industry, since the late 19th century. Applications utilizing potassium hydroxide as a sorbent follow similar methods to the NaOH processes. In a technical viewpoint, the only major difference is to apply KOH and K2CO3 instead of NaOH and Na2CO3 in the carbon capture loop. The carbonate compound is then reacting with calcium hydroxide (Ca(OH)2) to form calcium carbonate (CaCO3) which is heated to release the captured CO2. The remaining calcium oxide (CaO) is then reacting with steam to obtain the required calcium hydroxide. (Sanz-Pérez et al. 2016) Potassium-based configurations provide a decrease in the sorbent regeneration temperature compared to processes applying sodium hydroxide as a sorbent. (Goeppert et al. 2012) Aqueous amine solutions are among the most traditional sorbents applied in gas phase CO2 separation from sources with high CO2 concentration. For direct air capture of CO2, solidsupported amine sorbents are currently the most studied materia. The chemical reaction between CO2 and the amines creates strong bonds and allows high uptake rates when processing gas streams of low CO2 concentration. Consequently, these organic-inorganic hybrid sorbents provide high selectivity and heat of sorption towards CO2, thus being favourable for direct CO2 capture from ambient air. (Sanz-Pérez et al. 2016) Poly(ethylenimine) has been the sorbent under primary research focus. It is an amine-containing polymer providing a large density of amine groups and desirable stability under temperature swing 4
15 adsorption and vacuum swing adsorption conditions, Typically, poly(ethylenimine) is applied as oxide compounds to achieve higher stability considering sorbent recycling and thermal conditions. Several studied silica-based sorbents with different (33 %-50 %) poly(ethylenimine) loads provided the best CO2 uptake values at temperatures similar to atmospheric conditions (max. 50 o C). The CO2 capture potential of these sorbents drastically decreased with increased temperatures. (Sanz-Pérez et al. 2016) In addition to temperature, the moisture of the processed air has an impact on the efficiency of poly(ethylenimine) sorbents. Typically, the CO2 adsorption potential of amines increases in the presence of water by allowing bicarbonates to formate. However, the effect of moisture variates depending on the poly(ethylenimine) concentration in the sorbent. In a study performed by Goeppert et al. (2011), a sorbent of 33 % poly(ethylenimine) concentration increased its CO2 adsorption rate when increasing the moisture in the processed air. On the contrary, the CO2 adsorption rate of a sorbent of 50 % poly(ethylenimine) concentration decreased with higher moisture content in the processed air. (Goeppert et al. 2011) Metal-organic frameworks (MOFs) have been applied in CO2 adsorption, as well. Shekhah et al. (2014) proposed a novel recyclable MOF composition that provides high adsorption capacity and selectivity towards CO2 in both low and high CO2 concentrations, thus being suitable for air capture applications. Additionally, this MOF sorbent indicated no decrease in performance when studied with increased humidity levels. 2.2 Hydrogen production The methods in conventional hydrogen production are primarily based on fuel processing technologies. The typical processing methods apply reforming or gasification technologies, reforming of hydrocarbons (mainly steam reforming of methane) being the most exploited process. Considering low emission hydrogen production, water electrolysis coupled with renewable electricity is typically applied. (Holladay et al. 2009) In water electrolysis, the water molecules are split with the aid of an electrical current following the simple overall reaction: H2O H2 + 1/2 O2 ΔHR,298K = -288 kj/mol (Eq. 2.4) (Holladay et al. 2009) The most applied process for water electrolysis is alkaline electrolysis that has been in commercially available for several decades. Additionally, polymer electrolyte membrane (PEM) electrolysers are applied in commercial installations. Along with PEM electrolysis, anion exchange membrane electrolysis is under research and development. For steam electrolysis, solid oxide electrolysis cells (SOEC) are under research, as well. (Mergel et al. 2013) 5
 to the anode side where they react into oxygen, water and electrons. (Mergel et al.")
16 2.2.1 Alkaline electrolysis In alkaline electrolysis, water is typically fed to the electrolyser on the cathode side where it splits into hydrogen and hydroxide ions. The hydroxide ions are transported through a liquid alkaline electrolyte (typically an aqueous KOH solution) to the anode side where they react into oxygen, water and electrons. (Mergel et al. 2013) The operational principles of alkaline electrolysis are introduced in Figure 2.2. Figure 2.2. The operational principles of alkaline electrolysis. (Mergel et al. 2013) Typical energy requirements and current densities in alkaline electrolysis range between 4-5 kwh/nm 3 of H2 and 0,2-0,4 A/m 2. The operational temperature ranges between o C. Higher efficiencies and more reliable operation may be achieved in higher temperatures. (Mergel et al. 2013) Alkaline electrolysers have proven to successfully operate at intermittent loads. The electrolyser power may be relatively effortlessly adjusted by adapting the current density. However, sideelectrolysis phenomenon determines a certain minimum load for every alkaline electrolyser. Depending on the electrolyser type, the minimum load is usually estimated to be % under which the side-electrolysis may not be neglected. Additionally, alkaline electrolysers do not react instantaneously to load changes and discontinuous operation may conduct some additional degradation of the equipment. (Mansilla et al. 2011) 6
17 2.2.2 Polymer electrolyte membrane electrolysis In polymer electrolyte membrane (PEM) electrolysis, water is split into oxygen, protons and electrons by applying a DC voltage that is higher than the thermoneutral voltage of the electrolyser. Typically, water is fed to a PEM electrolyser on the anode side. (Mergel et al. 2013) The oxygen is collected from the anode side and the protons pass through the electrolyte membrane to combine with electrons to form hydrogen on the cathode side. Thus, the PEM electrolysis process is similar, but reverse, to the process occurring in a PEM fuel cell. (Barbir 2005) PEM electrolysers are argued to reach higher performance in a dynamic operational context than the more conventional alkaline electrolysers. The solid polymer membrane responds more rapidly to fluctuating input power than the liquid alkaline electrolyte and the normal operational load range of PEM electrolysers is larger than that of alkaline electrolysers. Additionally, the system design is more compact due to the lack of liquid electrolyte and additional equipment required in an alkaline electrolyser system. (Koponen 2015) However, costful components (noble metal catalysts and expensive components such as membranes, current collectors and separator plates) required in the process together with its lower state of development induce high expenses for PEM electrolysers compared to alkaline electrolysers. (Mergel et al. 2013) Solid oxide electrolyser cells Solid oxide electrolyser cells (SOECs) provide a more desirable performance compared to PEM and alkaline electrolysis as it produces a higher chemical reaction rate for hydrogen demanding less electrical energy. SOEC electrolysers operate at higher temperatures than equipment for water electrolysis due to the ceramic components which are conductive only at high temperature levels. Thus, thermal energy is required in addition to the electricity and the processed water is in the form of steam. The high temperature level, especially in the product gases, provides opportunities to utilize the waste heat from the process. A potential option for waste heat recovery is to preheat the feed water by a heat exchanger. (Ni et al. 2008) The primary components of a SOEC consist of two porous electrodes and a dense ionic conducting electrolyte between them. The processed steam is fed to the cathode. Under a required electrical potential, the steam diffuses to the reaction sites and dissociates to hydrogen gas and oxygen ions at the cathode-electrolyte interface. The obtained hydrogen is collected at the cathode surface and the oxygen ions are conducted through the electrolyte to the anode where they are oxidized to oxygen gas. (Ni et al. 2008) 2.3 Conversion from methane Methane is currently the primary carbon feedstock in methanol production. Several pathways for methanol production from methane may be followed. Two-stage conversion from methane is presently the most common method. In addition, direct conversion methods are applied Two-stage conversion At present, the most applied method to produce methanol exploiting a feedstock of natural gas (essentially methane) is via a two-stage conversion process. The first step of the process is to convert the natural gas into syngas. Secondly, methanol is produced from the syngas via 7
18 hydrogenation. The operating temperatures and pressures required for exploiting this process are substantially high. Thus, large amount of energy is required to complete the process. Adding large capital costs for the equipment, the method is economically feasible only for large-scale applications Methane-syngas Various different processes are applied in methane conversion to syngas. The two most common processes in industrial applications are steam methane reforming and (catalytic) partial oxidation. Depending on the process configuration, multiple conversion technologies may be combined to improve the application performance. (Baltrusaitis, Luyben 2015) Steam methane reforming Steam methane reforming is a widely applied syngas generation process with an extensive industrial experience. The process is capable to produce syngas with a high hydrogen content (H2:CO ratio of ~3) which is an advantage considering methanol production industry where similar ratios are required. Steam methane reforming process is largely endothermic and favours high temperature and low pressure conditions. (Baltrusaitis, Luyben 2015) However, the process temperature in steam methane reforming is low compared to other available technologies for syngas generation. (Wilhelm et al. 2001) The primary reaction in steam methane reforming is: CH4 + H2O CO + 3 H2 (Eq. 2.5) Steam-to-methane (H2O:CH4) molar ratios of 3 are typical for steam methane reforming applications. Increasing steam-to-methane feed ratio or/and temperature conduct higher methane conversion rates. (Baltrusaitis, Luyben 2015) The large amount of high temperature steam has high energy requirements and induces corrosion in reactor equipment. Adding the expensive process infrastructure, the syngas process is costful and typically responsible for 60 to 70 % of total methanol production costs. (da Silva 2016) Dry methane reforming Dry methane reforming process provides an end product stream including carbon monoxide and hydrogen in a one-to-one ratio. In the process, methane reacts with carbon dioxide following a primary reaction of: CH4 + CO2 2 CO + 2 H2 (Eq. 2.6) Dry methane reforming process is largely endothermic requiring much additional heating. Similarly to steam methane reforming, methane conversion rate is favoured by increased temperature and low pressure. (Baltrusaitis, Luyben 2015) 8
19 Autothermal reforming In autothermal reforming, an oxygen stream is fed to the reactor inducing a partial oxidation reaction for methane. The heat from this exothermic reaction of is further exploited in to supply the required heat in the endothermic reforming reaction. The autothermal reforming process supports reduction of CO2 emissions due to the lack of external heating equipment. The partial oxidation process conducts a need for larger methane feed and a relatively expensive oxygen feedstock. However, the capital cost for an autothermal reforming unit is typically less expensive than for steam reforming. (Baltrusaitis, Luyben 2015) Partial oxidation of methane to syngas The primary feedstocks for partial methane oxidation processes consist of methane and oxygen. Compared to steam reforming, partial oxidation process produces a syngas stream of lower H2/CO ratio (typically from 1 to 1,6). Catalytic partial oxidation processes typically operate at lower temperatures (below 800 o C) than non-catalytic ones which are operated at temperatures above o C. (Baltrusaitis, Luyben 2015) The primary reaction in partial oxidation of methane to syngas is: CH4 + 1/2 O2 CO + 2 H2 ΔHR,298K = -36 kj/mol (Eq. 2.7) (York et al. 2003) The typical catalysts for partial oxidation process are supported nickel, cobalt, iron or noble metal, and transition metal carbide compounds. For oxidative methane-syngas conversion, two general methods have been studied over metal catalysts: Combustion and reforming reactions mechanism, which is an indirect conversion mechanism in which methane is first totally combusted and steam and dry reforming reactions are added downstream in the process Direct partial oxidation mechanism, which is a direct oxidation mechanism in which surface carbon and oxygen compounds form the primary products (York et al. 2003) Methanol hydrogenation from syngas Syngas refers to a mixture of hydrogen, carbon monoxide and carbon dioxide. When applied as a feedstock for methanol production, the composition of the syngas has an explicit impact on the reaction kinetics and resulting yields from the process. Methanol hydrogenation from syngas follows the same primary reactions as methanol production via CO2 hydrogenation (Eq ). The process is rather sensitive to various parameters such as thermodynamic conditions and the CO2 concentration of the syngas. Thus, specific catalysts and recycling of the unreacted gases are typically required to reach desirable methanol yields. Low-temperature catalysts are among the primary research subjects in the field. (Frilund 2016) 9
20 High CO2 concentration: Water-gas shift reaction progresses only in reverse direction, reducing the amount of CO2 and increasing the water concentration. Low methanol yields and extremely poor methanol selectivity. Moderate CO2 concentration: Forward water-gas shift reaction active. High CO2 hydrogenation rate. Selectivity to methanol slightly decreased and water production net rate slightly increased. Low CO2 concentration: Limited methanol formation. Water-gas shift reaction active in forward direction. Very low CO2 concentration: Catalytic activity significantly reduced. Increased potential for catalyst deactivation, carbon deposition and/or catalyst oxide reduction. (Lee, Sardesai 2005) Co-production of methanol and dimethyl ether may significantly increase the reactor productivity. Dual catalysts designed for this co-production process perform high activities and reduced deactivation potential. (Lee, Sardesai 2005) Direct oxidation The two-stage conversion of methane to methanol is still the dominant process in methanemethanol applications but direct oxidation of methane provides several advantages over the twostage process. Direct oxidation of methane to methanol is more energy-efficient compared to twostage conversion via syngas, and results in a liquid methanol yield in only one step. The main reaction in this process is the following: CH4 (g) + 1/2 O2 (g) CH3OH (l) ΔHR,298K = -30,7 kcal (Eq. 2.8) (Gesser et al. 1985) The reaction may be executed in both gas and liquid phases. (Zakaria, Kamarudin 2016) The direct methane-to-methanol oxidation process has been under vast research over the last century. However, the conversion rate and selectivity for methanol have remained as a challenge. (Han et al. 2016) The main approaches in the research for direct methane oxidation are conversion process techniques in low temperature and pressure conditions, and different catalyst applications Heterogeneous oxidation In heterogeneous methane-methanol oxidation, a catalyst (typically a transition metal oxide compound) is added to support the conversion process. The most widely studied catalysts are based on molybdenum trioxide and iron compounds. (Han et al. 2016) 10
21 Homogeneous gas phase oxidation In addition to catalytic processes, direct oxidation of methane to methanol may be achieved noncatalytically via homogeneous oxidation in gas phase. The reaction is fundamentally dependant on the process temperature and pressure. The process initial temperature has to be high enough (above 400 o C) to initiate the oxidation chain reaction, but the equilibrium temperature should be below a certain limit (550 o C) to avoid further oxidation of the oxygenates. High pressure (typically bar) is necessary for decent process conditions. An increase in the process pressure conducts an increase in methanol yield due to the process kinetics and typically reduces the optimal temperature for methanol selectivity. (Han et al. 2016) Aqueous homogeneous oxidation Aqueous homogeneous oxidation is a method applicable for converting methane to methanol resulting in a relatively high end product yield in mild conditions. However, a significant drawback in the process is that a major share of the currently discovered mediums necessary for the applications are strong acids (such as trifluoroacetic acid) and thus corrosive and seriously contaminant. Eliciting a sustainable medium is one of the main research subjects in the process examination. A few environmentally friendly solvents have been proposed and experimentally proven to reach suitable catalytic properties and high selectivity for methanol, but they are still examined only in experimental scale and far from exploitation in industrial applications. (Han et al. 2016) 2.4 Other methanol production methods In addition to the typical methanol production methods, several novel pathways for methanol production are studied. Among these, CO2 capture from air with direct conversion to methanol and bio-catalysis are introduced here Carbon dioxide capture from air and direct conversion to methanol Kothandaraman et al. (2015) studied direct CO2 conversion to methanol over a novel catalyst after capture from ambient air. Instead of poly(ethylenimine), they applied pentaethylenehexamine (PEHA) as an ethereal sorbent. A ruthenium-based catalyst was introduced to convert the reaction mixture to methanol after CO2 capture. The presence of polyamines occasionally deactivate the catalyst in similar processes. However, no significant catalyst deactivation was observed in this process configuration. On the contrary, both the catalyst and PEHA sorbent provided excellent recycling properties. The catalyst performed at 75% of the initial activity after 5 cycles in the hydrogenation process. The examined application seemed to provide efficient results in CO2 hydrogenation from synthetic air, providing methanol at a 79% conversion rate. Applying a triglyme/h2o mixture, process temperature of 155 o C and pressure of 50 bar resulted in a 61 % methanol yield. The 79 % methanol yield was achieved after additional heating. (Kothandaraman et al. 2015) 11
22 2.4.2 Bio-catalysis Direct conversion of methane to methanol may be achieved with the aid of enzyme-catalysed reactions, as well. These natural catalysts are named as methane mono-oxygenase enzymes. The advantages of these enzymes include their high product selectivity and ability to operate in ambient conditions. However, the drawbacks include low activity for methanol production and the requirement for an expensive reductant supply. (Kondratenko et al. 2017) (Zakaria, Kamarudin 2016) Methane mono-oxygenase enzymes may be divided into two subgroups, soluble methane monooxygenase enzymes and particulate methane mono-oxygenase enzymes. Soluble methane monooxygenase enzymes require a nicotinamide adenine dinucleotide reductant as an electron donor in the process but particulate methane mono-oxygenase enzymes may exploit electrons from ubiquinol (coenzyme Q10), as well. (Kondratenko et al. 2017) 12

23 3 Equipment for methanol synthesis and distillation This chapter introduces some of the typical and more novel equipment applied in methanol synthesis and distillation. 3.1 Synthesis reactors Various different reactor types may be applied for methanol production processes. Currently, packed bed reactors are the most employed reactor type for methanol synthesis and may be applied for methanol production from various feedstocks. (Frilund 2016) Fluidized bed membrane reactors are among the more novel reactor types under research. (van der Ham et al. 2012) Typical operating temperatures and pressures in methanol synthesis range between o C and bar. The reaction is regulated by the limits of chemical equilibrium resulting in an incomplete conversion. Thus, the synthesis process configuration typically contains a recycle system for the unreacted components. As the reactor outlet stream is in gaseous phase, the reacted mixture is cooled down before the separation of the recycle stream. The separation is typically performed in a gas-liquid flash separator as the recycled components (primarily COx and H2) are still in a gaseous form and the liquid form product stream (primarily methanol and water) is sent to distillation. (Kiss et al. 2016) A simplified typical synthesis process configuration is introduced in Figure 3.1. Figure 3.1. Simplified typical process configuration for methanol synthesis. 13

24 3.1.1 Packed bed reactors Packed bed reactors, or fixed bed reactors, are tubular reactors containing a bed of solid catalyst. They are designed for heterogeneous catalytic reactions and are applied for gas-solid, liquid-solid and gas-liquid-solid reactions. Packed bed reactors may be applied in either adiabatic or isothermal operation. Isothermal packed bed reactors are typically multitubular to allow higher heat transfer performance and cooled with water. (Frilund 2016) As the synthesis reaction is highly exothermic, effective and continuous heat transfer is required to maintain the desired temperature level. The reactor design largely resembles that of a heat exchanger. (Tijm et al. 2001) A typical packed bed reactor design is introduced in Figure 3.2. Figure 3.2. Typical packed bed reactor design. (The Linde Group 2018) The most employed catalyst for methanol synthesis in packed bed reactors seems to be a Cu/ZnO/Al2O3 -compound. Studt et al. (2014) examined the behaviour of Ni-Ga -based catalysts in a packed bed reactor. The investigated catalysts seem to overcome the conventional Cu/ZnO/Al2O3 -catalysts considering several aspects, especially when operated in temperatures above 220 o C. The primary advantage is that Ni-Ga -catalysts increase the methanol yield by reducing the reverse water-gas shift reaction rate compared to Cu-Zn -catalysts which induce high rates of rwgs. Among the examined Ni-Ga -catalysts, Ni5Ga3/SiO2 is particularly active towards methanol synthesis. Wang et al. (2011) examined various catalysts for CO2 hydrogenation covering a large number of different metal-based catalysts, focusing on variations of Cu-Zn -catalysts. In their research, Cu/pentane/NC-ZnO -compound operated at 450 o C reached the highest CO2 conversion rate (80 %). Additionally, they discovered multiple substances that may be combined with the traditional Cu/ZnO/Al2O3 -catalyst to improve its performance Two-stage catalyst bed reactor Two-stage reactor concepts allow optimizing equipment size by decreasing the recycle ratio and improving heat integration between the two reactor stages. They are typically applied in largescale systems where these properties are important in process optimization. Lurgi MegaMethanol technology provided by Air Liquide Engineering & Construction is among the most applied 14
 examined a two-stage catalyst bed reactor concept corresponding the Lurgi MegaMethanol process.")
25 reactor types in commercial plants. The two-stage Lurgi MegaMethanol process is introduced in Figure 3.3. Figure 3.3. Lurgi MegaMethanol two-stage process design. Rahimpour (2008) examined a two-stage catalyst bed reactor concept corresponding the Lurgi MegaMethanol process. The model seems to overcome the traditional single-bed reactor considering certain attributes. The most desirable advantages compared to the single-bed reactor include more favourable temperature profile, higher conversion rate and longer catalyst lifetime. The first stage of the two-stage model is similar to a conventional water-cooled one-stage reactor, but operated in a higher temperature and high yield. In the second bed, the operating temperature 15
26 continuously reduces to provide an increasing thermodynamic equilibrium potential. The reaction rate is much lower in the second bed inducing less reaction heat that is applied to pre-heat the feed gas to the first bed. Milder temperature profiles in the second bed provide less extreme conditions for the catalysts, thus preventing the catalyst deactivation via sintering. (Rahimpour 2008) Fluidized bed membrane reactor Van der Ham et al. (2012) researched the operation of a fluidized bed membrane reactor in the scale of 10 kt/y methanol production. Additionally, Rahimpour and Alizadehhesari (2008) examined similar processes in their study about two-stage fluidized bed membrane reactor concept, combining some advantages of both two-stage and fluidized bed membrane technologies. In their process configuration, the fluidized bed membrane technology is applied in the second, gas-cooled, reactor while the first reactor remains as a conventional, water-cooled, packed bed reactor. This model seems to result in more preferable heat and mass transfer properties in the reactor. Deactivation of the catalyst is generally a primary issue considering the reactor design, as well. In a fluidized bed membrane reactor, the deactivated catalyst may effortlessly be removed and regenerated. (van der Ham et al. 2012) In their design, van der Ham et al. applied the mentioned Cu/ZnO/Al2O3 -compound in the membrane to operate as a catalyst. The process temperature is optimized to 250 o C. Higher process temperatures would destruct the membranes and lower process temperatures would result in low conversion levels. To control the process temperature, the reactor is applied with a water-cooling system through the reactor walls. (van der Ham et al. 2012) The designed process produces a desirable conversion rate for methanol. Van der Ham et al. report that the membrane type selection and the energy needed for hydrogen compression and CO2 separation as critical process items Coated catalytic reactors Coated catalytic reactors are among the most researched subjects in the field of CO2 hydrogenation to methanol at the moment. These reactors provide potential in improving small-scale renewable methanol synthesis applications. The main difference compared to the conventional reactor types is to apply the catalyst as a porous layer on the walls or other surface structure in the reaction chamber. (Frilund 2016) 3.2 Distillation After methanol synthesis, the resulted crude methanol stream typically contains large amounts of water, some ethanol, dimethyl ether, and other impurities. Thus, distillation is required to reach methanol of high purity level. Methanol concentrations above 99 % may be obtained by applying appropriate distillation equipment. The crude methanol stream contains both low-boiling and high-boiling (boiling points above and below the boiling point of methanol) undesired components. Thus, at least two distillation columns operating at different temperatures are required to remove the impurities. Various distillation processes have been developed depending on the plant configuration but many of them follow a similar path. Typically, the reactor outlet stream is first cooled down to a temperature in which 16
27 methanol is in liquid form. The low-temperature outlet stream is then inserted in a flash block to separate the gaseous components (CO, CO2 and H2) which are further recycled back to the reactor inlet stream. The resulting liquid stream consisting mostly of methanol and water is then processed in distillation and stripper columns to remove the water and other impurities. The typical amount of the columns applied has increased from the past. (Ott et al. 2012) Currently, a standard methanol distillation application consists of three or four columns. Adding more columns to the distillation arrangement increases the capital cost of the equipment. However, the energy savings conduct notable reduction in the operating costs, allowing the more complicated applications to be economically even more feasible. (Sun et al 2012) Distillation requires much energy as the process includes heat and mass transfer of considerable extent. Thus, energy-efficient solutions are desired and possible, typically applying heat recovery between the distillation columns. The energy-efficiency potential seems to increase when adding the number of columns. Novel five-column distillation schemes have been reported to achieve significant energy savings compared to four-column applications. (Sun et al. 2012) (Zhang et al. 2010) Sadeghi and Ahangar (2012) studied a three-column distillation unit in a dynamic operation. Temperature and pressure are the main variables that affect the volatility of the components in the distilled composition. Thus, a reasonable amount of control over the operational variable, especially temperature and pressure, is required to achieve the highest efficiency in the distillation. This is emphasized in dynamic operation. Controlling the variables enhances the system performance, consequently facilitating energy savings and thermal load reductions, as well as decreasing the costs. 17
28 4 Modelling Approach This chapter introduces the model for simulating a methanol production plant via carbon dioxide hydrogenation. In the model, the whole process from CO2 extraction and hydrogen production via CO2 hydrogenation resulting in distilled high purity methanol is covered. With the considered methods, the model is resulting in a novel configuration considering the complete process design. The simulation is conducted applying commercial Aspen Plus V8.8 software. (AspenTech) It provides extensive tools to model chemical processes and their thermodynamic features. The software includes comprehensive background data considering various components and thermodynamic model sets applicable for different types of processes. The examined process is modelled in the software as a flowsheet consisting of suitable block (such as reactors or separators) and stream (such as material or heat) icons. When the required input data is inserted, the software simulates the process considering the given specifications and provides process data such as flow rates and energy requirements. The process behaviour may be examined by various analytical tools such as sensitivity analyses and optimizing variators, as well. The model includes a few Design- Spec blocks which are an example of an analytical tool, iterating a fitting value for the selected input to match the determined specifications for a dependent variable elsewhere in the model. 4.1 Description The simulation is investigating the feasibility of methanol production exploiting electricity from renewable (primarily solar and wind) power sources. The examined process may be divided into three major process blocks in the flowsheet: carbon dioxide extraction, hydrogen production and methanol synthesis together with distillation. The renewable electricity is mainly consumed in the hydrogen production step requiring large amounts of energy. The simulation is performed applying PSRK (predictive Soave-Redlich-Kwong) property method set except the hydrogen production phase where ENRTL-RK (electrolyte non-random two-liquid Redlich-Kwong) is applied due to the presence of electrolyte modelling. PSRK property method allows to model processes where a mixture of non-polar (such as CO2) and polar (such as water) compounds are operated in high temperatures and pressures in adequate accuracy. ENRTL-RK property method provides a comprehensive background for modelling processes including electrolytes and solvents of either high or low concentration. The model is scaled to produce t of 99,6 % purity methanol per year. This corresponds to the initial capacity of Porvoo biodiesel refinery plant operated by Neste Oil when it commenced its operation in (Hydrocarbons Technology) The capacity equals to kg/hr production rate when assuming a typical amount of annual operational hours. 4.2 Carbon dioxide extraction The carbon dioxide extraction is performed by direct air capture, based on a novel configuration provided by Keith et al. (2018). This method is selected as it enables reducing the CO2 content in the atmosphere. Thus, no external CO2 source (conventionally fossil fuel based applications) are not required. Additionally, direct air capture is not restricted considering location and the configuration is applying the same medium (KOH) as the capturing sorbent that is applied as the 18
29 electrolyte in the hydrogen production process introduced in chapter 4.3. The configuration is reported to result in a notable decrease in economical costs compared to the previous cost estimations on direct air capture applications. The process consists of two connected chemical loops applying potassium hydroxide as the capturing sorbent. In the potassium loop, the aqueous potassium hydroxide (KOH) sorbent captures the CO2 from the ambient air blown through the air contactor (block CONTACTO in the flowsheet) resulting in potassium carbonate (K2CO3) and water. The solution is conveyed to the pellet reactor (block PELLETRE ) where the potassium carbonate reacts with calcium hydroxide (Ca(OH)2) forming calcium carbonate (CaCO3) and potassium hydroxide recycled back to the air contactor. The calcium carbonate washer applied after the pellet reactor is modelled as a separator block to simulate the actual performance of the equipment, separating the remaining potassium hydroxide with the water and releasing the gaseous impurities. To release the gaseous CO2, the calciner (block CALCINER ) has to operate at high temperature (in this case, 900 o C). The calcium carbonate stream is first dried and heated to 300 o C applying the heat from the steam slaker. Before the calciner, the stream is still pre-heated in two steps exploiting the heat from the hot CO2 stream. Further heating in the calciner dissociates the compound into calcium oxide and gaseous CO2. The required heat is provided by combustion of methane introduced to the calciner. The resulting calcium oxide (CaO) is transported into the steam slaker (block SLAKER ) where it reacts with added steam to form calcium hydroxide required in the pellet reactor. The simplified process configuration is introduced in Figure 4.1 and the Aspen flowsheet for the CO2 extraction process is introduced in Figure 4.2. Figure 4.1. A simplified illustration of the CO2 capture process. (Keith et al. 2018) The gas turbine system in the design reported by Keith et al. (2018) providing power to the system and a flue gas stream for the CO2 capture equipment is not included to decrease the dependence on fossil fuels and more compact process design. This results in a decrease in the produced CO2. However, the decrease is relatively low compared to the amount of CO2 obtained from the ambient air. Additionally, the CaCO3 loop cycled through the filters and connected to the pellet reactor is ignored for simplification as it does not affect the CaCO3 mass balance in the system. The four main units (air contactor, pellet reactor, calciner and steam slaker) are each modelled as an adiabatic RStoic reactor block. A separator block (Flash2 or Separator) is added after each of 19
30 these units to model the separation of the different product streams. Additionally, the quicklime mix tank is modelled as an RStoic block as the remaining calcium oxide is mixed in it with water to provide the amount of calcium hydroxide required in the pellet reactor. The properties of the main units are introduced in Table 4.1. Table 4.1. The main units in the CO2 capture process. Unit Name Aspen block type T, [ o C] p, [bar] Main reaction, conversion efficiency (Keith et al. 2018) Air contactor Pellet reactor CONTACTO RStoic KOH + CO2 K2CO3 + H2O, 74,5% conversion of CO2 PELLETRE RStoic 20 1 K2CO3 + Ca(OH)2 2 KOH + CaCO3, 90% conv. of Ca(OH)2 Calciner CALCINER RStoic CaCO3 CaO + CO2, 98% conv. of CaCO3 Steam slaker SLAKER RStoic CaO + H2O Ca(OH)2, 85% conv. of CaO The streams LIME-IN and LIME-OUT are representing the aqueous Ca(OH)2 stream introduced to the pellet reactor. The streams are separate to simulate the Ca(OH)2 input to the process, thus being connected in actual system. Similarly, streams SORB-IN and SORB- OUT are representing the sorbent cycle for the air contactor and pellet reactor and connected in actual design. They are left unconnected to maintain a degree of freedom for the model to solve. Compared to the original design by Keith et al. (2018), the heat exchanger network is simplified in the model so that only one heat exchanger per stream is applied. This is done to allow Aspen Energy Analyzer to find the best configuration for heat integration in this design. The energy analysis is introduced in chapter 5.4. The resulting CO2 stream is fed to a 4-stage compressor applied with inter-stage coolers and scrubbers removing most of the moisture in the stream to achieve the desired high purity CO2. The compressor outlet pressure is set to 50 bar to match the reactor pressure in the synthesis phase. The model includes three Design-Spec blocks for determining input values for certain streams to match the operational conditions reported by Keith et al. (2018). Block CH4FLW determines the mass flow rate for the combusted methane to achieve 900 o C operational temperature in the calciner. Block O2FLW determines the mass flow rate for oxygen so that the mass fraction of oxygen in the stream leaving the calciner ( S9 ) equals to the reported value. Block STEAMFLW determines the mass flow rate for steam fed to the slaker to achieve 300 o C operational temperature. 20
31 Figure 4.2. Aspen flowsheet of the CO2 capture process. 22

32 4.3 Hydrogen production The hydrogen production is performed by alkaline water electrolysis that is a well-known process and extensively applied in industrial applications. Electricity as direct current is applied to split water to the high purity hydrogen required in the methanol synthesis and oxygen released as a side product. Similarly to the CO2 extraction model, potassium hydroxide acts as the alkaline in the solution provided to the electrolyser. The electrolyser is modelled based on reported information of equipment (Nel C-300 electrolyser) by Nel Hydrogen (2017). The electrolyser configuration is introduced in Figure 4.3. Figure 4.3. The electrolyser process configuration. (Nel Hydrogen 2017) The aqueous electrolyte mix of 25% KOH concentration is fed to the electrolyser (block ELECTR ) that is modelled as an RStoic reactor block. The product stream leaving the electrolyser enters the H2RCV Flash2 block separating the wet hydrogen stream from the liquid form residual stream consisting mostly of the unreacted aqueous electrolyte and oxygen. The residual stream is then separated in O2RCV separator block to the electrolyte mix that is recycled to the process and high purity oxygen stream. The wet hydrogen is forwarded to GASSCRUB RadFrac block removing major share of the moisture in the gas. The dry hydrogen is then compressed in the COMPRESS multi-stage compressor block to 30 bar pressure. The compressed hydrogen is fed to the deoxidiser unit ( DEOX ) modelled as an RStoic block where the remaining oxygen traces combine with hydrogen resulting in some moisture in the DEOXGAS product stream. The stream is fed to DRYER separator block removing the moisture and providing a high purity hydrogen stream containing only traces of impurities (moisture and oxygen). 23
33 The flowsheet contains two Design-Spec blocks. Block SCRBFLW determines the mass flow rate for the scrubbing water (stream SCRBWT ) so that the temperature in the scrubbed hydrogen stream (stream GAS ) is cooled down to 26 o C before compression. Block DRYFRAC defines the split fraction for moisture in the separator block DRYER so that the moisture resulting in the high purity hydrogen stream PUREHYDR equals to the reported value by Nel Hydrogen (2017). The Aspen flowsheet of the hydrogen production process is introduced in Figure
34 Figure 4.4. Aspen flowsheet for the water electrolysis in hydrogen production. 25
35 4.4 Methanol synthesis and distillation The synthesis process is modelled as a typical methanol synthesis configuration including a recycle loop for the gases remaining unreacted after the reactor. The reactor feed consists of three streams (hydrogen, carbon dioxide and recycle streams) mixed before entering the reactor. The hydrogen stream leaves the hydrogen production process at 30 bar pressure which is increased before mixing in a compressor to 50 bar that is equivalent to the reactor conditions. After mixing, the feed stream is heated to 225 o C before it is fed to the reactor. The methanol synthesis reactor is modelled as an RStoic reactor block (block REACTOR ) representing a typical isothermal fixed bed reactor cooled by an external water stream. After the reactor, the product stream temperature is decreased to 40 o C to achieve liquid form for the components (primarily methanol and water) sent to distillation. The unreacted gaseous components are separated from these in a gas-liquid flash separator operated in 45 bar pressure to maintain system pressure and reduce compression demand and recycled back to the reactor feed stream after purge and compressor. The Aspen flowsheet of the distillation process together with the methanol synthesis process is introduced in Figure 4.5. Three of the primary reactions occurring in methanol synthesis via carbon dioxide hydrogenation are considered in the reactor model. These reactions are CO2 hydrogenation, CO hydrogenation and reverse water-gas shift. Typical side-reactions such as dimethyl ether and ethanol formation are ignored for simplicity and their minor presence in common methanol synthesis reactors. The reaction rates required as an input in the RStoic reactor model are achieved by a sensitivity analysis and comparison with a process configuration provided by Kiss et al. (2016) similar to the examined scheme considering the general design. The operating temperature and pressure are determined to be 250 o C and 50 bar which are similar to the reaction conditions in the configuration by Kiss et al. (2016) and represent typical values found in literature for similar applications. The reaction rates are dependent on the applied catalyst. In the study by Kiss et al. (2016), a fibrous Cu/Zn/Al/Zr catalyst was applied. Thus, the same catalyst is considered in this research. Following reaction rates are applied as input for the reactor block: CO2 hydrogenation: 0.099, reverse water-gas shift: and CO hydrogenation: 1. Thus, CO2 conversion rate (per pass) is defined as 17,6 % which resembles the values reported in the study by Kiss et al. (2016) (17,2 %) and elsewhere in literature. The difference may be explained and is affected by catalyst and equipment selection and other process optimization. All the carbon monoxide produced in the reverse water-gas shift reaction is hydrogenated in the following reaction as there should be no CO make-up in the process. The reaction rates are determined based on a sensitivity analysis comparing the reactor inlet and outlet stream compositions with those of a largely similar scheme reported by Kiss et al. (2016). An error analysis focusing on the differences in CO2 and H2 conversion rates, methanol yield and reactor heat generation per feed mass flow ignoring the non-reactants N2 and O2 is applied as a basis for the selection. A 25 % weight factor is given to each of these error components. The chosen reaction rate values are the ones inducing the smallest error and providing a CO2 conversion rate per pass resembling (<1% difference) the reported value in the compared scheme by Kiss et al. (2016). The error analysis results are presented in Appendix 1. 26
36 The composition of the reactor inlet stream differs to some extent compared to the composition in the background model reported by Kiss et al. (2016). This is primarily due to the presence of nitrogen and oxygen resulting from the methane combustion in CO2 extraction. In actual process, the oxygen in the feed might result in issues such as oxidation reactions in the reactor. This should be considered but is excluded from this study. Hydrogen and carbon dioxide are inserted in the reactor in a 2,99:1 molar ratio (H2:CO2) which is similar to the stoichiometric equilibrium value and values proven to result in efficient conversion rates in literature. (Frilund 2016) (Kiss et al. 2016) The purge in the recycle stream is set to 5 % which is relatively large value for typical synthesis configuration. This is due to the stream convergence calculation performed in Aspen that induces warning/error messages when reducing the purge value. The value could be decreased by a different stream convergence method. In this design, the purges from the recycle loop and first distillation column are combined and combusted in an RStoic reactor block (block BOILER ) to benefit from these large flow rates that would otherwise be considered as losses. The distillation phase is modelled as a typical three-column application. Crude methanol stream is achieved after the first knockout drum (block FL1 ) separating and recycling the unreacted gases. The liquid form crude methanol then enters another knockout drum (block DIST1 ) operated in ambient pressure releasing more of the dissolved and unreacted gases as purge. The second distillation column is modelled with a RadFrac block (block DIST2 ) and separates most of the water in the crude methanol stream. The next RadFrac block (block DIST3 ) is operated as a steam stripper removing a major share of the remaining water and resulting in a high purity methanol stream. The distillation equipment is operated in atmospheric pressure but the steam applied in the last column is inserted in elevated pressure. 27
37 Figure 4.5. Aspen flowsheet of the synthesis and distillation processes. 28
38 4.5 Validation An essential key figure for every process phase is examined and compared to values from studies applied as background/comparison to validate that the simulation model is realistic. These values are introduced in Table 4.2. The values are largely similar to each other but some differences are found primarily due to different process configurations. Proportionally, the largest difference is found in the CO2 extraction process. This may be explained by excluding the external combustion of methane for power generation that is proposed in the original design and provides an increase in obtained CO2 from its flue gases. Table 4.2. Key figures for model validation. Process phase Parameter Simulated value CO2 extraction Produced CO2 / processed air 0, kg/kg H2 production Feed water consumption 0,939 l / Nm 3 H2 Comparison value 0, kg/kg (Keith et al. 2018) 0,9 l / Nm 3 H2 (NEL Hydrogen, 2017) Methanol synthesis Reactor heat generation / feed (ignoring O2 & N2) 128,4 kj/kg 131,3 kj/kg (Kiss et al. 2016) Distillation Methanol purity 0,996 1,00 (Kiss et al. 2016) The main units in CO2 capture, hydrogen production and methanol synthesis are modelled as RStoic reactor blocks. These reactor models consider reaction extent and stoichiometry but reaction kinetics are not inserted. This is assumed to be sufficient for this research as the extent and stoichiometry of the main reactions are achieved from literature and a sensitivity/error analysis introduced in chapter 4.4. The simulation model includes Separator blocks that force the separation of different components in the material stream. Thus, they are not directly representing any actual equipment but may model actual processes in a more simplified manner. In this case, the inserted Separator blocks are applied for simplification to model the reported separations and not impacting the configuration in non-realistic means. The included separator blocks and their operational backgrounds are listed in Table
39 Table 4.3. List of the separator blocks in the model. Block name Process block Modelling purpose SEP1 CO2 capture Separating the sorbent recycle stream SEP2 CO2 capture Imitating the CaCO3 pellet washer separating the solids and aqueous stream containing potassium compound remains and releasing the gases SEP3 CO2 capture Separating the CaCO3 seed stream fed to the pellet reactor O2RCV H2 production Representing the gas/lye separator producing high purity O2 and electrolyte mix recycle streams DRYER H2 production Representing the dryer removing most of the moisture from the H2 product stream 30
40 5 Results This chapter provides the results from the simulation of the considered methanol production process. In addition to the key figures for each process block, the examination of results focuses on calculations about energy and material consumption and viewpoints on process optimization. 5.1 Carbon dioxide extraction The capacity of the examined CO2 extraction process is roughly a quarter of the capacity in configuration reported by Keith et al. (2018) considering both the amount of produced CO2 and processed air. In their report, Keith et al. estimate a minimum capacity of 100 kt/a of CO2 produced to achieve economical feasibility. The configuration in this research requires a production capacity more than 300 kt/a of CO2, thus exceeding the reported value for economically feasible minimum capacity. However, the decrease in capacity is reported to result in higher costs per amount of produced CO2, primarily considering capital cost of the calciner equipment. Key input and output figures for the CO2 capture process are introduced in Table 5.1 and the extracted stream data from Aspen is introduced in Appendix 2. A methane stream is combusted in the calciner to fulfill the heat requirement for the CO2 release and provide an increase in the produced CO2. Similar configuration is introduced in the original report by Keith et al. (2018). Applying renewable-based CH4 should be considered to reduce the dependence on fossil fuels. The amount of required methane is achieved by a Design-Spec block so that the operational temperature in the calciner matches the defined value (900 o C). The value is relatively large, resulting in an issue considering the infrastructure for supplying the required methane. Table 5.1. Key input and output figures for the CO2 capture process. Parameter Value Unit Produced CO2 (from air and CH4 in total) ,4 kg/hr CO2 captured from air ,4 kg/hr Processed air ,1 t/hr Required CH ,6 kg/hr Required O kg/hr Required water 162,0 t/hr An electricity consumption value of 8,84 MW is determined by dividing the reported values with the scale factor added with the value for compressor obtained from Aspen. The configuration in this research differs to some extent from the reported design as some of the equipment from the original design are excluded. Thus, only the electricity consumption from the applied equipment is considered. 31
41 The amount of required water is large. It consists of the water inserted to the knockout drum (block B13 ) together with the water makeup in the steam slaker. In addition to the reported CaCO3 makeup in the filter system connected to the pellet reactor, the CaCO3 seed circulated in the process should not require any additional makeup considering the original design from Keith et al. (2018). In the simulation, stream SEED-OUT is not providing a mass flow rate equal to the stream SEED-IN even though all the CaCO3 remaining from the calciner is separated to it. Thus, an additional makeup of 149,3 kg CaCO3/hr should be considered (in addition to the reported makeup). In the original design, the quicklime is circulating in the process and would not require any makeup besides material degradation. However, the model results for streams LIME-IN and LIME- OUT differ from each other to some extent. The primary differences may be found in the flow rates of water and potassium-based solutions. Thus, some makeup would be required based on the Aspen results. The produced CO2 stream contains some oxygen and nitrogen resulting from the methane combustion in the calciner. Most of the moisture in the stream is removed in the knock-out drum and compressor. However, some moisture still remains in the product stream. The composition of the produced CO2 stream is introduced in Table 5.2. Table 5.2. Composition of the produced CO2 stream. Component Mass fraction CO2 0,964 O2 0,0189 N2 0,0149 H2O 0, Hydrogen production The required amount of hydrogen to reach the considered methanol production capacity equals to 5 066,5 kg/hr or Nm 3 /hr. This corresponds to 190,4 times the production capacity (300 Nm 3 /hr) of the Nel C-300 electrolyser applied as a background for the model. (Nel Hydrogen 2017) The requirement for the added water flow equals to the amount of split water in the electrolyser as only oxygen is released as a side product and the potassium hydroxide is recycled. The required amount of water flow added in the system may be attained by the difference between the electrolyser inlet stream and the recycle stream and equals to kg/hr. Key input and output figures for the hydrogen production process are introduced in Table 5.3. The electricity consumption of hydrogen production in an electrolyser is substantially large as the process is essentially based on electrical current. The reported DC power consumption of the electrolyser is 3,8-4,4 kwh/nm 3. (Nel Hydrogen 2017) Thus, the power requirement for the 32
42 considered hydrogen production process lies in the range between MW. The applied pressure for hydrogen leaving the electrolyser is lower of the reported two values (30 bar/200 bar). The report by Nel Hydrogen (2017) does not explicitly define the sources for the power demand (e.g. if compressor power demand is included). The power consumption value is assumed to equal to 217 MW which is similar to the power consumption of the electrolyser and the compressor provided by the Aspen simulation (203,77 MW + 11,1 MW = 214,87 MW). The plant scale is substantially large considering that it is in a similar scale to the size of the purposed capacity of the Notodden facility in Norway currently under expansion that would provide a 360 MW annual production capacity, thus being the globally largest electrolyser plant. (Nel Hydrogen 2018) The water flow rates required for the hydrogen production process are very large, consisting of the added water for the electrolyser and scrubbing water for the gas scrubber. The scrubbing water contains relatively low amount of impurities after the scrubbing. Thus, it could be applied to fulfill water requirements in other parts of the process and probably recycled in scrubbing. In the original electrolyser design by Nel Hydrogen (2017), it is applied to provide the fresh water added to the electrolyte mix. The utilization of scrubbing water should be further examined as the flow rate is very high equaling to 4 337,9 t/hr. In general, the power and material (fresh water and electrolyte) requirements for hydrogen production in this scale are substantially large especially considering that only renewable electricity would be applied. Thus, hydrogen from other sources and/or electricity from the grid should be considered. Other possible hydrogen sources include industrial side streams and hydrogen from syngas. Table 5.3. Key input and output figures for the hydrogen production process. Parameter Value Unit Produced H2 5,07 t/hr Produced O2 40,1 t/hr Electrolyte mix flow rate ,6 t/hr Makeup water flow rate 53,6 t/hr Power consumption 217 MW 5.3 Methanol synthesis and distillation Key input and output figures for the methanol synthesis process are introduced in Table 5.4 and the extracted stream data from Aspen is introduced in Appendix 3. 33
43 Table 5.4. Key input and output figures for the methanol synthesis process. Parameter Value Unit Crude methanol production rate ,3 kg/hr CO2 input flow rate ,4 kg/hr H2 input flow rate 5 066,5 kg/hr Reactor temperature 250 o C Reactor pressure 50 bar Recycle to feed ratio 3,86 mol/mol H2:CO2 ratio (feed/reactor inlet) 2,74/2,99 mol/mol Reactor heat generation 7,3 MW Required electricity load 2,96 MW The electricity load for methanol synthesis phase consists of the power consumption in the hydrogen feed compressor and the recycle stream compressor. Considering the error analysis presented in chapter 4.4, the heat generation in the reactor (123,53 kj/kg) implies the largest difference, being lower than the value (131,27 kj/kg) achieved from the reported data by Kiss et al. (2016). This is primarily explained by the non-reactants, nitrogen and oxygen, in the reactor inlet stream which are not participating in the reactions inducing the heat generation. When not considering nitrogen and oxygen, the value is more relevant equaling to 128,4 kj/kg. Key input and output figures for the distillation process are introduced in Table
44 Table 5.5. Key input and output figures for the distillation process. Parameter Value Unit Methanol production 21,25 t/hr Methanol purity 99,6 % Steam input flow rate 30 t/hr Water output flow rate (first / second column) 9,9/ 32,5 t/hr Reboiler heat duty (first column) ,1 kw Condenser heat duty (first / second column) ,9 / ,2 kw CO2 feed per produced methanol 1,87 kg/kg H2 feed per produced methanol 0,24 kg/kg Carbon conversion (methanol/co2) 0,757 mol/mol Waste water production 42,4 t/hr Most of the impurities in the produced methanol stream consist of dissolved CO2. The rest are the minor amount of remaining moisture and traces of H2, CO, N2 and O2. The composition of the produced methanol stream is introduced in Table 5.6. The carbon conversion rate is substantially low compared to previous studies. In addition, the CO2 and H2 feeds per product are relatively high. (Kiss et al. 2016) This is primarily explained by the high purge rate due to the Aspen convergence method and the considered configuration in which the purges are combusted to produce heat. The heat from the combustion is exploited in the heat integration (for instance, covering the heat requirement for producing steam to the last distillation column) and produced excess heat could be exploited in power generation. The conversion values could be enhanced applying a different convergence method and excluding the purge combustion. However, the heat source for steam generation should be then fulfilled in other means. The distillation columns produce large waste water flows at 100 o C temperature containing 184 ppm of methanol. These streams could be applied in heating purposes elsewhere in the process. For instance, preheating of the reactor feed could be a potential option to exploit the heat in these streams. 35
45 Table 5.6. Composition of the produced methanol. Component Mass fraction CH3OH 0,9958 CO2 0,00413 H2O 0, H2, CO, N2, O2 1-3 * Process optimization Various released side products together with similar requirements elsewhere in the process provide possibilities for process optimization through connecting these streams. Major share of these streams are steam and liquid water streams of considerable flow rates. Some of them are applied for heat transfer purposes. Thus, finding the optimal configuration to for process water network is highly advantageous for process efficiency but is excluded in this study. The pure oxygen stream released from hydrogen production is approximately three times larger than the oxygen requirement for the calciner in the CO2 extraction phase. Thus, high costs induced by expensive air separation units or purchasing of exterior oxygen may be avoided by combining these streams. Additionally, the nitrogen resulting in the synthesis feed stream could be neglected if high purity oxygen from electrolysis would be exploited in combustion in the calciner. The excess oxygen surpassing the requirements of the calciner is a valuable side product applicable in various industrial processes and/or could be applied in the combustion of purges in the synthesis/distillation phase. The amount of excess oxygen may be attained from the difference of the flow rates of the produced and required oxygen flow rates and equals to ,9 kg/hr. The model includes several significant heat loads both consuming and producing heat. Thus, a heat integration analysis is conducted with the Aspen Energy Analyzer to find the optimal configuration considering the heat streams in the whole process. The analysis tool is applied in two parts (CO2 extraction and synthesis together with distillation) as separate to avoid excessively complicated configurations. The results from the energy analysis are presented in Table
46 Table 5.7. Energy analysis results. Load Heating utilities (synthesis and distillation), original Heating utilities (synthesis and distillation), after analysis Cooling utilities (synthesis and distillation), original Cooling utilities (synthesis and distillation), after analysis Heating utilities (CO2 extraction), original Heating utilities (CO2 extraction), after analysis Cooling utilities (CO2 extraction), original Cooling utilities (CO2 extraction), after analysis Value 45,6 MW 0 MW 102,5 MW 26,8 MW 14,7 MW 0 MW 16,1 MW 1,5 MW Total savings (synthesis and distillation) 81,9 % Total savings (CO2 extraction) 95,2 % As seen in the results, the system is thermally self-sufficient and no external heating is required (if not considering the CH4 combusted in the calciner) with an optimized heat integration. However, some cooling is required and considered as losses rejecting heat to the environment. The utilization of the excess heat should be examined. For instance, heating of the large electrolyte mix flow in hydrogen production (at 80 o C) is excluded in the analysis. 5.5 Power consumption The entire process includes notable electricity loads. Hydrogen production distinctly accounts for the largest share considering electricity consumption. The pumping of processed streams is excluded in the calculations. Additionally, the compressor inputs in the model assume 100 % isentropic efficiency. Thus, an additional electricity load induced by the pumping and losses in compression should be considered in actual design. The shares of electricity consumption in different parts of the process are introduced in Table
47 Table 5.8. Electricity loads in different parts of the process. Process block Electricity load, [MW] Share of total electricity load Carbon dioxide extraction 8,84 3,9 % Hydrogen production ,8 % Methanol synthesis 2,96 1,3 % Distillation 0 0 % The distinctly largest electricity load is induced by the hydrogen production phase. Water electrolysis equipment are typical applications for exploiting renewable electricity. In this scale, the electricity load is substantially large and would require immoderate electricity production considering average renewable resources. Thus, dependence on electricity from the grid or hydrogen feedstocks from other sources should be examined. Considering only methanol synthesis, the consumed electricity per ton of product seems to be reasonable equaling to 139 kwh/ton of methanol. 5.6 Summary of plant performance This section provides a summary of the results for plant performance focusing on viewpoints on energy and material consumption and their efficiencies Material consumption The mass balance of the entire process is defined comparing the inputs and outputs of the system as there is no accumulation of materials in the process. Exclusively, the material streams contributing to the product streams are considered and other operational streams are excluded from the material efficiency calculations. Thus, the streams considered as inputs are: carbon dioxide from air methane and oxygen for the calciner in CO2 extraction water added in the electrolysis and the streams considered as outputs are: methanol oxygen from electrolysis Figure 5.1 presents an illustrated definition for the mass balance boundaries and the flow rates of the mentioned streams are introduced in Table
 contribute to 61,9")
48 Figure 5.1. Illustrated definition for the considered mass balance boundaries. Table 5.9. Flow rates in the mass balance. Material Mass flow rate, [kg/hr] CO ,4 Water O2,in CH ,6 Methanol O2,out ,6 Losses ,4 The primary output streams (methanol and oxygen) contribute to 61,9 % of the inputs. Considering only methanol, the ratio equals to 21,5 %. The losses in mass balance equal to ,4 kg/hr, contributing to 38,1 % of the total mass flow of inputs. The losses consist of: purge in the recycle loop in methanol synthesis unreacted gases released as purge in the first distillation column water production in synthesis and released in the distillation columns water production in the combustion of methane in the calciner 39
49 The largest material requirements consist of water makeup for water electrolysis and methane fed to the calciner in the CO2 extraction process if the required oxygen is considered to be fulfilled by the oxygen produced in the electrolysis. A major share of the other (operational) material loads in the process may be fulfilled by circulating the processed streams, as well. The degradation of potassium hydroxide acting as the sorbent in CO2 capture and electrolyte in the hydrogen production as well as the degradation of the methanol synthesis catalyst induce a demand for replacing them at an adequate rate. This should be considered in the actual process design but is excluded in this study. The mass balance could be examined considering different process phases as separate, as well. Table 5.10 describes the inputs and outputs together with the conversion ratios for mass balance of each process phase. Table Mass balance inputs, outputs and conversion ratios for different process steps. Process phase Input(s) Output(s) Conversion ratio (output(s) / input(s)) CO2 extraction CO2 from air CH4 O2 CO2 87,5 % H2 production Water H2 O2 84,2 % Methanol synthesis CO2 H2 Crude methanol 78,2 % Distillation Crude methanol High purity methanol 60,6 % In CO2 extraction, the losses are mostly water produced in the consumption of methane. In H2 production, the moisture resulting in the H2 stream from the electrolyser contributes for the losses. The large purge ratio and water production in the synthesis reactions are primary reasons for losses in methanol synthesis and distillation phases. Carbon conversion rate describes the molar conversion of inputs (carbon dioxide and methane) to outputs (methanol) containing carbon. The amount of CO2 is determined to equal with the amount of CO2 captured in the air contactor in the extraction phase to correlate with the carbon conversion efficiency of the entire plant. Thus, the amount of CO2 equals to the molar amount of CO2 in the stream AIR-IN diminished with the molar amount of CO2 in the stream AIR-OUT. The value may be defined by the following equation: R CC = moles CH3OH moles CO2,CH4 (Eq. 5.1) 40
50 Thus, the carbon conversion rate of the entire process equals to 0,767. Similarly to the carbon conversion value determined in chapter 5.3, the relatively low value may be primarily explained by the high purge rate in the synthesis process Energy consumption The total amount of energy consumed in the methanol production process compared to the energy released in its combustion defines the energy efficiency of the entire process design. The energy released in the combustion is defined by the lower heating value (LHV) of the combusted component. LHV for methanol is 19,9 MJ/kg and LHV for methane is 50,0 MJ/kg. (The Engineering ToolBox) The total amount of consumed energy consists of electricity consumption in various parts of the process and methane fed to the calciner in CO2 extraction. Energy loads considered as outputs are methanol (LHV basis), cooling utilities and other losses. Different shares in the energy efficiency calculations are introduced in Table The energy consumption is calculated considering the heat integration system determined after applying Aspen Energy Analyzer for the model. As seen in the energy analysis results introduced in chapter 5.4, all the heat loads in the process could be covered with optimized heat integration. However, some cooling loads are resulting still after the optimization as reject heat to the environment and considered as losses. The value for the total cooling load is determined from the values obtained after the energy analysis. Table Shares in the energy efficiency calculations. Source Energy load, [MW] Pelec 229 CH4 42,4 Methanol 117 Pcooling 28,3 Other losses 126,1 The consumed energy per produced methanol equals to 12,8 MWh/ton of methanol. Considering electricity load exclusively, the value equals to 10,8 MWh/ton of methanol. Comparing to previous studies, the energy consumption values seem to be reasonable considering the configuration of the plant that covers the whole process including CO2 extraction and hydrogen production. A major share of the electricity load is induced by hydrogen production. Other process configurations such as feedstocks from other sources would have a large impact on the energy consumption values. A comparison between this and other studies is provided in Table
51 Table Comparison of key energy consumption values. Parameter This study (Mignard et al. 2003) (Specht et al. 1998) (Sakamoto, Zhou 2000) (Bellotti MeOH from et al. biomass (Galindo 2017) Cifre, Badr 2007) Electricity consumption, [MWh/ton of MeOH] Energy conversion efficiency 10,8 9,2 12, ,9 7 43,1 % 18,4 23 % 17,6 % 21 % 45,6 % 25 % The comparison of energy consumption between different studies is challenging as the reported values include different loads depending on the research in question. However, the comparison provides a view on the differences between the values from different process configurations. The study from Bellotti et al. (2017) is based on a largely similar configuration but where CO2 is extracted from the flue gases of a coal power plant and hydrogen is produced via PEM electrolysis. The study by Galindo Cifre and Badr (2007) focused on methanol production via biomass gasification and provided lowest values considering electricity consumption even though the electricity load for water electrolysis was included. The other three studies investigated conventional CO2 hydrogenation to methanol plants where CO2 was captured from flue gases. Specht et al. (1998) and Sakamoto and Zhou (2000) also included the delivery of CO2 in their calculations. In general, the novel design in this study seems to be competitive with other methanol production processes considering both electricity consumption and energy conversion efficiency. Plant overall efficiency describes the process comparing its inputs and outputs. The input value equals to the amount of consumed energy consisting of the same components as considered in the energy efficiency calculations previously introduced in this chapter but excluding the cooling loads. The outputs are determined for methanol exclusively applying both lower heating value (LHV) and higher heating value (HHV) as a basis. LHV basis represents the efficiency considering the produced methanol to be exploited as a fuel and HHV basis represents the efficiency of methanol exploited as a chemical feedstock. The higher heating value for methanol is 23,0 MJ/kg. (The Engineering ToolBox) The values are obtained by the following equations: η LHV = LHV methanol mass flow methanol E in (Eq. 5.2) η HHV = HHV methanol mass flow methanol E in (Eq. 5.3) The plant overall efficiency with LHV basis equals to 43,1 % and with HHV basis to 50,0 %. 42
52 5.7 Suggestions PEM and SOEC electrolysers provide interesting options for the conventional alkaline electrolysers. The more compact design considering PEM electrolysers and the electrical energy efficiency considering SOEC electrolysers (when enough thermal energy is available) are preferred compared to alkaline processes. In addition, the potential in dynamic operation of PEM electrolysers is an advantage in processes where fluctuating renewable electricity is applied. However, PEM electrolysis is largely cost-intensive and both PEM and SOEC electrolysers would require more research and development to reach higher feasibility in industrial operation. Various catalysts have been examined for methanol synthesis that overcome the most applied Cu/ZnO/Al2O3 -compound and the Cu/Zn/Al/Zr compound considered in this study. The main advantages of the novel catalysts are increasing the selectivity for CO2 hydrogenation reaction and methanol yields. Further research and development of the operation of the novel catalysts would provide possibilities to increase the efficiency of the system and investigate their feasibility. Further process optimization is suggested to reduce the energy and material requirements per produced methanol. In this study, more profound optimization of water flows (integration and flow rates) is excluded and leaves a large potential for further research. The large amount of purge in the synthesis phase induces excess losses considering feed conversion ratios compared to typical designs from previous studies. This should be optimized in the model design, as well. However, the proposed design in this study for combustion of purges removes all the heating requirements in the process. 43
53 6 Conclusion This thesis examined the production of methanol via carbon dioxide hydrogenation. Methanol is a chemical that is primarily applied as a fuel or base chemical in chemical industry. It may be produced from several feedstocks and in various pathways. Renewable methanol production is one of the most promising methods in sustainable power-to-liquids/power-to-fuel scenarios. For this thesis, a simulation model was built in Aspen Plus software to investigate the whole methanol production process from CO2 capture from ambient air and hydrogen production via water electrolysis to distilled high purity methanol. The discussed methods resulted in a novel process configuration considering the complete plant design. The considered scale ( tons of methanol per year) results in high material and electricity demand, posing a question about potentially suitable locations especially if renewable electricity would be exclusively applied. This is primarily due to the substantially large power and material requirements (217 MW of electricity and kg/hr of fresh water for the electrolyser and even more as scrubbing water) in the hydrogen production. Thus, at least partial hydrogen feedstock from other sources and/or electricity from the grid should be considered. Apart from hydrogen production, the process seems to be reasonable considering requirements per product. The CO2 capture process from ambient air provides an interesting possibility to reduce the amount of CO2 in the atmosphere and dependence on conventional fossil fuel based methods in CO2 extraction especially if renewable-based methane is considered in heating of the calciner. The process seems to be feasible considering the energy requirements per produced CO2. After the energy analysis, all the heating loads and most of the cooling loads could be covered with optimized heat integration. However, large water flows are required for this process phase, as well. Process optimization plays an important role as the considered plant configuration includes several large material and heat loads. A heat integration analysis was performed with Aspen Energy Analyzer tool. As seen in the results, all of the heating requirements in the entire process could be covered with optimized heat integration. However, some cooling requirements still remain rejecting heat to the environment. The largest material requirements consist of water/steam streams applied in various stages of the process. In addition, the high purity oxygen produced in water electrolysis and applied in methane combustion in the calciner (and/or combustion of purge streams in methanol synthesis) provide interesting options for process optimization. Further examination on these is suggested. In general, a plant of a smaller scale would be more feasible as the material and electricity requirements in this design are relatively large. The most potential options to increase the plant feasibility would probably be to decrease the overall scale and to apply possible available hydrogen feedstocks from e.g. industrial side streams. However, the economical feasibility of the CO2 capture process decreases in relation to the scale. Further examination is suggested related to the plant scale and feedstocks from other sources. Overall, the novel configuration considered in this study seems to be competitive with conventional methanol production methods considering its efficiency. The obtained plant efficiency values seem to be reasonable even though the power requirements are high and a 44
54 relatively large share of the feeds for the synthesis are purged. However, the carbon conversion rate considering the whole process remains relatively low due to the large amount of purges. The values could be further improved as the research leaves a large potential in optimization of the material streams and their flow rates and thus enhancing the efficiency of the plant. 45
55 7 References AspenTech. Aspen Plus. Available at: < [Accessed: ] Baltrusaitis, J., Luyben, W. L Methane Conversion to Syngas for Gas-to-Liquids (GTL): Is Sustainable CO2 Reuse via Dry Methane Reforming (DMR) Cost Competitive with SMR and ATR Processes?. ACS Sustainable Chemistry & Engineering, 3/2015, pp Available at: < Barbir, F PEM electrolysis for production of hydrogen from renewable energy sources. Solar Energy, 78/2005, pp Available at: < cdn.com/s x /1-s2.0-s x main.pdf?_tid=8eb47ed4-de74-11e7-ab6c-00000aacb361&acdnat= _bf6c9924b0366aaad60366b2cc21ab41> Bellotti, D., Rivarolo, M., Magistri, L., Massardo, A. F Feasibility study of methanol production plant from hydrogen and captured carbon dioxide. Journal of CO2 Utilization, 21/2017, pp Available at: < EB500540A64F81BAE041DA740A45A56C4B29FE083FE7B9C89A7550EBCCB7B73926A9F 117E3FB2C> DOE - U.S. Department of Energy. Hydrogen Production and Distribution. Available at: < [Accessed: ] EPA - United States Environmental Protection Agency. Overview of Greenhouse Gases - Carbon Dioxide Emissions. Available at: < [Accessed: ] Frilund, C CO2 Hydrogenation to Methanol. [online]. M.Sc. Thesis. Aalto University School of Chemical Technology. Espoo. 121 p. [referenced ] Available at: < Galindo Cifre, P., Badr, O Renewable hydrogen utilisation for the production of methanol. Energy Conversion and Management, 48/2007, pp Available at: < els-cdn-com.libproxy.aalto.fi/s /1-s2.0-s main.pdf?_tid=6a6a40fb-4ecb-4684-a e66064b&acdnat= _6dbaf c93e91d4b0739ccc732> Gesser, H. D., Hunter, N. R., Prakash, C. B The Direct Conversion of Methane to Methanol by Controlled Oxidation. Chemical Reviews, 85/1985, nr. 4, pp Available at: < Goeppert, A., Czaun, M., May, R. B., Prakash, G. K. S., Olah, G. A., Narayanan, S. R Air as the renewable carbon source of the future: and overview of CO2 capture from the atmosphere. 46
56 Energy & Environmental Science, 5/2012, pp Available at: < Goeppert, A., Czaun, M., May, R. B., Prakash, G. K. S., Olah, G. A., Narayanan, S. R Carbon Dioxide Capture from the Air Using a Polyamine Based Regenerable Solid Adsorbent. Journal of the American Chemical Society, 135/2011, pp Available at: < Han, B., Yang, Y., Xu, Y., Etim, U. J., Qiao, K., Xu, B., Yan, Z A review of the direct oxidation of methane to methanol. Chinese Journal of Catalysis, 37/2016, pp Available at: < main.pdf?_tid=spdf-cb26f174-dfc1-4e9a-8d25-6fdf9600b9d1&acdnat= _ccca3ace94f174da48797ffd58c68e8e> Holladay, J. D., Hu, J., King, D. L., Wang, Y An overview of hydrogen production technologies. Catalysis Today, 139/2009, pp Available at: < com.libproxy.aalto.fi/s /1-s2.0-s main.pdf?_tid=f61a d-4e22-b3a3-6c7e d&acdnat= _16e8ea24b5d0e3f35b51c6d6719deac8> Hydrocarbons Technology: Neste Oil Porvoo Refinery Diesel Project, Porvoo. Available at: < [Accessed: ] Keith, D. W., Holmes, G., St. Angelo, D., Heidel, K A Process for Capturing CO2 from the Atmosphere. Joule, 2/2018, pp Available at: < Kiss, A. A., Pragt, J. J., Vos, H. J., Bargeman, G., de Groot, M. T Novel efficient process for methanol synthesis by CO2 hydrogenation. Chemical Engineering Journal, 284/2016, pp Available at: < S main.pdf?_tid=11b cf7-15cf9bd7246e&acdnat= _96f07d9b4ec97a9d8b4e81d942c6bf27> Kondratenko, E. V., Peppel, T., Seeburg, D., Kondratenko, V. A., Kalevaru, N., Martin, A., Wohlrab, S Methane conversion into different hydrocarbons or oxygenates: current status and future perspectives in catalyst development and reactor operation. Catalysis Science & Technology, 7/2017, pp Available at: < Koponen, J Review of water electrolysis technologies and design of renewable hydrogen production systems. [online]. M.Sc. Thesis. Lappeenranta University of Technology, School of Energy Systems. Lappeenranta. 87 p. [referenced ] Available at: < Kothandaraman, J., Goeppert, A., Czaun, M., Olah, G. A., Prakash, G. K. S Conversion of CO2 from Air into Methanol Using a Polyamine and a Homogeneous Ruthenium Catalyst. 47
57 Journal of the American Chemical Society, 138/2016, pp Available at: < Lackner, K. S Capture of carbon dioxide from ambient air. The European Physical Journal Special Topics, 176/2009, pp Available at: < Lee, S., Sardesai, A Liquid phase methanol and dimethyl ether synthesis from syngas. Topics in Catalysis, 32/2005, nro. 3-4, pp Available at: < Leung, D. Y. C., Caramanna, G., Maroto-Valer, M. M An overview of current status of carbon dioxide capture and storage technologies. Renewable and Sustainable Energy Reviews, 39/2014, pp Available at: < S main.pdf?_tid=36c8525b-51a5-4bf2-b5df- 44b72e4daf56&acdnat= _9c1c687f4f666397fd49fc34e8b216df> The Linde Group - Linde Engineering Isothermal reactor. Available at: < mal_reactor/index.html> [Accessed ] Mansilla, C., Dautremont, S., Shoai Tehrani, B., Cotin, G., Avril, S., Burkhalter, E Reducing the hydrogen production cost by operating alkaline electrolysis as a discontinuous process in the French market context. International Journal of Hydrogen Energy, 36/2011, pp Available at: < S main.pdf?_tid=5ae4b4e6-e6ff-11e7-8af aab0f6b&acdnat= _3362be08b405f34baacfb27aa5b44382> Mergel, J., Carmo, M., Fritz, D Status on Technologies for Hydrogen Production by Water Electrolysis. Transition to Renewable Energy Systems, 1st Edition, 937 p. Wiley-VCH Verlag GmbH & Co. ISBN: Available at: < gy.pdf?awsaccesskeyid=akiaiwowyygz2y53ul3a&expires= &signature= yg64swp%2b3jzstfm6y2r%2bwer45ae%3d&response-contentdisposition=inline%3b%20filename%3dtransition_to_renewable_energy_systems.pdf#page= 449> Meunier, N., Laribi, S., Dubois, L., Thomas, D., de Weireld, G CO2 capture in cement production and re-use: first step for the optimization of the overall process. Energy Procedia, 63/2014, pp Available at: < S main.pdf?_tid=0c42d610-f9e4-40bf-a d743997c4&acdnat= _f7bc14c434454aa0facc8ee99f4a20e1> Mignard, D., Sahibzada, M., Duthie, J. M., Whittington H. W Methanol synthesis from flue-gas CO2 and renewable electricity: a feasibility study. International Journal of Hydrogen Energy, 28/2003, pp Available at: <
58 s2.0-s main.pdf?_tid=5510bd95-2bac-41b3-9e35- cb890eab93c6&acdnat= _cecd d19d4fc fb6932> Nel Hydrogen Constructing the world s largest electrolyzer manufacturing plant. Available at: < Nel Hydrogen Nel Hydrogen Electrolyser - The world s most efficient and reliable electrolyser. Available at: < Ni, M., Leung, M. K. H., Leung, D. Y. C Technological development of hydrogen production by solid oxide electrolyzer cell (SOEC). International Journal of Hydrogen Energy, 33/2008, pp Available at: < S main.pdf?_tid=fb01f71e-df29-11e aacb35d&acdnat= _f252f7c13ad65aabe4af f86f9> Olah, G.A Beyond Oil and Gas: The Methanol Economy. Angewandte Chemie International Edition, 44/2005, pp Available at: < Ott, J., Gronemann, V., Pontzen, F., Fiedler, E., Grossmann, G., Kersebohm, D. B., Weiss, G., Witte, C Ullmann s Encyclopedia of Industrial Chemistry - Methanol. Wiley-VCH Verlag GmbH & Co. KGaA, Weinheim. ISBN: Available at: < os_adicionales/a16_465_metanol.pdf> Rahimpour, M. R A two-stage catalyst bed concept for conversion of carbon dioxide into methanol. Fuel Processing Technology, 89/2008, pp Available at: < cdn.com/s /1-s2.0-s main.pdf?_tid=c8382a2c-e17e- 11e7-b aacb35f&acdnat= _581e8ac12a caf003d22b755a5> Rahimpour, M. R., Alizadehhesari, K A Novel Fluidized-bed Membrane Dual-type Reactor Concept for Methanol Synthesis. Chemical Engineering Technology, 31/2008, nr. 31, pp Available at: < Sadeghi, J., Ahangar, M The Study of Methanol Separation Columns Control. Oriental Journal of Chemistry, 28/2012, nr. 1, pp Available at: < /OJCV028I01P pdf> Sakamoto, Y., Zhou, W Energy analysis of a CO2 recycling system. International Journal of energy Research, vol. 24, iss. 6, pp
59 Sanz-Pérez, E. S., Murdock, C. R., Didas, S. A., Jones, C. W Direct Capture of CO2 from Ambient Air. Chemical Reviews, 116/2016, pp Available at: < Shekhah, O., Belmabkhout, Y., Chen, Z., Guillerm, V., Cairns, A., Adil, K., Eddaoudi, M Made-to-order metal-organic frameworks for trace carbon dioxide removal and air capture. Nature Communications, 5:4228. Available at: < da Silva, M. J Synthesis of methanol from methane: Challenges and advances on the multi-step (syngas) and one-step routes (DMTM). Fuel Processing Technology, 145/2016, pp Available at: < S main.pdf?_tid=spdf-0881a1ed-c76d cd7fcdd0dc9a&acdnat= _f6587ba9850a1828f51dc959e819658a> Specht, M., Bandi, A., Elser, M., Staiss, F Comparison of CO2 sources for the synthesis of renewable methanol. In: Inui, T., Anpo, M., Izui, K., Yanagida, S., Yamaguchi, T Advances in chemical conversions for mitigating carbon dioxide. Vol.114, pp Elsevier, Amsterdam, the Netherlands. Studt, F., Sharafutdinov, I., Abild-Pedersen, F., Elkjaer, C. F., Hummelshoej, J. S., Dahl, S., Chorkendorff, I., Noerskov, J. K Discovery of a Ni-Ga catalyst for carbon dioxide reduction to methanol. Nature Chemistry, 6/2014, pp Available at: < 998b-62c9bfe8db7e%40sessionmgr4007> Sun, J., Wang, F., Ma, T., Gao, H., Wu, P., Liu, L Energy and exergy analysis of a fivecolumn methanol distillation scheme. Energy, 45/2012, pp Available at: < bd6398a c24289&acdnat= _1d63e2031d58179b104f8d34b156ec61> The Engineering ToolBox: Fuels - Higher and Lower Calorific Values. Available at: < [Accessed: ] Tijm, P. J. A., Waller, F. J., Brown, D. M Methanol technology developments for the new millenium. Applied Catalysis - A: General, 221/2001, pp Available at: < cdn-com.libproxy.aalto.fi/s x /1-s2.0-s x main.pdf?_tid=70fdea08-42c6-4ec d880b47daedb&acdnat= _e141631a5f a4086c56870ab05> van der Ham, L. G. J., van den Berg, H., Benneker, A., Simmelink, G., Timmer, J., van Weerden, S Hydrogenation of Carbon Dioxide for Methanol Production. Chemical Engineering Transactions, 29/2012, pp Available at: < 50
60 Wang, W., Wang, S., Ma, X., Gong, J Recent advances in catalytic hydrogenation of carbon dioxide. Chemical Society Reviews, vol.40/2011, nr. 7, pp Available at: < Wilhelm, D. J., Simbeck, D. R., Karp, A. D., Dickenson, R. L Syngas production for gasto-liquids applications: technologies, issues and outlook. Fuel Processing Technology, 71/2001, pp Available at: < S main.pdf?_tid=2f5496ba-17c0-11e8-85ad aab0f01&acdnat= _ca27b3a0a4c75702da90ef c9d> York, A. P. E., Xiao, T., Green, M. L. H Brief overview of the partial oxidation of methane to synthesis gas. Topics in Catalysis, 22/2003, nr. 3-4, pp Available at: < Zakaria, Z., Kamarudin, S. K Direct conversion technologies of methane to methanol: An overview. Renewable and Sustainable Energy Reviews, 65/2016, pp Available at: < Zhang, J., Liang, S., Feng, X A novel multi-effect methanol distillation process. Chemical Engineering and Processing, 49/2010, pp Available at: < cdn.com/s /1-s2.0-s main.pdf?_tid=spdf-bd6398a c24289&acdnat= _1d63e2031d58179b104f8d34b156ec61> 51

61 Appendix Appendix 1. Error analysis for determining the synthesis reaction rates. The applied case is found on the last row (226).
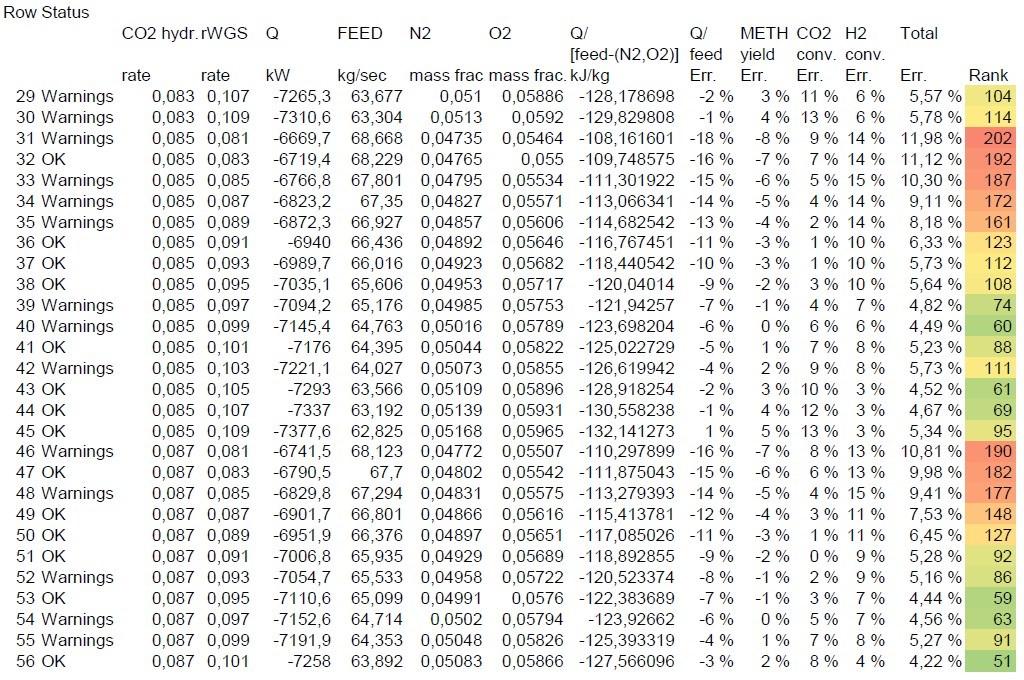
62
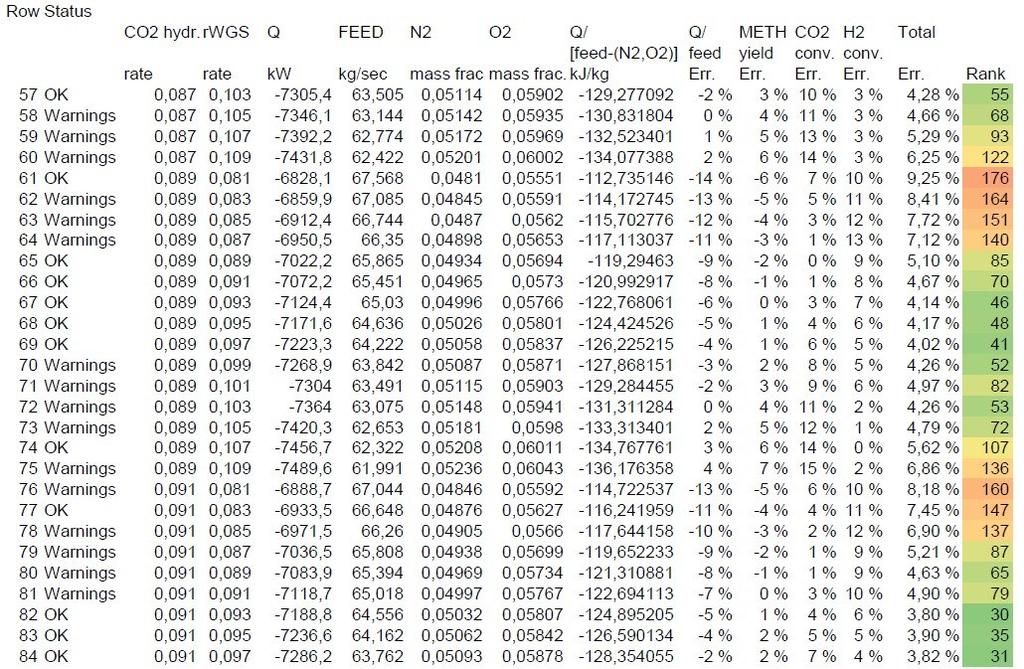
63
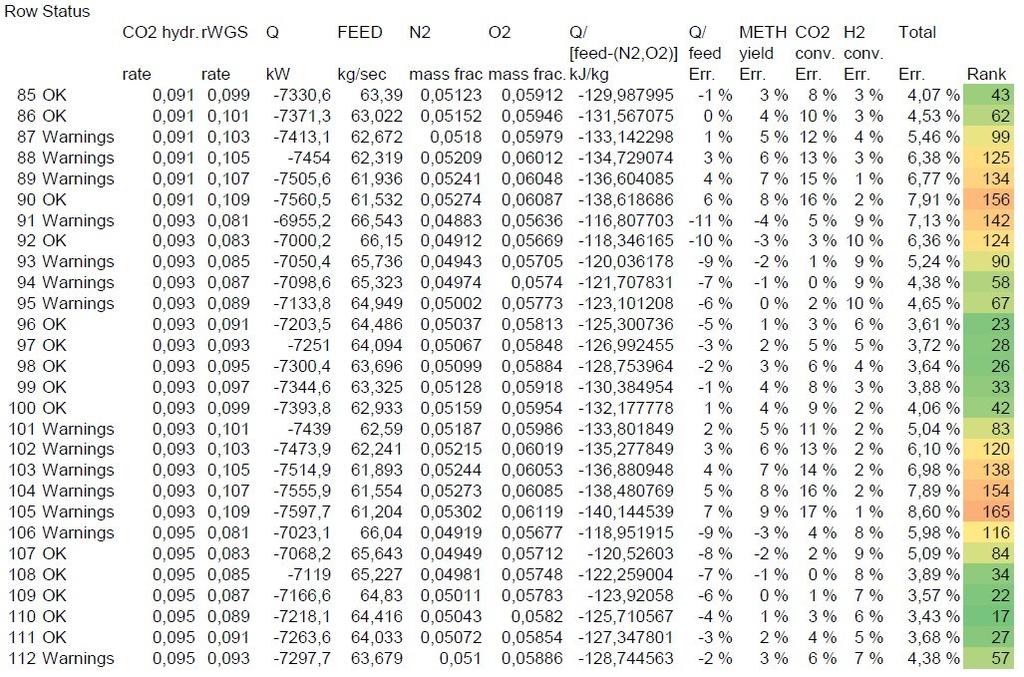
64
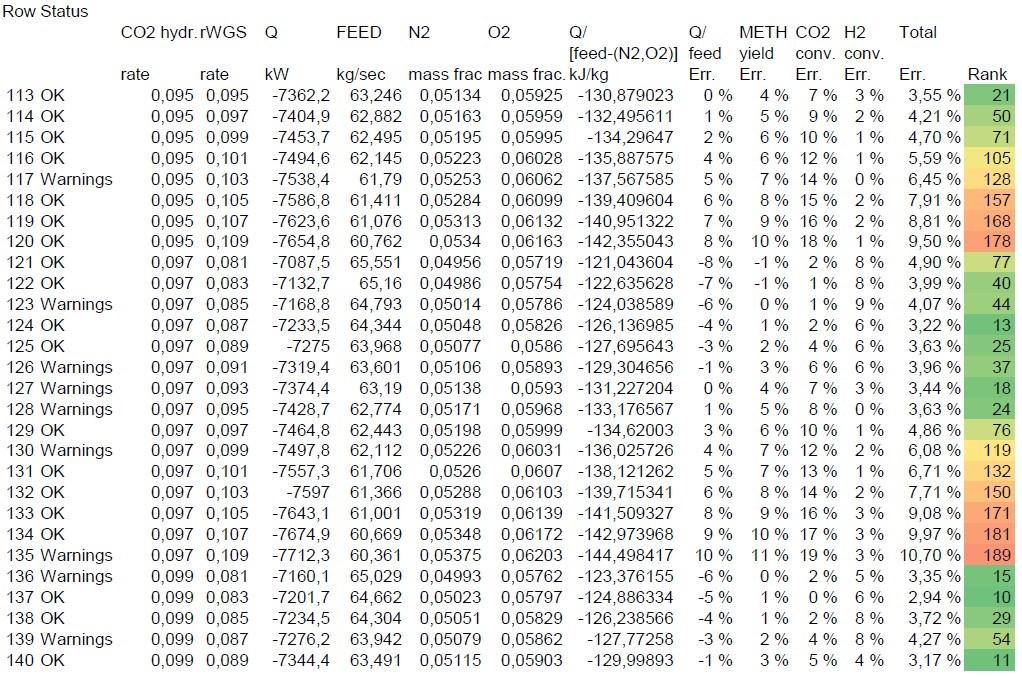
65
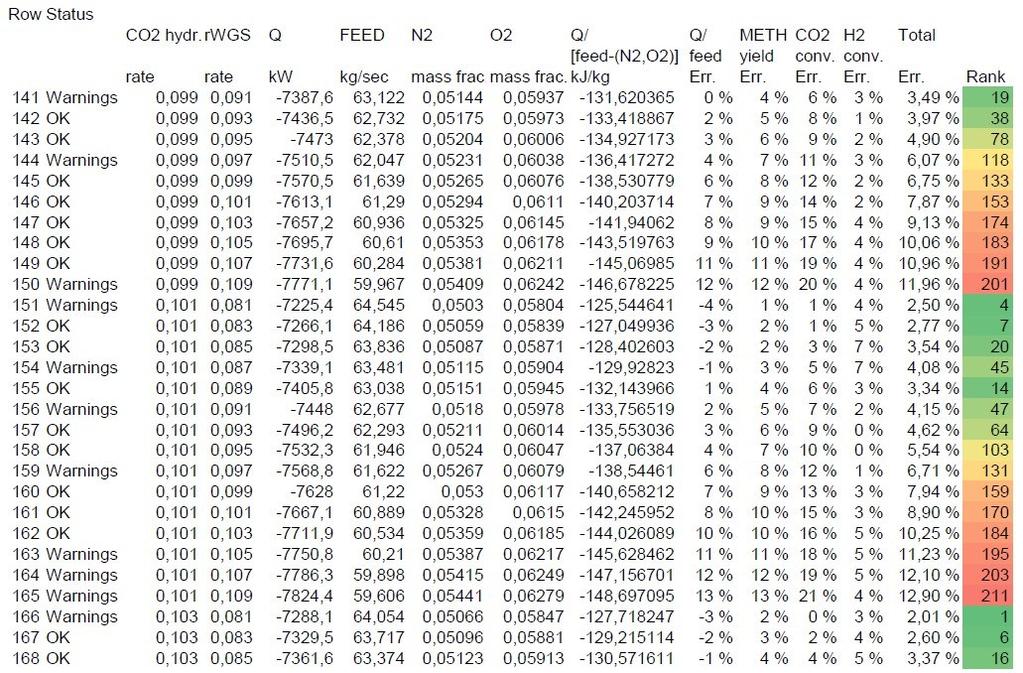
66
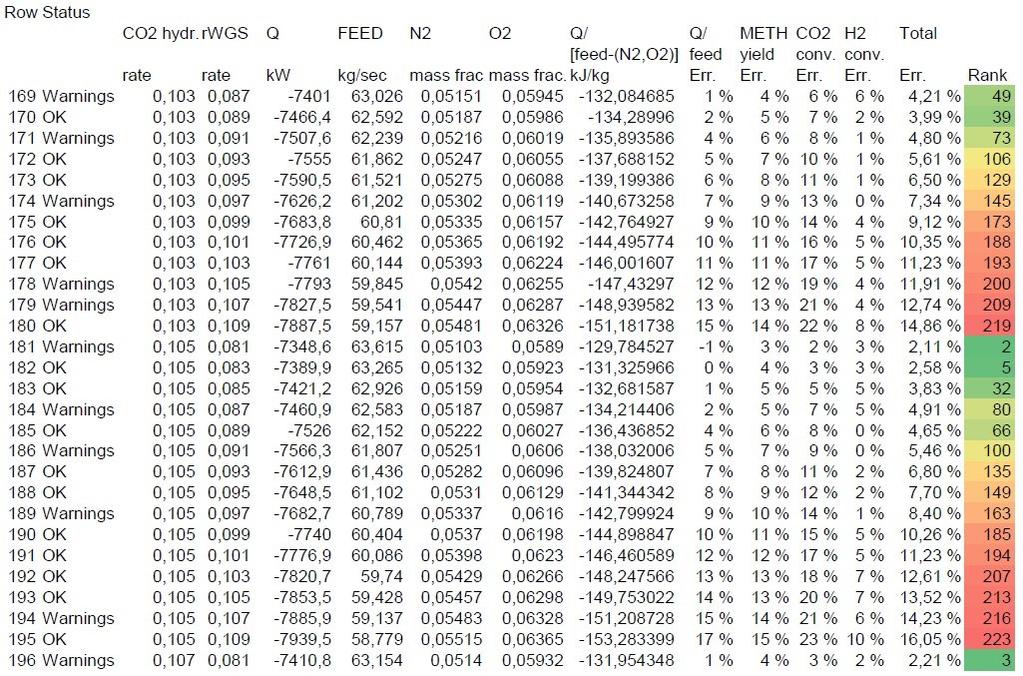
67
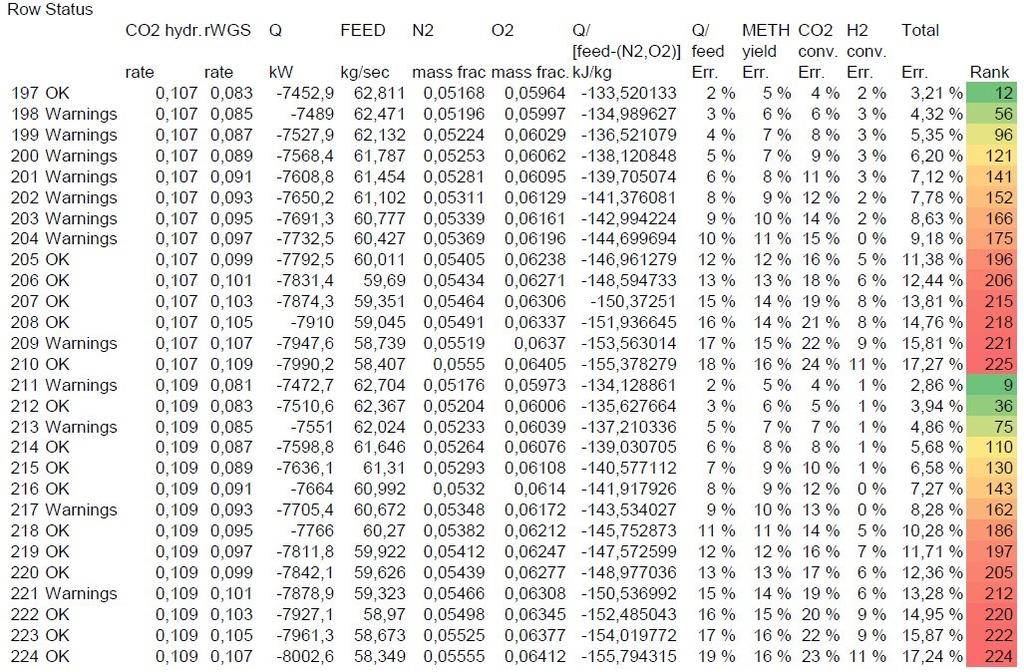
68
69
70 Appendix 2. Stream data for the CO2 capture process extracted from the Aspen Plus model.
71
72
73
74
75 Appendix 3. Stream data for the synthesis and distillation processes extracted from the Aspen Plus model.
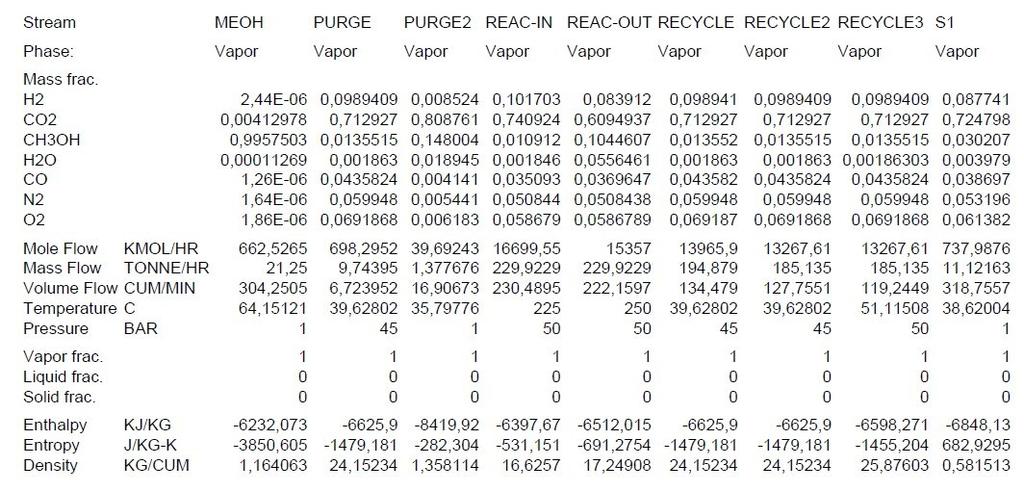
76
Capacity Utilization
 Capacity Utilization Tim Schöneberg 28th November Agenda Introduction Fixed and variable input ressources Technical capacity utilization Price based capacity utilization measure Long run and short run
TÄUBLER OY. Vuorimiehenkatu Helsinki Finland. Puh: Fax:
 TÄUBLER OY Vuorimiehenkatu 21 00140 Helsinki Finland Puh: 09-175 491 Fax: 09-175 735 TÄUBLER OY Perustettu vuonna 1990 Itsenäinen suomalainen yritys Myy ja markkinoi edustamiaan tuotteita; SIEMENS H+H
Efficiency change over time
 Efficiency change over time Heikki Tikanmäki Optimointiopin seminaari 14.11.2007 Contents Introduction (11.1) Window analysis (11.2) Example, application, analysis Malmquist index (11.3) Dealing with panel
ReFuel 70 % Emission Reduction Using Renewable High Cetane Number Paraffinic Diesel Fuel. Kalle Lehto, Aalto-yliopisto 5.5.
 ReFuel 70 % Emission Reduction Using Renewable High Cetane Number Paraffinic Diesel Fuel Kalle Lehto, Aalto-yliopisto 5.5.2011 Otaniemi ReFuel a three year research project (2009-2011) goal utilize the
Parisiin sopimus vs. Suomen energia- ja ilmastostrategia 2030
 Parisiin sopimus vs. Suomen energia- ja ilmastostrategia 2030 Prof. Jarmo Partanen Jarmo.partanen@lut.fi +358 40 5066564 7.10.2016 Eduskunta/Ympäristövaliokunta What did we agree in Paris 2015? Country
Catalytic conversion of synthesis gas: Methods and applications
 Catalytic conversion of synthesis gas: Methods and applications Ulla Lassi HighBio projektiseminaari 18.11.2008 Introduction Synthesis gas is traditionally produced from fossil fuels (GTL) HighBio project
The CCR Model and Production Correspondence
 The CCR Model and Production Correspondence Tim Schöneberg The 19th of September Agenda Introduction Definitions Production Possiblity Set CCR Model and the Dual Problem Input excesses and output shortfalls
Other approaches to restrict multipliers
 Other approaches to restrict multipliers Heikki Tikanmäki Optimointiopin seminaari 10.10.2007 Contents Short revision (6.2) Another Assurance Region Model (6.3) Cone-Ratio Method (6.4) An Application of
Uusien liikenteen biopolttoaineteknologioiden
 Uusien liikenteen biopolttoaineteknologioiden kehitys Biorefine Loppuseminaari - innovaatioita ja liiketoimintaa Helsinki, 27.11.2012 Esa Kurkela 2 Syngas Route to Biofuels Integrated Concept studied at
16. Allocation Models
 16. Allocation Models Juha Saloheimo 17.1.27 S steemianalsin Optimointiopin seminaari - Sks 27 Content Introduction Overall Efficienc with common prices and costs Cost Efficienc S steemianalsin Revenue
Sähköntuotanto energialähteittäin Power generation by energy source
 Sähköntuotannon polttoaineet ja CO2-päästöt 2.1.216 1 (17) Sähköntuotanto energialähteittäin Power generation by energy source 8 7 6 GWh / kk GWh/ Month 5 4 3 2 1 7 8 9 1 1 2 3 4 5 6 7 8 9 1 1 2 3 4 5
Sähköntuotanto energialähteittäin Power generation by energy source
 Sähköntuotannon polttoaineet ja CO2-päästöt 3.6.217 1 (17) Sähköntuotanto energialähteittäin Power generation by energy source 8 7 6 GWh / kk GWh/ Month 5 4 3 2 1 1 2 3 4 5 6 7 8 9 1 11 1 2 3 4 5 6 7 8
Sähköntuotanto energialähteittäin Power generation by energy source
 Sähköntuotannon polttoaineet ja CO2-päästöt 25.9.217 1 (17) Sähköntuotanto energialähteittäin Power generation by energy source 8 7 6 GWh / kk GWh/ Month 5 4 3 2 1 7 8 9 1 1 2 3 4 5 6 7 8 9 1 1 17 2 17
Sähköntuotanto energialähteittäin Power generation by energy source
 Sähköntuotannon polttoaineet ja CO2-päästöt 31.1.2 1 () Sähköntuotanto energialähteittäin Power generation by energy source 8 7 6 GWh / kk GWh/ Month 5 4 3 2 1 7 8 9 1 1 2 3 4 5 6 7 8 9 1 1 2 3 4 5 6 7
Tarua vai totta: sähkön vähittäismarkkina ei toimi? 11.2.2015 Satu Viljainen Professori, sähkömarkkinat
 Tarua vai totta: sähkön vähittäismarkkina ei toimi? 11.2.2015 Satu Viljainen Professori, sähkömarkkinat Esityksen sisältö: 1. EU:n energiapolitiikka on se, joka ei toimi 2. Mihin perustuu väite, etteivät
Geoenergian tulevaisuuden visio. Jari Suominen
 Geoenergian tulevaisuuden visio Jari Suominen 1 The global energy challenge 3 Renewable energy potential does not limit its use Fossil energy: total estimated resources Renewable energy: estimated annual
Gap-filling methods for CH 4 data
 Gap-filling methods for CH 4 data Sigrid Dengel University of Helsinki Outline - Ecosystems known for CH 4 emissions; - Why is gap-filling of CH 4 data not as easy and straight forward as CO 2 ; - Gap-filling
1. SIT. The handler and dog stop with the dog sitting at heel. When the dog is sitting, the handler cues the dog to heel forward.
 START START SIT 1. SIT. The handler and dog stop with the dog sitting at heel. When the dog is sitting, the handler cues the dog to heel forward. This is a static exercise. SIT STAND 2. SIT STAND. The
Sähköntuotanto energialähteittäin Power generation by energy source
 Sähköntuotannon polttoaineet ja CO 2 päästöt 18.9.218 1 (17) Sähköntuotanto energialähteittäin Power generation by energy source 8 7 6 GWh / kk GWh / month 5 4 3 2 1 7 16 8 16 9 16 1 16 11 16 12 16 1 17
Sähköntuotanto energialähteittäin Power generation by energy source
 Sähköntuotannon polttoaineet ja CO 2 päästöt 23.1.218 1 () Sähköntuotanto energialähteittäin Power generation by energy source 8 7 6 GWh / kk GWh / month 5 4 3 2 1 7 8 9 1 11 12 1 2 3 4 5 6 7 8 9 1 11
Sähköjärjestelmän käyttövarmuus & teknologia Käyttövarmuuspäivä 25.11.2014
 Sähköjärjestelmän käyttövarmuus & teknologia Käyttövarmuuspäivä 25.11.2014 Jarmo Partanen, professori, Lappeenrannan yliopisto jarmo.partanen@lut.fi +358 40 5066 564 Electricity Market, targets Competitive
Sähköntuotanto energialähteittäin Power generation by energy source
 Sähköntuotannon polttoaineet ja CO 2 päästöt 12.12.2 1 () Sähköntuotanto energialähteittäin Power generation by energy source 8 7 6 GWh / kk GWh / month 5 4 3 2 1 7 8 9 1 11 12 1 2 3 4 5 6 7 8 9 1 11 12
Sähköntuotanto energialähteittäin Power generation by energy source
 Sähköntuotannon polttoaineet ja CO 2 päästöt 18.2.219 1 (17) Sähköntuotanto energialähteittäin Power generation by energy source 8 7 6 GWh / kk GWh / month 5 4 3 2 1 1 17 2 17 3 17 4 17 5 17 6 17 7 17
Sähköntuotanto energialähteittäin Power generation by energy source
 GWh / kk GWh / month Sähköntuotannon polttoaineet ja CO2-päästöt 24.4.219 1 (17) Sähköntuotanto energialähteittäin Power generation by energy source 8 7 6 5 4 3 2 1 1 17 2 17 3 17 4 17 5 17 6 17 7 17 8
Returns to Scale II. S ysteemianalyysin. Laboratorio. Esitelmä 8 Timo Salminen. Teknillinen korkeakoulu
 Returns to Scale II Contents Most Productive Scale Size Further Considerations Relaxation of the Convexity Condition Useful Reminder Theorem 5.5 A DMU found to be efficient with a CCR model will also be
7.4 Variability management
 7.4 Variability management time... space software product-line should support variability in space (different products) support variability in time (maintenance, evolution) 1 Product variation Product
Miten ymmärtää puubiomassan kaasutusta paremmin? - Hiilen kaasutusmallin kehittäminen
 Miten ymmärtää puubiomassan kaasutusta paremmin? - Hiilen kaasutusmallin kehittäminen How to Improve Understanding of Gasification of Woody Biomass? - Development of the Carbon Gasification Model Researcher
LYTH-CONS CONSISTENCY TRANSMITTER
 LYTH-CONS CONSISTENCY TRANSMITTER LYTH-INSTRUMENT OY has generate new consistency transmitter with blade-system to meet high technical requirements in Pulp&Paper industries. Insurmountable advantages are
Capacity utilization
 Mat-2.4142 Seminar on optimization Capacity utilization 12.12.2007 Contents Summary of chapter 14 Related DEA-solver models Illustrative examples Measure of technical capacity utilization Price-based measure
Tork Paperipyyhe. etu. tuotteen ominaisuudet. kuvaus. Väri: Valkoinen Malli: Vetopyyhe
 etu Monikäyttöpaperi hoitaa useimmat pyyhintätehtävät Sopiva lasipintojen pyyhintään Sopii käsien kuivaamiseen Elintarvikekäyttöön hyväksytty Tork Easy Handling, pakkaus, jota on helppo kantaa mukana,
Kysymys 5 Compared to the workload, the number of credits awarded was (1 credits equals 27 working hours): (4)
: (4)") Tilasto T1106120-s2012palaute Kyselyn T1106120+T1106120-s2012palaute yhteenveto: vastauksia (4) Kysymys 1 Degree programme: (4) TIK: TIK 1 25% ************** INF: INF 0 0% EST: EST 0 0% TLT: TLT 0 0% BIO:
Tilasto T1106120-s2012palaute Kyselyn T1106120+T1106120-s2012palaute yhteenveto: vastauksia (4) Kysymys 1 Degree programme: (4) TIK: TIK 1 25% ************** INF: INF 0 0% EST: EST 0 0% TLT: TLT 0 0% BIO:
Kaasutukseen perustuvat CHP-tekniikat. ForestEnergy2020 -tutkimus- ja innovaatio-ohjelman vuosiseminaari, Joensuu, 8-9.10.2013
 Kaasutukseen perustuvat CHP-tekniikat ForestEnergy2020 -tutkimus- ja innovaatio-ohjelman vuosiseminaari, Joensuu, 8-9.10.2013 10.10.2013 Ilkka Hiltunen Biomass Gasification to Different Final Products
7. Product-line architectures
 7. Product-line architectures 7.1 Introduction 7.2 Product-line basics 7.3 Layered style for product-lines 7.4 Variability management 7.5 Benefits and problems with product-lines 1 Short history of software
Kestävä ja älykäs energiajärjestelmä
 Ilmansuojeluyhdistys syyskokous 23.11.2017 Kestävä ja älykäs energiajärjestelmä Espoon kaukolämpö hiilineutraaliksi 2030 Ilkka Toijala / Head of Heating and Cooling, Finland / 23.11.2017 Kattava kaukolämpöverkko,
Information on preparing Presentation
 Information on preparing Presentation Seminar on big data management Lecturer: Spring 2017 20.1.2017 1 Agenda Hints and tips on giving a good presentation Watch two videos and discussion 22.1.2017 2 Goals
Alternative DEA Models
 Mat-2.4142 Alternative DEA Models 19.9.2007 Table of Contents Banker-Charnes-Cooper Model Additive Model Example Data Home assignment BCC Model (Banker-Charnes-Cooper) production frontiers spanned by convex
TIEKE Verkottaja Service Tools for electronic data interchange utilizers. Heikki Laaksamo
 TIEKE Verkottaja Service Tools for electronic data interchange utilizers Heikki Laaksamo TIEKE Finnish Information Society Development Centre (TIEKE Tietoyhteiskunnan kehittämiskeskus ry) TIEKE is a neutral,
Characterization of clay using x-ray and neutron scattering at the University of Helsinki and ILL
 Characterization of clay using x-ray and neutron scattering at the University of Helsinki and ILL Ville Liljeström, Micha Matusewicz, Kari Pirkkalainen, Jussi-Petteri Suuronen and Ritva Serimaa 13.3.2012
Fighting diffuse nutrient load: Multifunctional water management concept in natural reed beds
 PhD Anne Hemmi 14.2.2013 RRR 2013 Conference in Greifswald, Germany Fighting diffuse nutrient load: Multifunctional water management concept in natural reed beds Eutrophication in surface waters High nutrient
Tork Xpress Soft Multifold käsipyyhe. etu
 etu Erinomainen imukyky: kuivaa kädet nopeasti Pehmeä: hellävarainen käsille Tork Carry Pack -pakkaus helpottaa käsittelyä ja hävittämistä Lehti kohokuviointi: suunniteltu tekemään kauniin vaikutelman
Maapallon energiavarat
 Luonnonfilosofian seura Tieteiden talo 2.10.2003 klo 18.00 Maapallon energiavarat Tkt Tuomo Suntola T. Suntola 1 Luonnonfilosofian seura Tieteiden talo 2.10.2003 klo 18.00 Maapallon energiavarat Tkt Tuomo
Exercise 1. (session: )
") EEN-E3001, FUNDAMENTALS IN INDUSTRIAL ENERGY ENGINEERING Exercise 1 (session: 24.1.2017) Problem 3 will be graded. The deadline for the return is on 31.1. at 12:00 am (before the exercise session). You
EEN-E3001, FUNDAMENTALS IN INDUSTRIAL ENERGY ENGINEERING Exercise 1 (session: 24.1.2017) Problem 3 will be graded. The deadline for the return is on 31.1. at 12:00 am (before the exercise session). You
MUSEOT KULTTUURIPALVELUINA
 Elina Arola MUSEOT KULTTUURIPALVELUINA Tutkimuskohteena Mikkelin museot Opinnäytetyö Kulttuuripalvelujen koulutusohjelma Marraskuu 2005 KUVAILULEHTI Opinnäytetyön päivämäärä 25.11.2005 Tekijä(t) Elina
Increase of opioid use in Finland when is there enough key indicator data to state a trend?
 Increase of opioid use in Finland when is there enough key indicator data to state a trend? Martta Forsell, Finnish Focal Point 28.9.2015 Esityksen nimi / Tekijä 1 Martta Forsell Master of Social Sciences
Toimintamallit happamuuden ennakoimiseksi ja riskien hallitsemiseksi turvetuotantoalueilla (Sulfa II)
") Toimintamallit happamuuden ennakoimiseksi ja riskien hallitsemiseksi turvetuotantoalueilla (Sulfa II) Happamuuskuormituksen ennustaminen valuma-aluetasolla Marie Korppoo ja Markus Huttunen 13.5.2019 Päämäärä
Toimintamallit happamuuden ennakoimiseksi ja riskien hallitsemiseksi turvetuotantoalueilla (Sulfa II) Happamuuskuormituksen ennustaminen valuma-aluetasolla Marie Korppoo ja Markus Huttunen 13.5.2019 Päämäärä
Valuation of Asian Quanto- Basket Options
 Valuation of Asian Quanto- Basket Options (Final Presentation) 21.11.2011 Thesis Instructor and Supervisor: Prof. Ahti Salo Työn saa tallentaa ja julkistaa Aalto-yliopiston avoimilla verkkosivuilla. Muilta
LX 70. Ominaisuuksien mittaustulokset 1-kerroksinen 2-kerroksinen. Fyysiset ominaisuudet, nimellisarvot. Kalvon ominaisuudet
 LX 70 % Läpäisy 36 32 % Absorptio 30 40 % Heijastus 34 28 % Läpäisy 72 65 % Heijastus ulkopuoli 9 16 % Heijastus sisäpuoli 9 13 Emissiivisyys.77.77 Auringonsuojakerroin.54.58 Auringonsäteilyn lämmönsiirtokerroin.47.50
Storages in energy systems
 Storages in energy systems 110 kv 110/20 kv z 20/0.4 kv z Centralized energy storage (primary substation) Centralized energy storage (secondary substation) Customer -level energy storage (house) Prof.
Suomen Aurinkolämpö Oy
 Suomen Aurinkolämpö Oy Verkkoon kytkettävät aurinkopaneelijärjestelmät Marko Harju 0505123254 Suomenaurinkolampo.fi Yritysesittely Kajaanilainen 2012 perustettu perheyritys Kilpailukykyisiä tuotteita,
Metsäbiomassaan perustuvien nestemäisten biopolttoaineiden ilmastovaikutukset
 Metsäbiomassaan perustuvien nestemäisten biopolttoaineiden ilmastovaikutukset FORESTENERGY2020 tutkimusohjelman tutkijaseminaari, VTT, 4.6.2012 Sampo Soimakallio VTT Technical Research Centre of Finland
Land-Use Model for the Helsinki Metropolitan Area
 Land-Use Model for the Helsinki Metropolitan Area Paavo Moilanen Introduction & Background Metropolitan Area Council asked 2005: What is good land use for the transport systems plan? At first a literature
Innovative and responsible public procurement Urban Agenda kumppanuusryhmä. public-procurement
 Innovative and responsible public procurement Urban Agenda kumppanuusryhmä https://ec.europa.eu/futurium/en/ public-procurement Julkiset hankinnat liittyvät moneen Konsortio Lähtökohdat ja tavoitteet Every
Social and Regional Economic Impacts of Use of Bioenergy and Energy Wood Harvesting in Suomussalmi
 Social and Regional Economic Impacts of Use of Bioenergy and Energy Wood Harvesting in Suomussalmi Green Cities and Settlements 18.2.2014 Ville Manninen Writers Project group Sirpa Korhonen, Anna Mari
Bounds on non-surjective cellular automata
 Bounds on non-surjective cellular automata Jarkko Kari Pascal Vanier Thomas Zeume University of Turku LIF Marseille Universität Hannover 27 august 2009 J. Kari, P. Vanier, T. Zeume (UTU) Bounds on non-surjective
BLOCKCHAINS AND ODR: SMART CONTRACTS AS AN ALTERNATIVE TO ENFORCEMENT
 UNCITRAL EMERGENCE CONFERENCE 13.12.2016 Session I: Emerging Legal Issues in the Commercial Exploitation of Deep Seabed, Space and AI BLOCKCHAINS AND ODR: SMART CONTRACTS AS AN ALTERNATIVE TO ENFORCEMENT
Mat Seminar on Optimization. Data Envelopment Analysis. Economies of Scope S ysteemianalyysin. Laboratorio. Teknillinen korkeakoulu
 Mat-2.4142 Seminar on Optimization Data Envelopment Analysis Economies of Scope 21.11.2007 Economies of Scope Introduced 1982 by Panzar and Willing Support decisions like: Should a firm... Produce a variety
On instrument costs in decentralized macroeconomic decision making (Helsingin Kauppakorkeakoulun julkaisuja ; D-31)
") On instrument costs in decentralized macroeconomic decision making (Helsingin Kauppakorkeakoulun julkaisuja ; D-31) Juha Kahkonen Click here if your download doesn"t start automatically On instrument costs
On instrument costs in decentralized macroeconomic decision making (Helsingin Kauppakorkeakoulun julkaisuja ; D-31) Juha Kahkonen Click here if your download doesn"t start automatically On instrument costs
Uusiutuva/puhdas energia haasteita ja mahdollisuuksia. Prof. Jarmo Partanen
 Uusiutuva/puhdas energia haasteita ja mahdollisuuksia Prof. Jarmo Partanen jarmo.partanen@lut.fi +358 40 5066564 Electricity Market, targets Competitive ness Sustainab ility Technical requirement; keep
Defining nearly zero in Finland - FInZEB
 Defining nearly zero in Finland - FInZEB HP4NZEB-seminar 15.06.2015 1 A nearly zero energy (EPBD) (EU Energy Performance of Buildings Directive) Extremely high energy efficiency Energy demand is covered
Siirtymä maisteriohjelmiin tekniikan korkeakoulujen välillä Transfer to MSc programmes between engineering schools
 Siirtymä maisteriohjelmiin tekniikan korkeakoulujen välillä Transfer to MSc programmes between engineering schools Akateemisten asioiden komitea Academic Affairs Committee 11 October 2016 Eija Zitting
Yksityisen sektorin rooli kestävän kehityksen tavoitteiden saavuttamiseksi kansanvälisesti
 Yksityisen sektorin rooli kestävän kehityksen tavoitteiden saavuttamiseksi kansanvälisesti Vesikysymykset kansainvälisessä luonnonvarapolitiikassa Kaj Jansson Maa- ja metsätalousministeriö/luonnonvarasto
Ikärakennemuutos, tulot ja kulutus Reijo Vanne, Työeläkevakuuttajat TELA. Sisältö. Päälähteet
 Helsingin yliopisto Sosiaalitieteiden laitos Yhteiskuntapolitiikka Luentosarja: Suomi ikääntyy 2015 19.2.2015 Ikärakennemuutos, tulot ja kulutus Reijo Vanne, Työeläkevakuuttajat TELA Sisältö Käsitteitä:
Constructive Alignment in Specialisation Studies in Industrial Pharmacy in Finland
 Constructive Alignment in Specialisation Studies in Industrial Pharmacy in Finland Anne Mari Juppo, Nina Katajavuori University of Helsinki Faculty of Pharmacy 23.7.2012 1 Background Pedagogic research
S Sähkön jakelu ja markkinat S Electricity Distribution and Markets
 S-18.3153 Sähkön jakelu ja markkinat S-18.3154 Electricity Distribution and Markets Voltage Sag 1) Kolmivaiheinen vastukseton oikosulku tapahtuu 20 kv lähdöllä etäisyydellä 1 km, 3 km, 5 km, 8 km, 10 km
Technische Daten Technical data Tekniset tiedot Hawker perfect plus
 Technische Daten Technical data Tekniset tiedot Hawker perfect plus PzS-Zellen Hawker perfect plus, mit Schraubverbindern, Abmessungen gemäß DIN/EN 60254-2 und IEC 254-2 Serie L PzS-cells Hawker perfect
Supply Chain Management and Material Handling in Paper Industry Case Tervakoski Oy
 Tampere University of Applied Sciences Paper technology International Pulp and Paper Technology Supply Chain Management and Material Handling in Paper Industry Case Tervakoski Oy Supervisor Commissioned
Exercise 3. (session: )
") 1 EEN-E3001, FUNDAMENTALS IN INDUSTRIAL ENERGY ENGINEERING Exercise 3 (session: 7.2.2017) Problem 3 will be graded. The deadline for the return is on 28.2. at 12:00 am (before the exercise session). You
1 EEN-E3001, FUNDAMENTALS IN INDUSTRIAL ENERGY ENGINEERING Exercise 3 (session: 7.2.2017) Problem 3 will be graded. The deadline for the return is on 28.2. at 12:00 am (before the exercise session). You
FYSE301(Elektroniikka(1(A3osa,(kevät(2013(
 FYSE301(Elektroniikka(1(A3osa,(kevät(2013( 1/2 Loppukoe1.3.2013 vastaakaikkiinkysymyksiin(yhteensä48pistettä) 1. Kuvailelyhyesti a. Energialineaarisissapiirielementeissä:vastuksessa,kondensaattorissajakelassa(3
3 9-VUOTIAIDEN LASTEN SUORIUTUMINEN BOSTONIN NIMENTÄTESTISTÄ
 Puhe ja kieli, 27:4, 141 147 (2007) 3 9-VUOTIAIDEN LASTEN SUORIUTUMINEN BOSTONIN NIMENTÄTESTISTÄ Soile Loukusa, Oulun yliopisto, suomen kielen, informaatiotutkimuksen ja logopedian laitos & University
Avaus: Ajankohtaista EU:sta
 Avaus: Ajankohtaista EU:sta ylijohtaja Riku Huttunen Energiamarkkinavirasto Syöttötariffijärjestelmän ajankohtaispäivä, Helsinki 27.11.2012 Energiamarkkinavirasto Markkinavalvonta Antti Paananen Päästökauppa
ECSEL - Electronic Components and Systems for European Leadership
 ECSEL lyhyesti 2015 ECSEL - Electronic Components and Systems for European Leadership The Public-Private Partnership keeping Europe at the Forefront of Technology Development Electronic Components and
National Building Code of Finland, Part D1, Building Water Supply and Sewerage Systems, Regulations and guidelines 2007
 National Building Code of Finland, Part D1, Building Water Supply and Sewerage Systems, Regulations and guidelines 2007 Chapter 2.4 Jukka Räisä 1 WATER PIPES PLACEMENT 2.4.1 Regulation Water pipe and its
Results on the new polydrug use questions in the Finnish TDI data
 Results on the new polydrug use questions in the Finnish TDI data Multi-drug use, polydrug use and problematic polydrug use Martta Forsell, Finnish Focal Point 28/09/2015 Martta Forsell 1 28/09/2015 Esityksen
Copernicus, Sentinels, Finland. Erja Ämmälahti Tekes,
 Copernicus, Sentinels, Finland Erja Ämmälahti Tekes, 24.5.2016 Finnish Space industry in the European context European Space industry has been constantly growing and increasing its direct employment in
performance DHW coil type exchanger Diverter valve Analogue thermostat control panel Heating pump DHW pump Digital electronic control panel
 ACTIVA HIGH PERFORMANCE STEEL HEATER UNIT HIGH PERFORMANCE STEEL HEATER UNIT ACTIVA PLUS High energy efficiency obtained due to the LASIAN body structural features of high heat exchange surface area and
Seppo Niemi Energiatekniikka Teknillinen tiedekunta
 Seppo Niemi Energiatekniikka 29.8.2016 Teknillinen tiedekunta Roadmap Background GHG emissions to be lowered Renewables Gases The share of electricity rises Electricity grids Systems and devices become
Seppo Niemi Energiatekniikka 27.8.2015. Teknillinen tiedekunta
 Seppo Niemi Energiatekniikka 27.8.2015 Teknillinen tiedekunta UV FOCUS AREAS Distributed energy production Renewable fuels and energy Gas and diesel engines Engine-driven power plants Flexible power generation
Biometaanin tuotannon ja käytön ympäristövaikutusten arviointi
 From Waste to Traffic Fuel W-Fuel Biometaanin tuotannon ja käytön ympäristövaikutusten arviointi 12.3.2012 Kaisa Manninen MTT Sisältö Laskentaperiaatteet Perus- ja metaaniskenaario Laskennan taustaa Tulokset
Reliable sensors for industrial internet
 Reliable sensors for industrial internet 21.5.2015 Anu Kärkkäinen, PhD Research Team Leader VTT Technical Research Centre of Finland anu.karkkainen@vtt.fi Click to edit Master Contents title style Click
Maapallon energiaratkaisut: Mistä puhdasta energiaa?
 Energiatieteiden ja -tekniikan tutkijakoulun vuosiseminaari TKK 27.08.2007 Maapallon energiaratkaisut: Mistä puhdasta energiaa? Tkt Tuomo Suntola T. Suntola 2007-08-27 / 1 Energiatieteiden ja -tekniikan
Introduction to Automotive Structure
 Supakit Rooppakhun Introduction to Automotive Structure The main purpose is to: Support all the major components and sub assemblies making up the complete vehicle Carry the passengers and/or payload in
Hiilineutraalin Turun toimenpiteet ja haaste Lounais-Suomen yhteinen ilmastohaaste, Rauma Turun kaupunginhallituksen puheenjohtaja Olli A
 Hiilineutraalin Turun toimenpiteet ja haaste Lounais-Suomen yhteinen ilmastohaaste, Rauma 6.4.2017 Turun kaupunginhallituksen puheenjohtaja Olli A Manni Hiilineutraali kaupunkialue 2040 mennessä Turun
KONEISTUSKOKOONPANON TEKEMINEN NX10-YMPÄRISTÖSSÄ
 KONEISTUSKOKOONPANON TEKEMINEN NX10-YMPÄRISTÖSSÄ https://community.plm.automation.siemens.com/t5/tech-tips- Knowledge-Base-NX/How-to-simulate-any-G-code-file-in-NX- CAM/ta-p/3340 Koneistusympäristön määrittely
Suomestako öljyvaltio? Kari Liukko
 Päättäjien Metsäakatemia Kurssi 34 Maastojakso 22.-24.5 2013 Suomestako öljyvaltio? Kari Liukko Öljyn hinta, vaihtotase, työllisyys, rikkidirektiivi TE 3.5.-13 TE 3.5.-13 TE 26.4.-13 KL 21.8.-12 2 PMA
GOOD WORK LONGER CAREER:
 Juhani Ilmarinen, Ville Ilmarinen, Pekka Huuhtanen, Veikko Louhevaara, Ove Näsman GOOD WORK LONGER CAREER: WORK WELL-BEING IN FINNISH TECHNOLOGY INDUSTRIES 2010-2015 Background Collective agreement between
Wärtsilä Corporation. Interim Report January-June 2003 Ole Johansson President & CEO. 31 July Wärtsilä
 Wärtsilä Corporation Interim Report January-June 2003 Ole Johansson President & CEO 31 July 2003 Group structure Power Divisions Engine division Marine Power Plants Service Holding Assa Abloy 7.6% 2 Group
Liikenteen biopolttoaineet
 Liikenteen biopolttoaineet Jäte- ja tähdepohjaisen uusiutuvan dieselin ilmastohyödyt Pekka Tuovinen Using advanced refinery technologies 3 15 November 2018 Uusiutuvat tuotteet TUOTANTOKAPASITEETTI: 2,7
TAMPEREEN TEKNILLINEN YLIOPISTO Teollisuustalous
 Muista merkita nimesi Ja opiskeliianumerosi iokaiseen paperiin. Myös optiseen lomakkeeseen. Älii irroita papereita nipusta. Kaikki paperit on palautettava. TAMPEREEN 290 10 10 Tuotannonohjauksen tentti
Statistical design. Tuomas Selander
 Statistical design Tuomas Selander 28.8.2014 Introduction Biostatistician Work area KYS-erva KYS, Jyväskylä, Joensuu, Mikkeli, Savonlinna Work tasks Statistical methods, selection and quiding Data analysis
Wärtsilä Corporation. Interim Report January-September 2003 Ole Johansson President & CEO. 29 October Wärtsilä
 Wärtsilä Corporation Interim Report January-September 2003 Ole Johansson President & CEO 29 October 2003 Highlights of the reporting period Order intake of Power Divisions increased. Clear improvement
Pricing policy: The Finnish experience
 Pricing policy: The Finnish experience Esa Österberg Senior Researcher Alcohol and Drug Research, STAKES, Helsinki, Finland esa.osterberg@stakes.fi Three pillars of traditional Nordic alcohol control Strict
METSÄT JA ENERGIA Kannattaako keskittyä hajautettuun? Pekka Peura
 METSÄT JA ENERGIA Kannattaako keskittyä hajautettuun? Pekka Peura 28.6.2016 Kestävä energiahuolto Järkevä energian käyttö Rational Use of Energy (RUE) - Energian säästö - Energiatehokkuus Integration Sustainability
The role of 3dr sector in rural -community based- tourism - potentials, challenges
 The role of 3dr sector in rural -community based- tourism - potentials, challenges Lappeenranta, 5th September 2014 Contents of the presentation 1. SEPRA what is it and why does it exist? 2. Experiences
ABB Oy Domestic Sales 20.10.2015 Harri Liukku Aurinkosähköjärjestelmät Kytkennät
 ABB Oy Domestic Sales 20.10.2015 Harri Liukku Aurinkosähköjärjestelmät Kytkennät ABB Group ABB on johtava sähkövoima- ja automaatioteknologiayhtymä. Potentiaalisina kasvualueina uusiutuva energia ja liikenteen
Informaatioteknologia vaikuttaa ihmisten käyttäytymiseen ja asenteisiin
 Infotech Seminar, Oulu, November 11, 2005 Informaatioteknologia vaikuttaa ihmisten käyttäytymiseen ja asenteisiin Prof. Harri Oinas-Kukkonen Dept. Information Processing Science University of Oulu Outline
Collaborative & Co-Creative Design in the Semogen -projects
 1 Collaborative & Co-Creative Design in the Semogen -projects Pekka Ranta Project Manager -research group, Intelligent Information Systems Laboratory 2 Semogen -project Supporting design of a machine system
Re-use of Surplus Foundry Sand by Composting (LIFE13 ENV/FI/000285)
") Re-use of Surplus Foundry Sand by Composting (LIFE13 ENV/FI/000285) Duration of project: 01 August 2014 30 September 2017 Total budget: 2,051.644 EU contribution: 996,070 Life 2014 infoseminaari ja työpaja
Re-use of Surplus Foundry Sand by Composting (LIFE13 ENV/FI/000285) Duration of project: 01 August 2014 30 September 2017 Total budget: 2,051.644 EU contribution: 996,070 Life 2014 infoseminaari ja työpaja
Aurinkoenergia kehitysmaissa
 Aurinkoenergia kehitysmaissa TEP Syyskokous 29.11.2013 Markku Tahkokorpi Aurinkoteknillinen yhdistys ry Utuapu Oy Esityksen rakenne Yleistä aurinkoenergiasta Aurinkosähkö Aurinkolämpö Muu aurinkoenergia
Master's Programme in Life Science Technologies (LifeTech) Prof. Juho Rousu Director of the Life Science Technologies programme 3.1.
 Prof. Juho Rousu Director of the Life Science Technologies programme 3.1.") Master's Programme in Life Science Technologies (LifeTech) Prof. Juho Rousu Director of the Life Science Technologies programme 3.1.2017 Life Science Technologies Where Life Sciences meet with Technology
Master's Programme in Life Science Technologies (LifeTech) Prof. Juho Rousu Director of the Life Science Technologies programme 3.1.2017 Life Science Technologies Where Life Sciences meet with Technology
Laskuri investointien avuksi
 Bioenergy4Business A project for the uptake of solid biofuels in promising European heat market segments Laskuri investointien avuksi Lämpöyrittäjäpäivä 18.4.2016, Savonlinna Timo Määttä Motiva Bioenergy4Business-hanke