Number of oligodendrocytes and. size of the myelinated area in mice exposed to chronic psychosocial stress
|
|
|
- Jutta Kähkönen
- 6 vuotta sitten
- Katselukertoja:
Transkriptio

1 Number of oligodendrocytes and size of the myelinated area in mice exposed to chronic psychosocial stress Master s Thesis Aino Heikkinen Master s Programme in Genetics and Molecular Biosciences Faculty of Biological and Environmental Sciences University of Helsinki 2018
2 Tiedekunta Fakultet Faculty Faculty of Biological and Environmental Sciences Tekijä Författare Author Aino Heikkinen Työn nimi Arbetets titel Title Number of oligodendrocytes and size of the myelinated area in mice exposed to chronic psychosocial stress Oppiaine/Opintosuunta Läroämne/Studieinriktning Subject/Study track Molecular and Analytical Health Biosciences Työn laji Arbetets art Level Master s Thesis Tiivistelmä Referat Abstract Koulutusohjelma Utbildingsprogram Degree Programme Master s Programme in Genetics and Molecular Biosciences Aika Datum Month and year 11/2018 Sivumäärä Sidoantal Number of pages 85 Chronic psychosocial stress is a major risk factor for anxiety disorders, but the molecular background is still poorly known. Chronic social defeat stress (CSDS) is a mouse model simulating the psychosocial stress that humans face in their life. In CSDS, the examined mice are confronted by an aggressor mouse daily for 10 days, leading to defeat behavior and predisposing to anxiety-like symptoms. Some individuals develop these symptoms (susceptible) whereas others do not (resilient). Chronic stress has been shown to alter myelin-related gene transcription and myelin microstructure. Myelin is a membranous component around axons increasing the velocity of action potentials, and it is produced by oligodendrocytes (OLs). In this study, I investigated if CSDS affects the number of OLs or the size of the myelinated area (estimating the amount of myelin) in two inbred mouse strains that differ in their innate level of anxiety: the non-anxious C57BL/6NCrl (B6) and anxious DBA/2NCrl (D2). I studied three brain regions previously associated with anxiety: the medial prefrontal cortex (mpfc), bed nucleus of stria terminalis (BNST) and ventral hippocampus (vhp). The mice used in this study were previously exposed to CSDS and divided into resilient or susceptible phenotypes, and their brains were collected together with control mice. I performed two immunohistochemical staining experiments to calculate the number of OLs and to measure the myelinated area. I used anti-cnpase for OL cell counts and BlackGold II to stain myelin. I manually calculated the number of OLs using CNPase and cell morphology as markers. I built a macro to measure the BlackGold II stained myelinated area. I also measured the thickness of the corpus callosum (CC, major white matter tract) using the CNPase stained images to examine if the thickness is affected by CSDS. I observed a strain and region-specific effect of chronic stress in the BNST; B6 resilient mice had more OLs than susceptible mice whereas no differences were seen in the D2 strain, or other B6 brain regions. The size of the myelinated area did not differ between the phenotypes in either strain. Moreover, there was no significant correlation between the myelinated area and OL cell number. The CC thickness did not differ between the phenotypes. My findings indicate that myelin and OLs are affected by stress in a region specific manner and possibly contribute to the stress-resilient behavior. The response is genetic background-dependent, as I saw differences in B6 mice but not in D2 mice. Because CC thickness did not differ between the phenotypes, we suggest that CSDS does not induce extensive white matter atrophy in the mice brain. The mechanism underlying this dynamic myelin plasticity during stress requires more investigation, but this study provides evidence that alterations in OLs associate with chronic stress. Avainsanat Nyckelord Keywords Chronic social defeat stress, oligodendrocytes, myelin, anxiety, immunohistochemistry Ohjaaja tai ohjaajat Handledare Supervisor or supervisors Iiris Hovatta and Mikaela Laine Säilytyspaikka Förvaringställe Where deposited Muita tietoja Övriga uppgifter Additional information 1
3 Tiedekunta Fakultet Faculty Bio- ja ympäristötieteellinen tiedekunta Tekijä Författare Author Aino Heikkinen Työn nimi Arbetets titel Title Psykososiaalisen stressin vaikutukset oligodendrosyyttien ja myeliinin määrään hiirillä Oppiaine/Opintosuunta Läroämne/Studieinriktning Subject/Study track Molecular and Analytical Health Biosciences Työn laji Arbetets art Level Maisterin tutkielma Tiivistelmä Referat Abstract Koulutusohjelma Utbildingsprogram Degree Programme Genetiikan ja Molekulaaristen Biotieteiden maisteriohjelma Aika Datum Month and year 11/2018 Sivumäärä Sidoantal Number of pages 85 Krooninen psykososiaalinen stressi on huomattava riskitekijä ahdistuneisuushäiriöiden puhkeamisessa. Häiriöiden taustalla olevat molekyylitason muutokset tunnetaan huonosti. Ahdistuneisuutta voidaan tutkia hiirillä käyttämällä kroonista psykososiaalista stressimallia, joka altistaa ahdistuneisuuskäyttäytymiselle. Stressimallissa tutkittava hiiri asetetaan samaan tilaan kookkaamman hiiren kanssa päivittäin kymmeneksi minuutiksi, kymmenen päivän ajan. Yksilöitä, joilla ahdistusoireet voidaan havaita, kutsutaan alttiiksi (eng. susceptible) ja ne, joilla oireita ei nähdä, ovat resilienttejä (eng. resilient). Kroonisen stressin on aiemmin havaittu vaikuttavan eräiden myeliinissä esiintyvien proteiinien geenien ilmentymiseen sekä muokkaavan myeliinin rakennetta. Myeliini on lipideistä ja proteiineista koostuva aine, joka kietoutuu viejähaarakkaiden ympäri lisäten aktiopotentiaalien kulkunopeutta. Oligodendrosyytit (OL) tuottavat myeliiniä. Tässä tutkimuksessa tavoitteeni oli selvittää, vaikuttaako krooninen psykososiaalinen stressi OL:ien määrään tai myelinisoituneen alueen kokoon, joka ennustaa myeliinin määrää. Tutkimuksessa käytettiin kahta eri hiirikantaa, joiden sisäsyntyinen ahdistuneisuus eroaa toisistaan: ei-ahdistunut C57BL/6NCrl-kanta (B6) ja ahdistunut DBA/2NCrl-kanta (D2). Tutkittavat aivoalueet (mediaalinen etuaivokuori, mpfc; bed nucleus of the stria terminalis, BNST sekä ventraalinen hippokampus, vhp) ovat aiemmin liitetty stressi- ja ahdistuneisuuskäyttäytymiseen hiirillä ja ihmisillä. Tutkimuksessa käytetyt hiiret olivat aiemmin altistettu psykososiaaliselle stressille, minkä jälkeen hiiret luokiteltiin ryhmiin (resilientti tai altis) sosiaalisen käyttäytymisen perusteella. Kontrollihiiriä ei stressattu. Hiirten aivot kerättiin, minkä jälkeen värjäsin tutkittavien aivoalueiden OL:t ja myeliinin immunohistokemiallisin menetelmin. OL-värjäyksissä käytin CNPase -vasta-ainetta ja myeliinivärjäyksissä BlackGold II aurohalofosfaattiyhdistettä. OL:ien määrän laskin käyttäen CNPase -väriä ja solumorfologiaa apuna tunnistuksessa. Myeliinimäärää laskiessani kehitin makron, joka automaattisesti määritti aivoalueiden BlackGold II:lla värjätyn myelinisoituneen alueen koon. Aivokurkiaisen (CC; laaja valkoisen aineen alue) paksuuden laskin CNPase kuvia käyttäen. Tulokseni osoittavat, että psykososiaalisen stressin vaikutukset riippuvat aivoalueesta sekä yksilön perintötekijöistä: B6 resilienteillä hiirillä huomattiin suurempi määrä OL:jä kuin alttiilla hiirillä BNST:ssä, kun taas saman kannan muilla aivoalueilla ei eroja havaittu. D2-kannan OL-määrissä ei ollut eroja. Myelinisoituneessa alueessa tai CC:n paksuudessa ei ollut eroja ryhmien välillä millään aivoalueella, kummankaan kannan hiirillä. OL:ien määrä ja myelinisoitunut alue eivät korreloineet keskenään. Tulokseni osoittavat, että OL:t ovat alttiita stressille aivoaluekohtaisesti, ja niissä tapahtuvat muutokset voivat olla tekijänä stressikäyttäytymisessä. B6 hiirillä havaittiin eroja mutta D2 hiirillä ei, joten vaste on riippuvainen perinnöllisistä tekijöistä. CC:n paksuudessa ei ollut eroja ryhmien välillä, mistä voidaan päätellä, ettei psykososiaalinen stressi aiheuta laajaa valkoisen aineen atrofiaa hiirten aivoissa. Tulokseni viittaavat OL:n ja stressin väliseen vuorovaikutukseen, mutta ilmiön mekanismien selvittämiseen vaaditaan lisää tutkimuksia. Avainsanat Nyckelord Keywords Krooninen psykososiaalinen stressi, oligodendrosyytti, myeliini, ahdistuneisuus, immunohistokemia Ohjaaja tai ohjaajat Handledare Supervisor or supervisors Iiris Hovatta ja Mikaela Laine Säilytyspaikka Förvaringställe Where deposited Muita tietoja Övriga uppgifter Additional information 2
4 Table of Contents 1.1. Anxiety disorders Prevalence and risk factors Neuronal circuits of anxiety Stress-induced anxiety Mouse models for anxiety disorders Myelin in the central nervous system Structure and formation Myelin plasticity in adult brain Myelination associates with chronic stress Previous results from our group Aims of the study MATERIALS AND METHODS The corpus callosum thickness and the number of oligodendrocytes BlackGold II staining of the myelinated area Statistical analysis RESULTS No differences in corpus callosum thickness between control and stressed mice B6 resilient mice have more oligodendrocytess in the BNST than susceptible mice Size of the myelinated area does not differ between the phenotypes No significant correlation between the number of oligodendrocytes and the amount of myelin DISCUSSION Chronic psychosocial stress does not cause global white matter atrophy Region-specific differences in the number of oligodendrocytes Myelinated area was not affected in chronic stress Number of oligodendrocytes does not correlate with the size of the myelinated area Strengths and limitations Future perspectives and conclusions...31 ACKNOWLEDGEMENTS
5 REFERENCES APPENDIX 1. IMAGEJ MACRO FOR MEASURING BLACKGOLD II STAINED MYELINATED AREA APPENDIX 2. LAINE, TRONTTI, MISIEWICZ, SOKOLOWSKA ET AL., 2018: GENETIC CONTROL OF MYELIN PLASTICITY AFTER CHRONIC PSYCHOSOCIAL STRESS (RESEARCH ARTICLE) List of abbreviations B6 = C57BL/6NCrl mouse strain BLA = basolateral amygdala BNST = bed nucleus of the stria terminalis CC = corpus callosum CSDS = chronic social defeat stress CVS = chronic variable stress D2 = DBA/2NCrl mouse strain DTI = diffusion tensor imaging HPA axis = hypothalamic pituitary adrenal axis mpfc = medial prefrontal cortex OL = oligodendrocyte OPC = oligodendrocyte precursor cell TEM = transmission electron microscopy vhp = ventral hippocampus 4
6 1. Introduction 1.1. Anxiety disorders Prevalence and risk factors Anxiety is a physiological and emotional response to uncertain stimuli which are experienced as threatening. It includes constant worrying and anticipation about occasions that necessarily are not even present or will never occur but that provoke an unpleasant, internal feeling of anguish. Anxiety is linked with but still distinct from fear, which is mostly a consequence of a certain, identifiable dangerous stimulus (LeDoux and Pine, 2016). Anxious feelings emerge occasionally as a normal part of life, but when anxiety is prolonged or unmanageable, it is considered as mental illness. Anxiety disorders are the most common group of mental disorders with an estimated lifetime prevalence of 14% in Europe (Wittchen et al., 2011). The disorders are often chronic, lasting for years or even decades. Anxiety disorders include several sub-types, all of which share similar symptoms (anxious feelings) but also have their own characteristic features. The sub-types include specific phobias, social phobia, generalized anxiety disorder and panic disorder (American Psychiatric Association, 2013). Notably, many patients fulfil the criteria for multiple sub-types of anxiety disorders and other mental diseases contemporarily suggesting a high comorbidity among the psychiatric disorders (Kaufman and Charney, 2000). This may indicate a lack of exclusive diagnostic methods that would reflect the absolute biological basis of these psychiatric disorders. While the molecular and cellular basis of anxiety disorders is still poorly understood, several risk factors have been identified. These include early life stress (e.g. childhood abuse and maltreatment), low socioeconomic status and genetic susceptibility (Blanco et al., 2014; Moreno-Peral et al., 2014). According to twin studies the heritability across the sub-types is 30 40% (Hettema et al., 2001). This number may be an underestimation due to the difficulties in reliable diagnostics and distinction of genetic and environmental factors in human studies Neuronal circuits of anxiety Even though the molecular pathways underlying anxiety are still mostly to be uncovered, we have gained information about the neuronal circuits of anxiety using in vivo imaging and optogenetic techniques. The key brain regions regulating anxiety appear to be, among a few others, amygdala, medial prefrontal cortex (mpfc), bed nucleus of the stria terminalis (BNST) and the ventral hippocampus (vhp) (Duval et al., 2015). These regions are interconnected with several reciprocal 5
7 connections, and the overall response is dependent on their coordinated activity (Calhoon and Tye, 2015). The amygdala receives sensory inputs from the cortical structures and the thalamus (Romanski et al., 1993). The signals are further convoyed into the BNST, a part of the extended amygdala, through the basolateral amygdala (BLA). The recruitment of the BNST is essential and associated with anxiety disorders (Davis et al., 2010; Walker and Davis, 1997). The BNST contains multiple nuclei, some of which have opposing role in mediating anxiety and are either anxiolytic (inhibit anxiety) or anxiogenic (induce anxiety) (S. Y. Kim et al., 2013). The BLA is reciprocally connected to the vhp (Felix-Ortiz et al., 2013), which has been implicated in promoting anxiety-like behavior by targeting the lateral septum (Risold and Swanson, 1996) and activating corticotropin-releasing factor receptors (Henry et al., 2006). The BLA and vhp both innervate the mpfc which is responsible for evaluating threatening stimuli and mediating goaldirected behavior (Carlén, 2017; Hübner et al., 2014). The synchronized activity between the mpfc and the vhp is increased in mice exposed to anxiogenic environment (Adhikari et al., 2010). The anxiety network is dependent on all of the implicated regions and the wide representation of multiple types of synapses between and within neurons of brain regions. Importantly, the anxiety circuit is not a one-way signaling road (Calhoon and Tye, 2015). It is dependent on every brain area involved that modulate one another both directly and indirectly. Nevertheless, the described neuronal circuit of anxiety is abridged, as there are several important regions in mediating the final response. Multiple local microcircuits have also been identified within some regions (S. Y. Kim et al., 2013; Tye et al., 2011), activation of which can determine whether the projections are anxiolytic or anxiogenic, as seen in the BNST. As the brain regions are closely cooperating with each other, even the slightest perturbations (e.g. in myelination, see Lang and Rosenbluth, 2003) can possibly unbalance the system by disturbing the synchronization of the brain Stress-induced anxiety There is well-established association between prolonged stress and the development of anxiety disorders (Blanco et al., 2014; Moreno-Peral et al., 2014). The behavioral and physiological symptoms followed by chronic stress are similar to those seen in anxiety disorders (Kalinichev et al., 2002) indicating common neuronal and molecular pathways. Stress activates the hypothalamic pituitary adrenal (HPA) axis and the sympathetic nervous system, increases the noradrenaline levels and induces immune system activation. HPA-axis activation causes a multi-step cascade which is 6
8 finally detected as a release of glucocorticoids to the blood circulation from the adrenal cortex (de Groot and Fortier, 1959). It is suggested that the corticotropin-releasing factor -dependent dysregulation of HPA-axis has a major pathophysiological role in mood disorders although its contribution to anxiety disorders is less clear (Van Den Bergh et al., 2008). Imaging studies have also shown similar brain activation patterns in mice after chronic stress in the BNST, vhp and the mpfc (Laine et al., 2017; Vialou et al., 2014) as those seen in humans with anxiety disorders (Etkin and Wager, 2007) Mouse models for anxiety disorders Unbiased human studies on anxiety disorders and stress are difficult to carry out as the patients are diagnosed by subjective interviews. The environmental factors that individuals are exposed to cannot be controlled, and therefore all patients have different background in life experiences, life styles and medication. In addition, in vivo techniques for detailed data on central nervous system (CNS) are still very limited, as the acquired resolution is too low for understanding the underlying molecular mechanisms. More advanced method, for instance, in positron emission topography (PET) are under development to track synthetized agents binding to specific brain structures (e.g. myelin (Tiwari et al., 2016). This allows a closer insight into the brain properties, but detailed level human data is currently only acquired from post mortem brains. Mouse models, in contrast, allow improved control of the environmental factors and genetic background. Mice are related closely enough to humans in evolution being mammals and having a CNS. Furthermore, whole genome of 36 different mouse strains (Keane et al., 2011) are completely sequenced uncovering the strainspecific differences. As the stress-response is conserved across mammals, we may utilize mice for studying the associated mechanisms. Even though there are downsides regarding mouse models, use of them offers an insight to the molecular networks closely related to those of humans, as the two species share many common physiological features. There are several approaches to study anxiety in mice. As mice are innately anxious, some strains more than others (Hovatta et al., 2005), one may compare mice from different genetic backgrounds to see whether some genes are differentially expressed in different strains. Quantitative trait locus (QTL) mapping is a widely used genetic technique to identify genes underlying complex phenotypic outcomes, such as anxiety. Producing transgenic mouse models by knocking out genes assumed to be related to anxiety-like behavior allows us to compare the differences between wild type and transgenic mice. Another approach is to artificially disturb the normal environment of mice to 7
9 induce stress. It can include social isolation, restraining, social defeat, forced swimming and perturbations in the light-dark cycle and in the home cages (reviewed in Lezak et al., 2017). As mice are incapable of verbally express their feeling, behavioral tests to measure anxiety-like behavior are required. Generally, there are two approaches to test mice for anxiety-like behavior: approach-avoidant and defensive behavior. Approach-avoidant tests are based on the innate tendency of mice to seek for dark, enclosed space which increases when facing possible threatening stimuli. Elevated plus maze (EPM) is frequently used to measure the willingness of mice to explore open spaces (Lister, 1987) whereas the light-dark test measures the latency to enter the light space from the darkness (Crawley and Goodwin, 1980). Defensive behavior, on the other hand, arises as a response to frightening stimulus and can be observed as freezing or startle behavior (Lezak et al., 2017). Each of the tests provides an insight to anxiety-levels by measuring behavior of mice. Even though animal studies are valuable tools to acquire knowledge at highly detailed level, some problems are often involved. For instance, we may not assume that the responses animals show in threatening situations (e.g. freezing) are a consequence of similar emotions that humans perceive as anxiety or stress. However, as the physiological and neurological responses to stress are much alike between the two species (Cryan and Holmes, 2005), these studies are often comparable with humans. By developing suitable animal models and combining the information from multiple tests simultaneously, animal models offer us irreplaceable molecular-level information that would be impossible to acquire in human studies. The ethical issues must always be recognized when working with animals. The investigation should be done using in vitro models as far as possible, and animal models considered only when there are no other alternatives. The animal number should be carefully determined and minimized. Regarding anxiety, the in vitro models do not exist, and behavioral analysis are required in examining the level of anxiety. Therefore, animal models are utilized in this study Chronic social defeat stress Chronic social defeat stress (CSDS) is a mouse model allowing the identification of factors underlying chronic stress (Golden et al., 2011). It is designed to mimic the psychosocial stress that humans face in their life (e.g. bullying, lack of positive social contact). Our group previously used CSDS to induce stress in mice to study stress-related alterations on their behavior and neurobiology; the mice of this study also went through the following protocol. 8

10 In the model, the examined mice are confronted by a different-strain aggressor mouse by placing them in the home cage of the aggressor for 10 minutes (Fig 1.1.A). After the confrontation, mice are housed together with the aggressor in the same cage, divided by a perforated plexiglass wall allowing sensory contact between the mice but preventing physical interaction. The protocol is repeated for 10 days, using novel aggressors each day. Control mice are handled every day and housed together with another control mouse, without being in physical contact with each other (Fig 1.1.B.). Figure 1.1. Illustration of social defeat (A, B) and social avoidance (C) tests. A) The examined mice are confronted by an aggressor mouse for 10 minutes and then housed in the same cage divided by perforated plexiglass wall. B) Control mice are housed with another control similarly than the examined mouse. C) Mice are tested for social avoidance defined by the time they spend in the interaction zone without social target divided by the time in the IZ when the target is present. IZ: interaction zone Image by Laine (2016, MSc thesis) Social avoidance test divides mice into resilient or susceptible Twenty-four hours after the last social defeat confrontation, the examined mice are measured for social avoidance (SA). The SA test measures social interaction; decreased latency of interaction is a typical symptom in humans with anxiety disorder (Sarnoff and Zimbardo, 1961). SA is observed in stress-susceptible mice (Krishnan et al., 2007) whereas individuals who do not show SA are referred as resilient. Moreover, stress-susceptible mice spend more time in the closed space (Laine et al., 2018) and display anhedonia (decreased sucrose preference) (Krishnan et al., 2007). These features are not seen in resilient mice. Resilience is a phenomenon common among humans as well; despite the presence of risk factors, most individuals never develop anxiety-disorder but rather adapt to the circumstances (Bonanno et al., 2006). 9
11 In the SA test, mice are first placed in an arena which contains an empty, perforated plastic cylinder for 150 seconds. The time they spend in the interaction zone (IZ, near the cylinder) is measured (Fig 1.1.C.). After this, a novel aggressor mouse is put in the cylinder and the examined mouse is allowed to explore the area, and the time they spend in the IZ is again measured. The SA score is then calculated by dividing the time in the IZ with the aggressor by the time without the aggressor. To consider the strain-specific differences in baseline social behavior, the border line for susceptible and resilient is calculated separately for each strain according to how control mice score (detailed description in Laine et al., 2018). The basic idea of the model is to detect which of the defeated mice resemble the controls (resilient) and which of them display diminished social interaction (susceptible) Myelin in the central nervous system Structure and formation Myelin is an insulating membranous structure wrapped around axons to increase the velocity of the action potentials and to offer metabolic support to axons (Funfschilling et al., 2012; Lappe-Siefke et al., 2003). In the brain, myelin is produced by certain neuroglia called oligodendrocytes (OL). Abnormalities in OLs and in the white matter (myelinated axons) have been associated with several psychiatric disorders, such as schizophrenia, major depression and anxiety disorders (Hakak et al., 2001; Yoo et al., 2007; Zou et al., 2008). Myelination continues until the fourth decade of human life (Miller et al., 2012), and it is a highly plastic process regulated by multiple neuronal and molecular mechanisms throughout the lifespan (see chapter ). OLs differentiate from OL precursor cells (OPCs). OPCs are born in the ventricular zone of the developing central nervous system and spread throughout the brain and spinal cord (Noll and Miller, 1993). OPCs are triggered to differentiate into OLs by neuronal activity (Barres and Raff, 1993) and extracellular signals (Brinkmann et al., 2008; Fancy et al., 2009). However, some of the OPCs stay undifferentiated in the adult brain to act as a reservoir to enable remyelination when needed (Ruffini et al., 2004). Differentiation from OPC to OL occurs through several sub-stages of immature, non-myelinating OLs that have been identified (Marques et al., 2016). Myelin formation begins once the stable contact between the OL and the axon is established, with help of many molecular interactions and cell-adhesion molecules. OLs fine-tune their gene expression to acquire molecules essential for the sheath structure. The growth of the myelin sheath takes place in the leading edge (i.e. inner tongue, Fig 1.2.) (Snaidero et al., 2014). The newly formed 10

12 leaflet is always located underneath the previous one, which requires a constant breakdown of axon-ol contact. Contemporarily, the sheath expands towards the Ranvier node, the unmyelinated part of the axon where the voltage-gated sodium channels, necessarily for membrane depolarization and signal conduction, are concentrated (Freeman et al., 2015). Cytoplasmic channels run through the myelin sheath and are maintained by CNPase (2,3 -cyclic nucleotide 3 - phosphodiesterase) (Snaidero et al., 2014). The channels allow molecules and locally translated mrnas to be transported to the leading edge to support the myelin formation. Figure 1.2. CNS myelination Myelin formation takes place in the inner tongue of the newly formed myelin sheath, which is budded from the oligodendrocytes but remains contacted with the cell via cytoplasmic channels. The final myelin sheath is thickest in the middle and thinnest near the Ranvier nodes with only few leaflets. (Image from Snadeiro et al., 2014) Myelin plasticity in adult brain Myelin is not an unaltered insulator unable to modify its structure after formation, but a highly plastic element sensitive to multiple signaling compounds. In fact, myelination does not occur homogenously throughout the brain and some axons are even left unmyelinated (Skoff et al., 1980). Changes in white matter have been observed not only in psychiatric diseases but also as a result of learning and task performance (Liston et al., 2006; McKenzie et al., 2014; Scholz et al., 2009) suggesting a major role of myelin plasticity in the brain function of adults. Myelin impacts the conduction velocity of neuronal impulses by adjusting the thickness (Hursh, 1939) and lateral length (Brill et al., 1977) of myelin sheath, which causes large variation in the conduction velocity between myelinated and unmyelinated axons (Smith and Koles, 1970; Waxman and Bennett, 1972). Demyelination in the corpus callosum (CC), the major white matter tract in the brain connecting the left and right hemispheres, is associated with severe neurological diseases such as multiple sclerosis (MS) and Marchiafava-Bignami disease (Chang et al., 1992) causing motor and cognitive dysfunctions. Modifications in the myelin sheath impacts notably on the propagation of the action 11
13 potential and brain communication and may have significant consequences on behavior (McKenzie et al., 2014). The exact mechanisms underlying myelin plasticity in the adult brain have not been characterized extensively but some regulatory factors are identified. It is currently acknowledged that myelination is an activity-dependent process promoted in electrically active axons and reduced if the propagation of impulses is blocked (Demerens et al., 1996). This is likely due to the secretion of several signaling molecules from the axon membrane as a consequence of neuronal activity. Release of ATP, for instance, is an activity-dependent process and known to induce differentiation of OPCs and promote myelination by activating the purinergic receptors on the OPC cell membrane (Stevens et al., 2002). Glutamate release from synaptic vesicles induces the transcription of myelin-related genes and affects myelination (Koudelka et al., 2016; Wake et al., 2011). Furthermore, different patterns of axonal firing (e.g. frequency of impulses) alters the expression of cell-adhesion molecules. This may weaken the neuron-glia interactions and reduce myelination (Stevens et al., 1998). Even though OLs and OPCs are not electrically excitable themselves, they respond to neural signaling and form synapses with nearby axons (Bergles et al., 2000; Lin and Bergles, 2004). Taken together, neuronal activity has a considerable impact on myelination to accurately support the axon signaling activity. Myelin plasticity may mediate altered cognitive, sensory and motor functions by interrupting interconnected signaling pathways which may, at its worst, increase the risk for mental disorders Myelination associates with chronic stress As briefly mentioned in chapter , there is an association between altered myelination and development of psychiatric diseases. Human neuroimaging studies (e.g. diffusion tensor imaging, DTI) have revealed changes in the white matter in patients with psychiatric disorders (Zou et al., 2008). DTI is based on the diffusion of water molecules providing data about the brain s structural properties (Alexander et al., 2007). This method, however, requires a good resolution and large number of patients when examining small scale changes in white matter. Stress-induced differential expression in myelin-related genes has been observed in both humans (Lutz et al., 2017) and mice (Laine et al., 2018; Liu et al., 2017). Studies have also revealed lower number of mature oligodendrocytes in humans with background of stressful environment in childhood (Lutz et al., 2017) and mice after chronic stress (Lehmann et al., 2017). The pathways underlying stress-induced myelination depend on multiple variables. For instance, the severity of the stress has a significant 12
14 influence on the response: 14 days social isolation (relatively mild stress model) fails to impact myelin-related gene expression in the CC (Liu et al., 2012) whereas 28 days of chronic variable stress increases myelin-related gene expression there (Liu et al., 2017). However, both studies show a decrease in the expression of myelin-related genes in the mpfc. This not only demonstrates the variation caused by different stress models but also the possibility of regional specificity of stress. Interestingly, myelin abnormalities after chronic stress do not emerge unambiguously nor unidirectionally. Studies have reported myelin loss in the mpfc after stress (Lehmann et al., 2017) but also an increased genetic background dependent myelin thickness in stress-susceptible mice (Laine et al., 2018). Variability in the results is possibly due to dissimilar circumstances during the study, which demonstrates the high sensitivity of myelin plasticity to distinct environmental signals. Nevertheless, with standardized research conditions we are more likely to reveal the regulatory factors underlying myelin plasticity in the brain Previous results from our group Our group previously revealed that genetic background impacts on the stress-susceptibility and anxiety-like behavior in mice using four inbred mouse strains (C57BL/6NCrl [B6], DBA/2NCrl [D2], BALB/cAnNCrl and 129S2/SvPasCrl) that went through the CSDS protocol (Appendix 2). We selected two strains that differ most in their behavior: B6 (69% resilient) and D2 (5% resilient) (Laine et al., 2018). D2 mice are thus more susceptible to the stress, and they are also innately more anxious than B6 strain (Hovatta et al., 2005). We sequenced the RNA of D2 and B6 mice and saw that myelinrelated genes are differently expressed after the CSDS in the mpfc, BNST and vhp. B6 susceptible mice showed lower gene expression levels of OL-associated genes in the mpfc and vhp, but higher expression of these genes in the BNST, compared to the same-strain controls. We also performed transmission electron microscopy (TEM) and showed that myelin thickness varied between control, resilient and susceptible mice: B6 susceptible had thicker myelin in the BNST compared to resilient mice, and thinner myelin sheath in the vhp compared to control mice. These observations together suggest region-specific and genetic background-dependent response to chronic stress Aims of the study The previous results on the differences of myelin thickness after chronic stress from our group raised the question whether the number of OLs or the amount of myelin are influenced by CSDS. Because of the observed strain-specific results, I studied mice from different genetic backgrounds. As we previously observed region-selective effect of chronic stress, I selected three brain regions for this 13
15 study, all of which have been previously associated with anxiety disorders: the mpfc, including subregions of cingulate cortex area 1 (Cx1), prelimbic cortex (PrL) and infralimbic cortex (IL); the BNST and the vhp, including the pyramidal layers 1 (CA1) and 3 (CA3). In addition, I examined whether CSDS also affects the thickness of CC, the major white matter tract in the brain. Atrophy in the CC is often seen in severe demyelinating conditions (see chapter 4.1.). Based on the previous literature and results from our group, my specific aims were to: o examine whether the structure of the CC is affected by chronic stress which would be seen as differences in its thickness between control, resilient and susceptible mice. o establish whether psychosocial stress affects the number of OLs in the mpfc, BNST and vhp. o examine if CSDS affects the degree of myelination, estimated by the size of the myelinated area in the mpfc, BNST and vhp. o determine if the number of OLs and the myelinated area correlate with each other. I used anti-cnpase antibody staining for determining the number of OLs and BlackGold II staining to visualize myelin. Anti-CNPase is an antibody against CNPase, which is a highly abundant protein in OLs and myelin (see Chapter 1.2.1). BlackGold II is a widely-used gold-based solution that stains myelin, even though its binding mechanism remains unknown (Schmued et al., 2008). 2. Materials and Methods I used previously acquired brain sections from B6 and D2 mice that had gone through the social defeat protocol as described in chapter The number of animals was following: B6 [control 7, resilient 8, susceptible 4] and D2 [control 6, resilient 4, susceptible 8] (Figure 2.1.). Mice had been previously anesthetized and perfused with 4 % paraformaldehyde in phosphate buffer saline (PBS) after which the brains were collected and sliced with a vibratome in 20 m sections by other Hovatta lab members. The slices were stored as free-floating sections in cryoprotectant in -20 C. 14

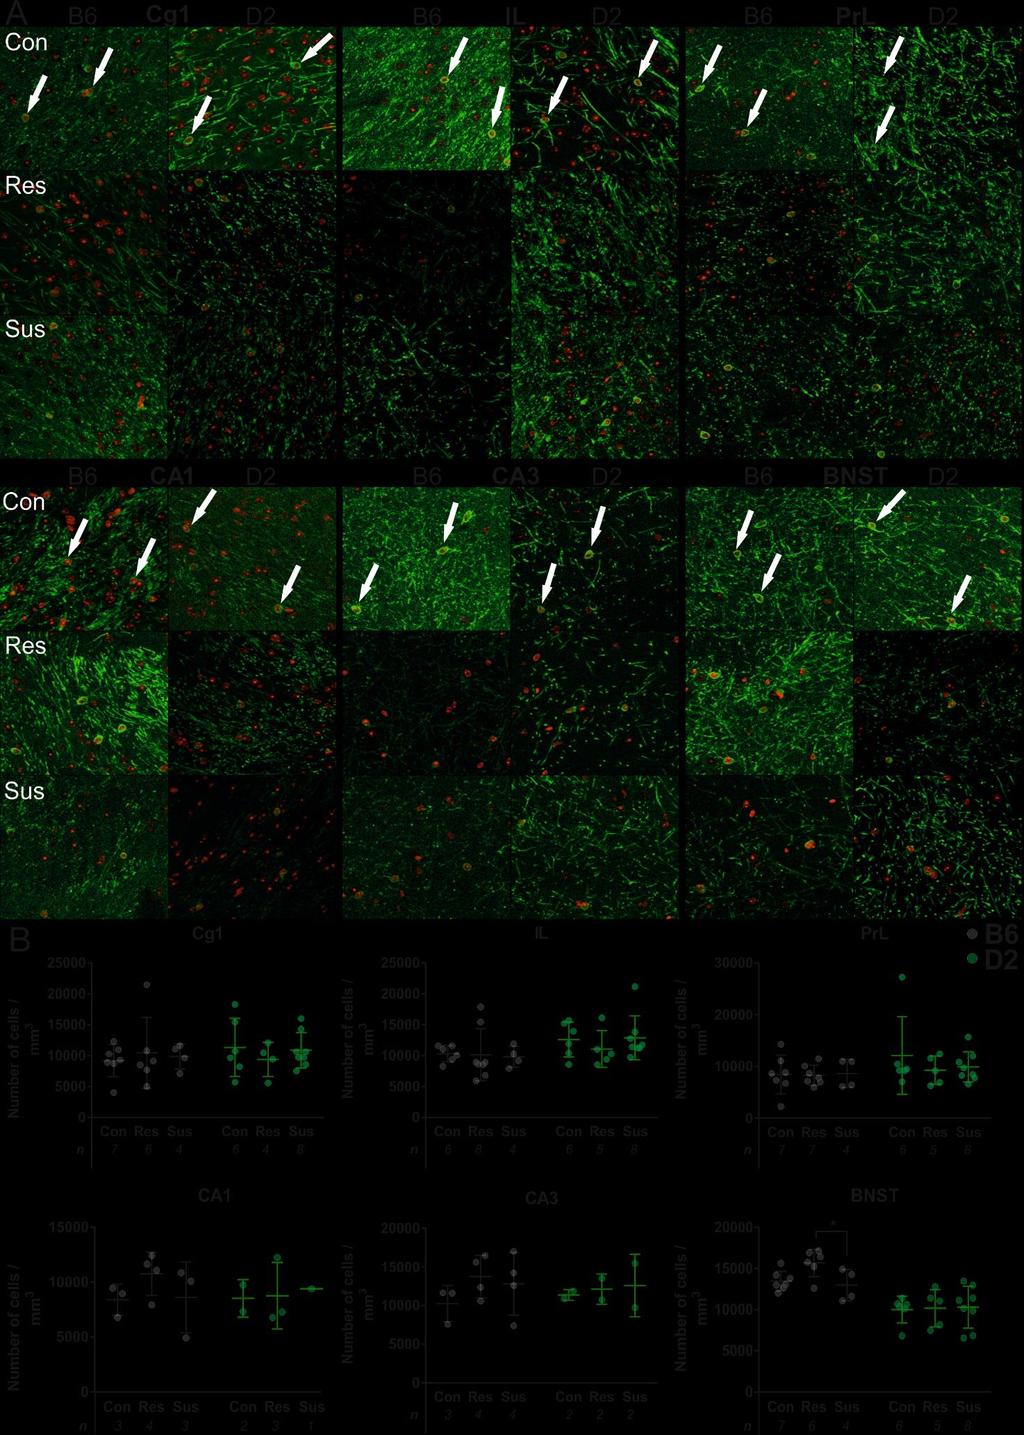
16 Figure 2.1. Social avoidance scores and borders for B6 and D2 strains that are used in this study. The border lines are adjusted by the scores of the control mice within each strain. The genetic background affects the stress-susceptibility of mice, D2 being innately more anxious than B The corpus callosum thickness and the number of oligodendrocytes I washed the brain sections 3 x in PBS and mounted on Superfrost Ultra Plus slides TM (#J4800AMNT, ThermoFisher Scientific) [Distances from Bregma: mpfc ; vhp (-3.40); CC and BNST )] (Figure 2.2.). I performed antigen retrieval by submerging the slides in 0.01 M citrate buffer, heated to a boil and microwaved on low for 20 minutes. I then blocked the slides in 2.5 % BSA (bovine serum albumin) in 0.5 % PBST (PBS with Tween-20) % normal goat serum followed by primary antibody incubation in mouse anti-cnpase (1:250, Merck Life Science, #MAB326R) overnight at +4 C. I washed the slides again 3 x in PBS before goat anti-mouse Alexa Fluor 488-conjugated secondary antibody incubation (1:400, ThermoFisher Scientific, #A-11029) for 2 hours at room temperature (RT). After washing in PBS I coverslipped the slides with Vectashield + DAPI mounting medium (Vector Laboratories, #H-1200), fastened them with clear nail polish and stored in +4 C. I acquired the images with an Axio Imager 2 microscope (ZEISS) with the Apotome.2 system (ZEISS) and processed them with Zen Blue edition software (ZEISS). Next, I analyzed the images with ImageJ software (1.47, National Institution of Health). I selected 615 µm x 405 µm (Cg1, PrL, IL, CA1 and CA3) or 475 µm x 475 µm (BNST) regions of interest (ROI) and counted positive cells manually using CNPase staining and cell morphology as markers (Figure 2.3.). I was blind to the condition and strain of the samples during staining and quantification. 15


17 I measured the CC thickness using ImageJ by drawing two vertical lines across the CC, measuring the length and calculating their mean. I took the measurements close to the midline, distance from the midline varying µm. Figure 2.2. Coronal sections of the mpfc, BNST & CC and vhp. Coordinates of the sections relative to Bregma are presented below each image. All images used in the experiments are between these ranges. Areas of interests are marked with green lines except at the CC where they represent the lines of measurement. (Atlas images modified from The Mouse Brain in Stereotaxic Coordinates (Third Edition) by Franklin and Paxinos, 2007) BNST: bed nucleus of the stria terminalis; CA1: pyramidal layer 1; CA3: pyramidal layer 3; CC: corpus callosum; Cg1: cingulate cortex 1; IL: infralimbic cortex; mpfc: medial prefrontal cortex; PrL: prelimbic cortex vhp: ventral hippocampus. Figure 2.3. CNPase stained mature OLs indicated by white arrows. The red color indicates DAPI (modified from blue) binding to cell nuclei. The green color shows the presence of the myelin and the outer membrane of OLs. Using the co-localization of the two markers OLs can be identified and counted. 16

18 2.2. BlackGold II staining of the myelinated area I washed free-floating sections and mounted them as previously described (see chapter 2.1.). I then dehydrated the slides on a 60 C heat-plate for 30 minutes and allowed to air-dry for 2.5 hours at RT. Next, I rehydrated the slides in MQ for 2 minutes followed by incubation in 0.3 % Black Gold II (Merck Life Science, #AG105) + 0.9% sodium chloride (NaCl) in a warm incubation chamber ( 60 C) for 26 minutes. After washing 2 x 2 minutes in Milli-Q water (MQ), I added 700 µl of 1% sodium thiosulfate onto each slide and incubated for 3 minutes in the incubation chamber. I then washed the slides again 3 x in MQ and dehydrated in graded ethanol (70 %, 95 % and 100 %) and in Neo-Clear (Merck Life Science, #109843) 5 minutes in each. I coverslipped the slides with Neo-Mount (Merck Life Science, #109016) and stored in +4 C. I acquired the images using 3DHISTECH Scanner by Digital microscopy scanner service (Institute of Biology, University of Helsinki). ROIs were captured from the digitized images with Pannoramic viewer software (3DHISTECH) by the personnel in Institute of Biotechnology, after which I analyzed the images with ImageJ. The imaged regions were the mpfc including Cg1 and PrL sub-regions (IL was left out because of the lack of myelin staining in that area, see Figure 2.4.); the BNST and the vhp including CA1 and CA3 sub-regions. I measured the mean grey value (MGV) of the images, defining the amount of background in the images. Images with an MGV below 203 were considered high background images and images with MGV above 203 were low background images. I then designed a macro with the help of one of the Hovatta group members, Zuzanna Misiewicz, to measure the size of myelinated area (Appendix 1). First, Brightness and Contrast were adjusted to subtract the background, differentially for low and high background images. Apart from this step, the macro was identical for both types of images. After Brightness and Contrast adjustment images went through color deconvolution with manually defined vectors to pick out the desired color (purple: red = 0.53, green = 0.66, blue = 0.53, see Figure 2.5) and extinguish other ones. Next, images were thresholded and analyzed for particles (particles with circularity below 0.35 were discarded) which disposes of the noise in the image. The area (µm 2 ) was then measured automatically using ImageJ. Finally, I double-checked the images in case of folds or dirt distorting the results and left them out from the statistical analysis. Figure 2.4. BlackGold II stained brain section. There were none or very little myelin visible in the area of IL due to which it was not included in the final analysis. Bregma: Cg1: cingulate cortex 1; PrL: prelimbic cortex; IL: infralimbic cortex. 17

 B6 18, 20, 11 D2 21, 4, 21 BlackGold II Cg1 (cingulate cortex area 1) B6 37, 32, 14 D2")
19 As I used the same animals in both of the stainings, this allowed me to do inter-individual comparisons between the two measurements. I ran Pearson correlation analysis to see how strongly the amount of myelin was correlating with the number of oligodendrocytes. Figure 2.5. Flowchart of the key steps of BlackGold II image processing in ImageJ software. Table 2.1. Total number of images by brain region and strain. Con: control; Res: resilient; Sus: susceptible Staining method Brain region Strain CNPase CC (corpus callosum) B6 18, 20, 11 D2 21, 4, 21 BlackGold II Cg1 (cingulate cortex area 1) B6 37, 32, 14 D2 22, 17, 37 PrL (prelimbic cortex) B6 32, 31, 15 Number of acquired images (Con, Res, Sus) D2 24, 20, 39 IL (infralimbic cortex) B6 25, 35, 17 D2 22, 20, 37 BNST (bed nucleus of the stria B6 31, 25, 14 terminalis) D2 27, 14, 32 CA1 (pyramidal cells layer 1) B6 14, 12, 10 D2 8, 8, 8 CA3 (pyramidal cells layer 3) B6 12, 12, 10 D2 9, 8, 8 TOTAL: 835 mpfc (medial prefrontal cortex); Cg1 & PrL B6 23, 27, 19 D2 13, 10, 24 BNST (bed nucleus of the stria B6 26, 31, 12 terminalis) D2 13, 15, 22 vhp (ventral hippocampus); CA1 & CA3 B6 15, 16, 8 D2 4, 5, 15 TOTAL:
. I then analyzed the data using SPSS statistics software 24.0 (IBM Corporation).")
20 2.3. Statistical analysis The total number of obtained images per mouse strain is presented in Table 2.1. I discarded animals with only one acquired image from the analysis (not included in the table). I then analyzed the data using SPSS statistics software 24.0 (IBM Corporation). First, I calculated the mean of each animal, then split the data by the strain and the phenotype and checked for outliers defined as three standard deviations above or below the group mean. Outliers were excluded from the final analysis. I then examined the distribution of the data by using the Shapiro-Wilk normality test. To examine the differences between the phenotypes (control, resilient and susceptible) for both strains separately I used one-way ANOVA for the normally distributed data and elsewhere the Kruskal- Wallis nonparametric statistical test. For multiple testing correction I used Bonferroni post-hoc test for determining significant differences between two phenotypes within a strain. For the correlation analysis I applied Pearson s correlation coefficient test. Statistical significance level was set at Results 3.1. No differences in corpus callosum thickness between control and stressed mice To examine whether chronic stress affects the major white matter tracts in the mouse brain, I measured the thickness of the CC between Bregma As presented in Figure 3.1. A, there were no significant differences in the thickness between the groups of the two strains (One-way ANOVA; B6: F(2, 12) = 0.290, p = 0.754; D2: F(2, 14), p = 0.794). Figure 3.1. A) Coronal atlas of the corpus callosum and representations of the lines of measurement. The thickness was measured at the two white vertical lines across the corpus callosum. The distance from the midline of the measurements varied from 100 µm to 300 µm. Bregma of this atlas image is Scale bar (for the closeup image of the CC): 100 µm. B) Corpus callosum thickness was not altered after CSDS. No significant differences were observed in the thickness (µm) between control, resilient and susceptible mice in B6 or D2 strain. The number of animals is presented below the X-axis. Each data point represents the mean value of all acquired images of an animal. Total range of images was 2-6 sections per animal. Data is presented as mean ± SD. CC: corpus callosum; Con: control; Res: resilient; Sus: susceptible; B6: C57BL/6NCrl mouse strain; D2: DBA/2NCrl mouse strain. 19
21 3.2. B6 resilient mice have more oligodendrocytess in the BNST than susceptible mice Based on the transcriptomic differences between the defeated and control mice, it was my interest to investigate whether the differences can be seen at the cellular level as well. I examined differences between the phenotypes in the mpfc, further divided into Cg1, PrL and IL sub-regions; in the BNST; and in the vhp, divided into CA1 and CA3 sub-regions. In the BNST, B6 resilient mice had more OLs compared to the susceptible mice (Bonferroni post-hoc test, adj. p-value = 0.049). No differences were observed in other brain regions or in D2 mice (Figure 3.2. & Table 3.1.). Table 3.1. Results of the statistical analysis of the OL cell counts. The main effect for each brain region was analyzed using one-way ANOVA or Kruskal-Wallis nonparametric test depending on the distribution of the data (see Materials and Methods). Significant differences are bolded. Cg1: cingulate cortex area 1; PrL: prelimbic cortex; IL: infralimbic cortex; CA1: pyramidal cells 1; CA3: pyramidal cells 3; BNST: bed nucleus of the stria terminalis; B6: C57BL/6NCrl mouse strain; D2: DBA/2Crl mouse strain; N: number of animals. F: F-test score of ANOVA; χ 2 : Chi-Square test score of Kruskal- Wallis (K-W). Strain Region Stat.test F / χ 2 p B6 Cg1 ANOVA F(2, 14) = B6 PrL ANOVA F(2, 15) = B6 IL K-W χ 2 (2) = B6 BNST ANOVA F(2, 14) = B6 CA1 ANOVA F(2, 7) = B6 CA3 ANOVA F(2, 8) = D2 Cg1 ANOVA F(2, 15) = D2 PrL K-W χ 2 (2) = D2 IL K-W χ 2 (2) = D2 BNST K-W χ 2 (2) = D2 CA1 ANOVA F(2, 3) = D2 CA3 ANOVA F(2, 3) = Size of the myelinated area does not differ between the phenotypes I examined the size of the myelinated area using BlackGold II gold phosphate complex which binds to myelin. The brain regions of interest were the same as in the CNPase stains, except that IL was not included. Thus, the size of the myelinated area was measured in the mpfc, including Cg1 and PrL; in the BNST; and in the vhp including CA1 and CA3. Figure 3.3. presents the mean of each animal in each brain region and shows that there were no significant differences in myelinated area between the phenotypes. Results from the statistical analysis are presented in Table 3.2. Notably, defeated groups, including resilient and susceptible individuals, showed a bimodal distribution in the BNST and the vhp; the fold change between the heavily-myelinated and lightly-myelinated being as high as 6 (Figure 3.3 B). 20

22 21
23 Figure 3.2. [previous page] A) CNPase staining of OLs in all groups. Examples of the positive cells are marked with white arrows. Green color corresponds to CNPase and red color to DAPI. B) B6 resilient mice had more OLs in BNST. B6 resilient mice had a significantly larger number of OLs after CSDS compared to susceptible mice. Differences were not observed in other brain regions or in D2 mice. The number of animals is presented below the X-axis. Each data point represents the mean value of all acquired images of one animal. The range of images was 2-8 per animal. Significant differences are marked with an asterisk (*). Data is presented as mean ± SD. Con: control; Res: resilient; Sus: susceptible; Cg1: cingulate cortex area 1; PrL: prelimbic cortex; IL: infralimbic cortex; CA1: pyramidal cells 1; CA3: pyramidal cells 3; BNST: bed nucleus of the stria terminalis; B6: C57BL/6NCrl mouse strain; D2: DBA/2NCrl mouse strain. Table 3.2. Results of the statistical analysis of the BlackGold II myelin staining. Differences within each group were analyzed using one-way ANOVA or Kruskal-Wallis nonparametrical test depending on the distribution of the data (see Materials and Methods). mpfc: medial prefrontal cortex; BNST: bed nucleus of the stria terminalis; vhp: ventral hippocampus; B6: C57BL/6NCrl mouse strain; D2: DBA/2NCrl mouse strain; N: number of animals. F: F-test score of ANOVA; χ 2 : Chi- Square test score of Kruskal-Wallis. Strain Region Stat. test F/ χ 2 p B6 mpfc ANOVA F(2,15) = B6 BNST K-W χ 2 (2, N) = B6 vhp K-W χ 2 (2, N) = D2 mpfc ANOVA F(2, 11) = D2 BNST ANOVA F(2, 12) = D2 vhp ANOVA F(2, 4) = No significant correlation between the number of oligodendrocytes and the amount of myelin As I used the same animals in both CNPase cell counts and BlackGold II myelin stains, it was justified to examine the correlation between the two measurements. I calculated the sum of OLs in Cg1 and PrL, corresponding to the mpfc in BlackGold II staining as well as the sum of CA1 and CA3 that form the area vhp in BlackGold II stainings. Interestingly, no significant correlations were observed across the brain regions (r = - 0,109, p = 0,219) nor within the groups (Figure 3.4.) showing that number of OLs, myelin-producing cells, is not always proportional to the amount of myelin. 22
 The size of the myelinated area did not vary significantly between the groups in any brain region. There were no significant differences in the myelinated area after CSDS.")
24 Figure 3.3. A) Example images of BlackGold II stained myelin. Myelin is seen as purple area and lines. B) The size of the myelinated area did not vary significantly between the groups in any brain region. There were no significant differences in the myelinated area after CSDS. Each data point represents the mean of each animal. Range was 2-7 images per animal. Data is presented as mean ± SD. mpfc: medial prefrontal cortex; BNST: bed nucleus of the stria terminalis, vhp; ventral hippocampus; Con: control; Res: resilient; Sus: susceptible; B6: C57BL/6NCrl mouse strain; D2: DBA/2NCrl mouse strain. 23
 which did not have enough animals (more than 2 required) to perform Pearson correlation analysis.")
25 Figure 3.4. No significant correlation between the number of OLs and the myelinated area within the groups according to Pearson correlation coefficients (r) and p- values. In the vhp, there were four groups (B6 Res and D2 phenotypes) which did not have enough animals (more than 2 required) to perform Pearson correlation analysis. mpfc: medial prefrontal cortex; BNST: bed nucleus of the stria terminalis, vhp; ventral hippocampus; Con: control; Res: resilient; Sus: susceptible; B6: C57BL/6NCrl mouse strain; D2: DBA/2NCrl mouse strain. 4. Discussion The aim of this study was to examine whether chronic psychosocial stress impacts the number of OLs or the amount of myelin in mice. I concentrated on three brain regions previously associated with stress-disorders: the mpfc, BNST and vhp. My results show a region and brain region-selective effect of chronic stress on the number of OLs: B6 resilient mice had higher OL cell number in the BNST compared to the same strain susceptible mice. The cell number did not differ in the mpfc or vhp. No differences were observed in the D2 mice. The size of the myelinated area did not differ between control, resilient or susceptible phenotypes. I showed that there is no significant correlation between the OL cell number and the myelin area, indicating that the cell number is not the only factor controlling the myelin amount. Furthermore, I observed that CC thickness did not 24
26 vary between the phenotypes suggesting that CSDS does not induce extensive white matter atrophy in the mouse brain Chronic psychosocial stress does not cause global white matter atrophy Demyelination in the CC causes dysfunctions in the motor, emotional and cognitive functions due to the disruptions in the propagation of neuronal impulses (Chang et al., 1992). I measured the thickness of the CC and showed that it does not differ between the phenotypes indicating that chronic stress does not induce extensive demyelination. Nevertheless, previous studies have reported alterations in CC microstructure. Decrease in myelin density after 14 days of immobilization stress (Choi et al., 2017) and downregulation of myelin-associated genes after 14 and 28 days of chronic variable stress (Lehmann et al., 2017; Liu et al., 2017) were seen in the CC in mice. Upregulation of these genes was observed when prolonging the stress from 21 to 28 days, suggesting dynamicity in the response in certain time points or a compensatory effect induced by myelin loss (Liu et al., 2017). Social isolation, a relatively mild stress model, did not induce any changes in the CC microstructure (Liu et al., 2012). The results indicate that the severity of the stress and the type of the stressor (e.g. psychosocial, physical) may play a role in myelin-related alterations in the CC. Microstructural and large-scale alterations, however, are not fully comparable with each other as gene expression levels or small changes in the protein amount do not always indicate larger modifications, such as extensive demyelination. Nevertheless, macrostructural alterations in the CC have also been implicated in psychiatric disorders; reduced CC volume was reported in patients suffering from PTSD (Jackowski et al., 2008; Villarreal et al., 2004). This may suggest a differential response depending on the severity and duration of the stress. Although this study does not provide information about the possible microstructural changes in the myelin, we can state that extensive white matter atrophy does not occur after CSDS Region-specific differences in the number of oligodendrocytes Chronic stress induces differential expression of myelin and OL-related genes, including essential components for the myelin structure and formation and normal OL function (Laine et al., 2018; Liu et al., 2017). Consequently, I investigated whether the number of the myelin-forming cells differed between the control, resilient and susceptible mice. In the BNST, B6 resilient mice had more OLs compared to susceptible mice, which may indicate that a high number of OLs protects against the anxiety-like behavior by some, as yet unclear, mechanisms. However, as D2 resilient mice did not 25
27 show differences in the BNST, or in the other examined regions, the high number of OLs cannot be the only factor enabling stress-resilient behavior. Interestingly, our group previously found in the TEM analysis that B6 susceptible mice had thicker myelin than resilient and control mice in the BNST. This is not contradictory with my results, assuming different molecular pathways for cell proliferation and myelin formation (see chapter 4.4.). Considering the important role of the BNST in regulating both anxiogenic and anxiolytic responses via its multiple subnuclei, investigating the myelination separately in each nucleus could improve our understanding of the link between myelination and anxiety-responses. This and the other unanswered questions of how OL cell number and myelination are regulated during stress through BNST would make a promising target for future investigation. Observing differences in the number of OLs after CSDS supports the hypothesis of myelin plasticity in stress. Among the three brain regions in this study, the mpfc in anxiety is the most extensively studied. Nevertheless, varying results have been reported in terms of OL cell number after chronic stress. I observed no differences between the phenotypes in either strain. Congruently with my results, 14 days of social defeat does not affect the number of OLs in the mpfc (Lehmann et al., 2017). A decrease in the number of OLs and OPC cells after chronic variable stress (CVS) with randomly distributed stressors, including forced swimming, restraint and social defeat has been reported (Yang et al., 2016). As all the presented studies used mice with a similar genetic background (B6 strain), the ambiguous results are likely due to the distinct environments and the applied stress models. The social defeat protocol includes a similar confrontation between the examined mouse and a novel aggressor each day, whereas in the CVS the stressors are randomly distributed over the period. CVS can be perceived as a more unpredictable and heterotypic stressor than social defeat stress. It is possible that mice have different ability of adapting to heterotypic and homotypic stress models. Adaptation to the stressors is observed at the transcriptomic level as well. Immediately after the beginning of the stress, OL-transcripts are significantly downregulated in the mpfc but return to the control levels after a week. After three weeks, the transcripts are downregulated again (Liu et al., 2017). This group used the CVS model, but unlike Yang s group, the stressors were repeated in the same order rather than randomly. The results indicate a strong association between the mpfc and stress-responses, sensitive to multiple components of the stress exposure. vhp has been reported to have significant projections to the amygdala (Felix-Ortiz et al., 2013) and the mpfc (Adhikari et al., 2010) which both mediate anxiety-like behavior. I did not observe any 26
28 differences in the number of OLs in the CA1 and CA3 of the vhp. Nevertheless, it was previously reported that corticosterone-induced stress increases anxiety-like behavior and oligodendrogenesis in the dentate gyrus of the vhp in adult mice (Chetty et al., 2014), possibly by activating the Fmr1 gene coding for the fragile X mental retardation protein expressed also in the OL cell lineage (Eadie et al., 2009; Giampetruzzi et al., 2013). Release of glucocorticoids as a response to the stress has also been previously shown to increase oligodendrogenesis in the adult hippocampus (Chetty et al., 2014). It is still unclear what the contribution of glucocorticoids to chronic psychosocial stress is if any, as the levels are seen to decrease when habituating to stress (Krishnan et al., 2007). Based on this study, the number of OLs is not affected by chronic stress in the vhp. Taken together, my results show that chronic psychosocial stress affects the OL cell lineage in a region- and genetic background-specific manner. Whether this response is a secondary result of neuronal alteration, or primary and a critical protecting factor for axon function during stress, is unknown. Possibly, the response is dependent on both. As we see in this study, resilient and susceptible mice do not show a similar number of OLs in the BNST, indicating that the stress plays a role in regulating OLs in that region. The region-specificity in the results can be partly explained by a heterogeneous population of OLs throughout the brain (Marques et al., 2016) that may respond differently to the stress due to different locations and connections in the brain. Overall, the alterations in OLs and myelination may reflect changes in the brain signaling networks but it is still unexplained to what magnitude and how this is controlled Myelinated area was not affected in chronic stress Demyelination has been implicated in the mpfc after chronic stress, including thinner myelin sheaths, shorter fiber lengths and a reduction in the myelinated area (Lehmann et al., 2017; Liu et al., 2012). Human DTI studies have demonstrated white matter loss in patients with anxiety disorders (Yoo et al., 2007), especially in the amygdala mpfc pathway (M. J. Kim and Whalen, 2009). This in turn may weaken the coordinated activity between the brain regions and predispose to behavioral and physiological consequences. Thus, it was my interest to examine whether we can see any differences in the myelinated area in the mpfc after CSDS in the mpfc, and in the BNST and the vhp. I observed no differences between the phenotypes in the mpfc in either strain. On the other hand, myelin thickness in the mpfc has been reported to increase in B6-resilient and decrease in D2- resilient mice (Laine et al., 2018). Considering the wide area of the mpfc including multiple cell 27
29 types, the local microcircuits may be differentially myelinated. For instance, different goal-directed tasks (e.g. decision making) are mediated in the PFC in a neuron subtype-specific manner (Pinto and Dan, 2015). Similarly, stress may activate pathways specific to certain neuron subtypes which could reflect alterations in the myelin structure specifically in those axons. Congruently with this theory, it has been previously observed that myelin thickness differs within brain regions and even along an axon (Tomassy et al., 2014). Thus, it is possible that axons located in the stress-activated brain region would show different levels of myelination. Overall, the size of the myelinated area did not vary between the groups, as showed in this study. BNST myelination has not yet been well-studied in chronic stress. However, given that BNST mediates both anxiolytic and anxiogenic behavior (S. Y. Kim et al., 2013), the correct activity and projections to other parts of the brain are critical for the seen outcome. In this study, I showed that despite the difference in the number of OLs in the BNST between the groups (B6 resilient mice having more OLs than control mice), the myelinated area was constant between the phenotypes in both strains. The BLA, closely connected with the BNST, has been reported to have an increased number of myelinated axons in rats after chronic stress (Ono et al., 2008), suggesting also larger myelin area. Our previous study reported an increase in myelin thickness in the stress-susceptible B6 mice in the BNST (Laine et al., 2018), whereas myelin thickness was seen to decrease in the BLA of the stressed rats (Ono et al., 2008). Despite their being physically close and having many reciprocal connections, the BLA and the BNST have partly different functions in mediating stressrelated behavior (reviewed in Adhikari, 2014) and thus, may be myelinated differently. Based on previous studies emphasizing the crucial role of the BNST in the anxiety-responses and this study demonstrating differences in the OLs but not in the myelin area encourages the future investigation to focus on the BNST. The data from the myelinated area of the vhp did not show any significant results, partly due to the low number of animals. However, an interesting aspect in the vhp data, as well as that of the BNST, is bimodal distribution of the individual animals. Approximately half of the individuals showed high myelination and half low myelination in both resilient and susceptible groups, fold change being as high as 6 (see Results 3.3.). Whether the difference in the amount of myelin is a consequence of the stress or a cause to the differential behavior, is unknown. The amount of myelin is clearly not the only factor enabling stress-resilient behavior (as both groups include high and low-myelinated animals) raising an interesting question of the pathways underlying stress-resilience. However, 28
30 myelination might still be an important factor in mediating resilience: results on the myelin-related gene expression and thickness shows differences between control and stress-exposed mice (Laine et al., 2018; Lehmann et al., 2017; Liu et al., 2017). Myelin thickness is affected in the CSDS (Laine et al., 2018), yet I did not see alterations in the myelinated area. However, by determining the myelin thickness using electron microscopy images of cross-sectional axons it is possible to observe changes in the myelin microstructure, which is not possible with immunohistochemical methods of this study. The anatomical resolution is retained with immunohistochemistry, potentially uncovering which of the brain regions are affected, which is not possible with TEM-analysis applied by our group (Laine et al., 2018). Myelin thickness may increase without affecting area, which is also dependent on the length and the number of myelin sheaths. Hence the results are not fully comparable with each other. I showed that no large-scale changes are seen in myelination after chronic psychosocial stress. However, as several studies have reported varying results in terms of myelin plasticity in chronic stress, more investigation is needed on this issue to reveal the possible myelin-associated microstructural changes in the white matter after stress Number of oligodendrocytes does not correlate with the size of the myelinated area This study is the first to discover that no significant correlation between the number of OLs and the myelinated area exists. Therefore, it can be assumed that the amount of myelin cannot be directly estimated from the number of OLs. Myelin biogenesis takes place in OLs, and is regulated by additional factors rather than only the cell number, unlike first hypothesized in the past decades. This adaptive myelination is an important mechanism for fine-tuning the specific connections. As described in Chapter , axonal firing impacts myelination by releasing electrical activitydependent synaptic vesicles (McKenzie et al., 2014; Mensch et al., 2015) and compounds like ATP and glutamate (Stevens et al., 2002; Wake et al., 2011). This release may potentially then induce myelination together with other extracellular signaling molecules such as growth factors (Giulian et al., 1991; Ye et al., 2002). Production of mature OLs is increased during motor learning (McKenzie et al., 2014). As one OL can myelinate several axons simultaneously, the lack of correlation may also signify that there is variation in how many axons are myelinated by a single OL. Additionally, there may exist a certain baseline for the degree of myelination that is maintained over time, correlating with the number of OLs, but in the presence of myelination-inducing or reducing extracellular factors this correlation is lost. This would partly explain the capability of OLs in myelinating artificial 29
31 nanofibers with no electrical signaling (Demerens et al., 1996) but also the observation that myelination is notably promoted by impulse propagation. Although the detailed mechanisms of how myelin plasticity is obtained is still uncovered, some studies have been able to show certain molecular pathways modulating myelin in the brain during stress. These include altered OL differentiation and proliferation, for example, by decreasing the degree of the Wnt/β-catenin signaling pathway (Choi et al., 2017; Fancy et al., 2009) and inducing apoptosis in the OPCs by death receptor 6 (Yang et al., 2016). Epigenetic regulation has also been characterized to alter myelin biogenesis; histone deacetylase is required for OL differentiation and remyelination, whereas increased amounts of histone acetylase is associated with impaired myelination (Shen et al., 2008). Chronic stress has been shown to increase the histone acetylation marks, which impacts myelin plasticity and OL maturation (Liu et al., 2012). Taken together, it is likely that myelin plasticity is modified according to several signaling cascades and extracellular compounds, possibly affected by chronic stress, explaining the lack of correlation between the OLs and myelin Strengths and limitations Several strengths of this study can be acknowledged. Firstly, the CSDS mouse model induces anxietylike behavior, which can be restored with chronic antidepressant treatment (Tsankova et al., 2006), similarly with human anxiety (Williams et al., 2017). Secondly, this study was the first to investigate changes in OLs and myelin, dividing the defeated mice into stress-resilient and stress-susceptible. Combining the resilient and susceptible into one group (stress-exposed) might produce different results than handling them separately in the analysis. Thirdly, I was blind to the phenotype and strain of the animal during analysis, decreasing biased outcome. The statistical analyses were made with multiple corrections with Bonferroni post-hoc test, which reduces the risk of false positive results. The most notable limitation in this study was the small number of animals per group, reducing the statistical power and thus increasing the risk of acquiring false negative results, especially in the vhp dataset. Therefore, the vhp data should be addressed with caution. Some of the phenotypes are rarely acquired after CSDS. D2 mice, for instance, are very sensitive to the stress and mostly score as susceptible. The proportion of D2 resilient mice was notably lower (mean: 3.4 animals per group) compared to D2 susceptible (mean: 6.2 animals per group). In addition, the free-floating sections of vhp were fragile and difficult to cut and mount. The variation being relatively large between the individuals, a higher number of mice would have been required for a reliable analysis and 30
32 conclusions. The effect size of biologically significant effects might be so small that it is not observed in the statistical analysis unless sample size is large. Therefore, larger number of animals would have been required to obtain possible significant results. Both anti-cnpase and BlackGold II are validated markers for the late stage immature and mature OLs and myelin, respectively (Braun et al., 1988; Schmued et al., 2008). There are some limitations regarding the use of anti-cnpase; the manual cell count of OLs using cell morphology as a marker may increase the random variation as it is based on only one person s assessment of whether the dot on the screen is perceived as a cell. Automatic cell counting would have been troublesome to develop due to the morphology, as the anti-cnpase binds to both OLs and myelin. The BNST and vhp images of OLs were analyzed by two people showing a significant positive correlation between the counts (from 0.70 to 0.83), but this data was not used in the study. BlackGold II, on the other hand, binds to the myelin and clearly indicates its presence and, therefore, building a standardized macro to analyze the size of the myelinated area was a suitable option for deducting the bias of manual counting Future perspectives and conclusions The stress response is thought to prepare for potentially threatening situations, not to purposely induce unpleasant emotions. Prolonged stress, however, is hazardous to health as it may induce long-lasting plastic changes in the brain and alter neuronal and molecular function (reviewed in McEwen and Gianaros, 2011). Epigenetic remodeling has been observed specifically in OLs after child abuse (Lutz et al., 2017), which may reflect the transcriptional changes in OLs and their precursor cell-specific genes. The differential expression of these genes has been observed in the mouse brain after chronic stress (Laine et al., 2018; Liu et al., 2017; Lutz et al., 2017). To date, studies have mostly concentrated on observing myelination in all axons within a brain region. However, it is likely that not every OL contributes to myelination at the same level, as not all the axons are involved in the stress and anxiety circuit and activated or repressed during stress. In fact, two recently published studies this year showed for the first time tract-type specific myelination as a consequence of neuronal activity (Mitew et al., 2018; Stedehouder et al., 2018). In addition, to reveal whether certain types of OLs from the heterogeneous population are responding to stress differently, single-cell sequencing could be applied to characterize the cell type and the transcription of myelin-associated genes. 31
33 The vast majority of all the biological outcomes are results from liaison of multiple cellular mechanisms and molecular pathways. Revealing the complex network requires significant investigation, collaboration and expertise in several fields. However, as research methods have been developed during the past decades, we are now able to study the brain on highly detailed levels. Immuno-electron microscopy, for instance, could offer cell-type specific information about myelination: marking the axon-types and measuring the myelin thickness of each of the cell types separately could reveal possible cell type-specific changes in myelination. Combining electrophysiology with optogenetics would allow the manipulation of selected pathways, recording the electrical response and measuring the behavioral outcome. Continuous imaging during the stress period potentially enables us to comprehend more about myelin plasticity during stress. Inducing region-specific hypo- and hypermyelination and measuring the social interaction afterwards would allow us to compare the impact of the CSDS-induced and normally occurring myelin alterations on behavior. In addition, it would be highly interesting to apply other types of stress models (e.g. CVS) to see whether we would obtain different results than those described in this study. That is, whether heterotypic stress induces similar changes or whether this is specific only for psychosocial stress. With the available methods and a broad, functional network to communicate with the scientific community, we can be optimistic about the future of investigating psychiatric disorders and revealing the novel underlying pathways and networks. To conclude the main points of this study, I demonstrated a brain region- and strain-specific effect of chronic stress, impacting selectively the number of OLs in the BNST of B6 resilient mice while other regions remained invariable. The size of the myelinated area did not differ between the groups. The lack of correlation between the number of OLs and the amount of myelin supports the hypothesis of controlled dynamic myelination in the brain. This study offers good foundation for future research by describing the OL-related alterations particularly in the BNST but also by addressing the limitations important to consider before beginning any follow-up studies. As white matter vulnerability is currently acknowledged in stress, concentrating the investigation on the highly detailed level aiming to characterize the genes, activated pathways and the possible neuron subtype-specificity is desirable. Acknowledgements I would first like to thank my supervisor Iiris Hovatta for the great opportunity to carry out my work in her laboratory as well as her irreplaceable support and advice regarding this work. I also thank 32
34 my second supervisor, Mikaela Laine, who was there every time I needed to offer me both intellectual but also emotional help and peer support. I want to thank Zuzanna Misiewicz from the Hovatta lab for giving me advice how to build the macro for the BlackGold II image analysis, which made my work much easier. I thank also Pierre Ameslon for his sustained work in developing and adjusting the CNPase protocol. Many thanks to Paula Collin- Oikkonen from Institute of Biology (University of Finland) for scanning the BlackGold II stained slides. References Adhikari, A. (2014). Distributed circuits underlying anxiety. Front. Behav. Neurosci. 8, Apr. Adhikari, A., Topiwala, M.A., and Gordon, J.A. (2010). Synchronized Activity between the Ventral Hippocampus and the Medial Prefrontal Cortex during Anxiety. Neuron 65, Barres, B.A., and Raff, M.C. (1993). Proliferation of oligodendrocyte precursor cells depends on electrical activity in axons. Nature 361, Bergles, D.E., Roberts, J.D.B., Somogyl, P., and Jahr, C.E. (2000). Glutamatergic synapses on oligodendrocyte precursor cells in the hippocampus. Nature 405, Blanco, C., Rubio, J., Wall, M., Wang, S., Jiu, C.J., and Kendler, K.S. (2014). Risk factors for anxiety disorders: Common and specific effects in a national sample. Depress. Anxiety 31, Bonanno, G.A., Galea, S., Bucciarelli, A., and Vlahov, D. (2006). Psychological resilience after disaster: New York City in the aftermath of the September 11th terrorist attack. Psychol. Sci. 17, Braun, P., Sandillon, F., Edwards, A., Matthieu, J., and Privat, A. (1988). Immunocytochemical localization by electron microscopy of 2'3'-cyclic nucleotide 3'-phosphodiesterase in developing oligodendrocytes of normal and mutant brain. J. Neurosci. 8, Brill, M.H., Waxman, S.G., Moore, J.W., and Joyner, R.W. (1977). Conduction velocity and spike configuration in myelinated fibres: Computed dependence on internode distance. J. Neurol. Neurosurg. Psychiatry 40,
35 Brinkmann, B.G., Agarwal, A., Sereda, M.W., Garratt, A.N., Müller, T., Wende, H., Stassart, R.M., Nawaz, S., Humml, C., Velanac, V., et al. (2008). Neuregulin-1/ErbB Signaling Serves Distinct Functions in Myelination of the Peripheral and Central Nervous System. Neuron 59, Calhoon, G.G., and Tye, K.M. (2015). Resolving the neural circuits of anxiety. Nat. Neurosci. 18, Carlén, M. (2017). What constitutes the prefrontal cortex? Science 358, Chang, K.H., Cha, S.H., Han, M.H., Park, S.H., Nah, D.L., and Hong, J.H. (1992). Marchiafava-Bignami disease: serial changes in corpus callosum on MRI. Neuroradiology 34, Chetty, S., Friedman, A.R., Taravosh-Lahn, K., Kirby, E.D., Mirescu, C., Guo, F., Krupik, D., Nicholas, A., Geraghty, A.C., Krishnamurthy, A., et al. (2014). Stress and glucocorticoids promote oligodendrogenesis in the adult hippocampus. Mol. Psychiatry 19, Choi, M.-H., Na, J.E., Yoon, Y.R., Lee, H.J., Yoon, S., Rhyu, I.J., and Baik, J.-H. (2017). Role of Dopamine D2 Receptor in Stress-Induced Myelin Loss. Sci. Rep. 7, 1. Crawley, J., and Goodwin, F.K. (1980). Preliminary report of a simple animal behavior model for the anxiolytic effects of benzodiazepines. Pharmacology Biochemistry and Behavior 13, Cryan, J.F., and Holmes, A. (2005). The ascent of mouse: advances in modelling human depression and anxiety. Nature Reviews Drug Discovery 4, 775. Davis, M., Walker, D.L., Miles, L., and Grillon, C. (2010). Phasic vs sustained fear in rats and humans: Role of the extended amygdala in fear vs anxiety. Neuropsychopharmacology 35, de Groot, J., and Fortier, C. (1959). Quantitative and histological aspects of adrenal cortical regeneration in the male albino rat. Anat. Rec. 133, Demerens, C., Stankoff, B., Logak, M., Anglade, P., Allinquant, B., Couraud, F., Zalc, B., and Lubetzki, C. (1996). Induction of myelination in the central nervous system by electrical activity. Proceedings of the National Academy of Sciences 93, Duval, E.R., Javanbakht, A., and Liberzon, I. (2015). Neural circuits in anxiety and stress disorders: A focused review. Ther. Clin. Risk Manage. 11,
36 Eadie, B.D., Zhang, W.N., Boehme, F., Gil-Mohapel, J., Kainer, L., Simpson, J.M., and Christie, B.R. (2009). Fmr1 knockout mice show reduced anxiety and alterations in neurogenesis that are specific to the ventral dentate gyrus. Neurobiol. Dis. 36, Etkin, A., and Wager, T.D. (2007). Functional neuroimaging of anxiety: A meta-ana lysis of emotional processing in PTSD, social anxiety disorder, and specific phobia. Am. J. Psychiatry 164, Fancy, S.P.J., Baranzini, S.E., Zhao, C., Yuk, D.-I., Irvine, K.-A., Kaing, S., Sanai, N., Franklin, R.J.M., and Rowitch, D.H. (2009). Dysregulation of the Wnt pathway inhibits timely myelination and remyelination in the mammalian CNS. Genes Dev. 23, Felix-Ortiz, A., Beyeler, A., Seo, C., Leppla, C., Wildes, C.P., and Tye, K. (2013). BLA to vhpc inputs modulate anxiety-related behaviors. Neuron 79, Freeman, S.A., Desmazières, A., Simonnet, J., Gatta, M., Pfeiffer, F., Aigrot, M.S., Rappeneau, Q., Guerreiro, S., Michel, P.P., Yanagawa, Y., et al. (2015). Acceleration of conduction velocity linked to clustering of nodal components precedes myelination. Proc. Natl. Acad. Sci. U. S. A. 112, E321- E328. Funfschilling, U., Supplie, L.M., Mahad, D., Boretius, S., Saab, A.S., Edgar, J., Brinkmann, B.G., Kassmann, C.M., Tzvetanova, I.D., Mobius, W., et al. (2012). Glycolytic oligodendrocytes maintain myelin and long-term axonal integrity. Nature 485, Giampetruzzi, A., Carson, J.H., and Barbarese, E. (2013). FMRP and myelin protein expression in oligodendrocytes. Mol. Cell. Neurosci. 56, Giulian, D., Johnson, B., Krebs, J.F., Tapscott, M.J., and Honda, S. (1991). A growth factor from neuronal cell lines stimulates myelin protein synthesis in mammalian brain. J. Neurosci. 11, Golden, S.A., Covington, H.E., Berton, O., and Russo, S.J. (2011). A standardized protocol for repeated social defeat stress in mice. Nature protocols 6, Hakak, Y., Walker, J.R., Li, C., Wong, W.H., Davis, K.L., Buxbaum, J.D., Haroutunian, V., and Fienberg, A.A. (2001). Genome-wide expression analysis reveals dysregulation of myelination- 35
37 related genes in chronic schizophrenia. Proceedings of the National Academy of Sciences 98, Henry, B., Vale, W., and Markou, A. (2006). The effect of lateral septum corticotropin-releasing factor receptor 2 activation on anxiety is modulated by stress. J. Neurosci. 26, Hovatta, I., Tennant, R.S., Helton, R., Marr, R.A., Singer, O., Redwine, J.M., Ellison, J.A., Schadt, E.E., Verma, I.M., Lockhart, D.J., and Barlow, C. (2005). Glyoxalase 1 and glutathione reductase 1 regulate anxiety in mice. Nature 438, Hübner, C., Bosch, D., Gall, A., Lüthi, A., and Ehrlich, I. (2014). Ex vivo dissection of optogenetically activated mpfc and hippocampal inputs to neurons in the basolateral amygdala: Implications for fear and emotional memory. Front. Behav. Neurosci. 8, 3. Hursh, J.B. (1939). Conduction velocity and diameter of nerve fibers. American Journal of Physiology-Legacy Content 127, Jackowski, A.P., Douglas-Palumberi, H., Jackowski, M., Win, L., Schultz, R.T., Staib, L.W., Krystal, J.H., and Kaufman, J. (2008). Corpus callosum in maltreated children with posttraumatic stress disorder: A diffusion tensor imaging study. Psychiatry Research: Neuroimaging 162, Kalinichev, M., Easterling, K.W., Plotsky, P.M., and Holtzman, S.G. (2002). Long-lasting changes in stress-induced corticosterone response and anxiety-like behaviors as a consequence of neonatal maternal separation in Long Evans rats. Pharmacology Biochemistry and Behavior 73, Kaufman, J., and Charney, D. (2000). Comorbidity of mood and anxiety disorders. Depress. Anxiety 12, Keane, T.M., Goodstadt, L., Danecek, P., White, M.A., Wong, K., Yalcin, B., Heger, A., Agam, A., Slater, G., Goodson, M., et al. (2011). Mouse genomic variation and its effect on phenotypes and gene regulation. Nature 477, 289. Kim, M.J., and Whalen, P.J. (2009). The structural integrity of an amygdala-prefrontal pathway predicts trait anxiety. J. Neurosci. 29, Kim, S.Y., Adhikari, A., Lee, S.Y., Marshel, J.H., Kim, C.K., Mallory, C.S., Lo, M., Pak, S., Mattis, J., Lim, B.K., et al. (2013). Diverging neural pathways assemble a behavioural state from separable features in anxiety. Nature 496,
38 Koudelka, S., Voas, M.G., Almeida, R.G., Baraban, M., Soetaert, J., Meyer, M.P., Talbot, W.S., and Lyons, D.A. (2016). Individual Neuronal Subtypes Exhibit Diversity in CNS Myelination Mediated by Synaptic Vesicle Release. Curr. Biol. 26, Krishnan, V., Han, M., Graham, D.L., Berton, O., Renthal, W., Russo, S.J., LaPlant, Q., Graham, A., Lutter, M., Lagace, D.C., et al. (2007). Molecular Adaptations Underlying Susceptibility and Resistance to Social Defeat in Brain Reward Regions. Cell 131, Laine, M.A., Sokolowska, E., Dudek, M., Callan, S., Hyytiä, P., and Hovatta, I. (2017). Brain activation induced by chronic psychosocial stress in mice. Scientific Reports 7, Laine, M.A., Trontti, K., Misiewicz, Z., Sokolowska, E., Kulesskaya, N., Heikkinen, A., Saarnio, S., Balcells, I., Ameslon, P., Greco, D., et al. (2018). Genetic Control of Myelin Plasticity after Chronic Psychosocial Stress. eneuro. Lang, E.J., and Rosenbluth, J. (2003). Role of myelination in the development of a uniform olivocerebellar conduction time. J. Neurophysiol. 89, Lappe-Siefke, C., Goebbels, S., Gravel, M., Nicksch, E., Lee, J., Braun, P.E., Griffiths, I.R., and Navel, K.-. (2003). Disruption of Cnp1 uncouples oligodendroglial functions in axonal support and myelination. Nat. Genet. 33, LeDoux, J.E., and Pine, D.S. (2016). Using neuroscience to help understand fear and anxiety: A twosystem framework. Am. J. Psychiatry 173, Lehmann, M.L., Weigel, T.K., Elkahloun, A.G., and Herkenham, M. (2017). Chronic social defeat reduces myelination in the mouse medial prefrontal cortex. Scientific Reports 7, Lezak, K.R., Missig, G., and Carlezon, W.A.,Jr. (2017). Behavioral methods to study anxiety in rodents. Dialogues Clin. Neurosci. 19, Lister, R.G. (1987). The use of a plus-maze to measure anxiety in the mouse. Psychopharmacology 92, Liston, C., Watts, R., Tottenham, N., Davidson, M.C., Niogi, S., Ulug, A.M., and Casey, B.J. (2006). Frontostriatal microstructure modulates efficient recruitment of cognitive control. Cereb. Cortex 16,
39 Liu, J., Dietz, K., Deloyht, J.M., Pedre, X., Kelkar, D., Kaur, J., Vialou, V., Lobo, M.K., Dietz, D.M., Nestler, E.J., Dupree, J., and Casaccia, P. (2012). Impaired adult myelination in the prefrontal cortex of socially isolated mice. Nat. Neurosci. 15, Liu, J., Dietz, K., Hodes, G.E., Russo, S.J., and Casaccia, P. (2017). Widespread transcriptional alternations in oligodendrocytes in the adult mouse brain following chronic stress. Dev. Neurobiol. Lutz, P.-., Tanti, A., Gasecka, A., Barnett-Burns, S., Kim, J.J., Zhou, Y., Chen, G.G., Wakid, M., Shaw, M., Almeida, D., et al. (2017). Association of a history of child abuse with impaired myelination in the anterior cingulate cortex: Convergent epigenetic, transcriptional, and morphological evidence. Am. J. Psychiatry 174, Marques, S., Zeisel, A., Codeluppi, S., van Bruggen, D., Mendanha Falcão, A., Xiao, L., Li, H., Häring, M., Hochgerner, H., Romanov, R.A., et al. (2016). Oligodendrocyte heterogeneity in the mouse juvenile and adult central nervous system. Science (New York, N.Y.) 352, McEwen, B.S., and Gianaros, P.J. (2011). Stress- and allostasis-induced brain plasticity. Annu. Rev. Med. 62, McKenzie, I.A., Ohayon, D., Li, H., De Faria, J.P., Emery, B., Tohyama, K., and Richardson, W.D. (2014). Motor skill learning requires active central myelination. Science 346, Mensch, S., Baraban, M., Almeida, R., Czopka, T., Ausborn, J., El Manira, A., and Lyons, D.A. (2015). Synaptic vesicle release regulates myelin sheath number of individual oligodendrocytes in vivo. Nat. Neurosci. 18, Miller, D.J., Duka, T., Stimpson, C.D., Schapiro, S.J., Baze, W.B., McArthur, M.J., Fobbs, A.J., Sousa, A.M.M., Sestan, N., Wildman, D.E., et al. (2012). Prolonged myelination in human neocortical evolution. Proc. Natl. Acad. Sci. U. S. A. 109, Mitew, S., Gobius, I., Fenlon, L.R., McDougall, S.J., Hawkes, D., Xing, Y.L., Bujalka, H., Gundlach, A.L., Richards, L.J., Kilpatrick, T.J., Merson, T.D., and Emery, B. (2018). Pharmacogenetic stimulation of neuronal activity increases myelination in an axon-specific manner. Nat. Commun. 9, 1. Moreno-Peral, P., Conejo-Cerón, S., Motrico, E., Rodríguez-Morejón, A., Fernández, A., García- Campayo, J., Roca, M., Serrano-Blanco, A., Rubio-Valera, M., and Ángel Bellón, J. (2014). Risk 38
40 factors for the onset of panic and generalised anxiety disorders in the general adult population: A systematic review of cohort studies. Journal of Affective Disorders 168, Noll, E., and Miller, R.H. (1993). Oligodendrocyte precursors originate at the ventral ventricular zone dorsal to the ventral midline region in the embryonic rat spinal cord. Development 118, Ono, M., Kikusui, T., Sasaki, N., Ichikawa, M., Mori, Y., and Murakami-Murofushi, K. (2008). Early weaning induces anxiety and precocious myelination in the anterior part of the basolateral amygdala of male Balb/c mice. Neuroscience 156, Pinto, L., and Dan, Y. (2015). Cell-Type-Specific Activity in Prefrontal Cortex during Goal-Directed Behavior. Neuron 87, Risold, P.Y., and Swanson, L.W. (1996). Structural evidence for functional domains in the rat hippocampus. Science 272, Romanski, L.M., Clugnet, M.-C., Bordi, F., and LeDoux, J.E. (1993). Somatosensory and Auditory Convergence in the Lateral Nucleus of the Amygdala. Behav. Neurosci. 107, Ruffini, F., Arbour, N., Blain, M., Olivier, A., and Antel, J.P. (2004). Distinctive Properties of Human Adult Brain-Derived Myelin Progenitor Cells. The American Journal of Pathology 165, Sarnoff, I., and Zimbardo, P.G. (1961). Anxiety, fear, and social isolation. Journal of Abnormal and Social Psychology 62, Schmued, L., Bowyer, J., Cozart, M., Heard, D., Binienda, Z., and Paule, M. (2008). Introducing Black-Gold II, a highly soluble gold phosphate complex with several unique advantages for the histochemical localization of myelin. Brain Research 1229, Scholz, J., Klein, M.C., Behrens, T.E.J., and Johansen-Berg, H. (2009). Training induces changes in white-matter architecture. Nat. Neurosci. 12, Shen, S., Sandoval, J., Swiss, V.A., Li, J., Dupree, J., Franklin, R.J.M., and Casaccia-Bonnefil, P. (2008). Age-dependent epigenetic control of differentiation inhibitors is critical for remyelination efficiency. Nat. Neurosci. 11, Skoff, R.P., Toland, D., and Nast, E. (1980). Pattern of myelination and distribution of neuroglial cells along the developing optic system of the rat and rabbit. J. Comp. Neurol. 191,
41 Smith, R.S., and Koles, Z.J. (1970). Myelinated nerve fibers: computed effect of myelin thickness on conduction velocity. Am. J. Physiol. 219, Snaidero, N., Möbius, W., Czopka, T., Hekking, L.P., Mathisen, C., Verkleij, D., Goebbels, S., Edgar, J., Merkler, D., Lyons, D., Nave, K., and Simons, M. (2014). Myelin Membrane Wrapping of CNS Axons by PI(3,4,5)P3-Dependent Polarized Growth at the Inner Tongue. Cell 156, Stedehouder, J., Brizee, D., Shpak, G., and Kushner, S.A. (2018). Activity-dependent myelination of parvalbumin interneurons mediated by axonal morphological plasticity. J. Neurosci. Stevens, B., Porta, S., Haak, L.L., Gallo, V., and Fields, R.D. (2002). Adenosine: A neuron-glial transmitter promoting myelination in the CNS in response to action potentials. Neuron 36, Stevens, B., Tanner, S., and Douglas Fields, R. (1998). Control of myelination by specific patterns of neural impulses. J. Neurosci. 18, Tiwari, A.D., Wu, C., Zhu, J., Zhang, S., Zhu, J., Wang, W.R., Zhang, J., Tatsuoka, C., Matthews, P.M., Miller, R.H., and Wang, Y. (2016). Design, Synthesis, and Evaluation of Fluorinated Radioligands for Myelin Imaging. J. Med. Chem. 59, Tomassy, G.S., Berger, D.R., Chen, H.-H., Kasthuri, N., Hayworth, K.J., Vercelli, A., Seung, H.S., Lichtman, J.W., and Arlotta, P. (2014). Distinct profiles of myelin distribution along single axons of pyramidal neurons in the neocortex. Science 344, Tsankova, N.M., Berton, O., Renthal, W., Kumar, A., Neve, R.L., and Nestler, E.J. (2006). Sustained hippocampal chromatin regulation in a mouse model of depression and antidepressant action. Nat. Neurosci. 9, Tye, K.M., Prakash, R., Kim, S.-Y., Fenno, L.E., Grosenick, L., Zarabi, H., Thompson, K.R., Gradinaru, V., Ramakrishnan, C., and Deisseroth, K. (2011). Amygdala circuitry mediating reversible and bidirectional control of anxiety. Nature 471, Van Den Bergh, B.R.H., Van Calster, B., Smits, T., Van Huffel, S., and Lagae, L. (2008). Antenatal maternal anxiety is related to HPA-axis dysregulation and self-reported depressive symptoms in adolescence: A prospective study on the fetal origins of depressed mood. Neuropsychopharmacology 33,
42 Vialou, V., Bagot, R.C., Cahill, M.E., Ferguson, D., Robison, A.J., Dietz, D.M., Fallon, B., Mazei- Robison, M., Ku, S.M., Harrigan, E., et al. (2014). Prefrontal cortical circuit for depression- and anxiety-related behaviors mediated by cholecystokinin: Role of ΔFosB. J. Neurosci. 34, Villarreal, G., Hamilton, D.A., Graham, D.P., Driscoll, I., Qualls, C., Petropoulos, H., and Brooks, W.M. (2004). Reduced area of the corpus callosum in posttraumatic stress disorder. Psychiatry Res. Neuroimaging 131, Wake, H., Lee, P.R., and Fields, R.D. (2011). Control of local protein synthesis and initial events in myelination by action potentials. Science 333, Walker, D.L., and Davis, M. (1997). Double Dissociation between the Involvement of the Bed Nucleus of the Stria Terminalis and the Central Nucleus of the Amygdala in Startle Increases Produced by Conditioned versus Unconditioned Fear. J. Neurosci. 17, Waxman, S.G., and Bennett, M.V.I. (1972). Relative conduction velocities of small myelinated and non-myelinated fibres in the central nervous system. Nat. New Biology 238, Williams, T., Hattingh, C.J., Kariuki, C.M., Tromp, S.A., van Balkom, A.J., Ipser, J.C., and Stein, D.J. (2017). Pharmacotherapy for social anxiety disorder (SAnD). Cochrane Database Syst. Rev. 2017, 10. Wittchen, H.U., Jacobi, F., Rehm, J., Gustavsson, A., Svensson, M., Jönsson, B., Olesen, J., Allgulander, C., Alonso, J., Faravelli, C., et al. (2011). The size and burden of mental disorders and other disorders of the brain in Europe European Neuropsychopharmacology 21, Yang, Y., Zhang, Y., Luo, F., and Li, B. (2016). Chronic stress regulates NG2+ cell maturation and myelination in the prefrontal cortex through induction of death receptor 6. Experimental Neurology 277, Ye, P., Li, L., Richards, R.G., DiAugustine, R.P., and D'Ercole, A.J. (2002). Myelination is altered in insulin-like growth factor-i null mutant mice. J. Neurosci. 22, Yoo, S.Y., Jang, J.H., Shin, Y.-W., Kim, D.J., Park, H.-J., Moon, W.-J., Chung, E.C., Lee, J.-M., Kim, I.Y., Kim, S.I., and Kwon, J.S. (2007). White matter abnormalities in drug-naïve patients with obsessivecompulsive disorder: A Diffusion Tensor Study before and after citalopram treatment. Acta Psychiatr. Scand. 116,
43 Zou, K., Huang, X., Li, T., Gong, Q., Li, Z., Ou-yang, L., Deng, W., Chen, Q., Li, C., Ding, Y., and Sun, X. (2008). Alterations of white matter integrity in adults with major depressive disorder: a magnetic resonance imaging study. Journal of Psychiatry & Neuroscience: JPN 33,
44 Appendix 1. ImageJ macro for measuring BlackGold II stained myelinated area # Loop for handling all the images as one batch # dir1 = getdirectory("input directory"); print(dir1); dir2 = dir1 + "/Results/"; File.makeDirectory(dir2); print(dir2); /* dir = getdirectory("output directory"); */ Dialog.create("Please enter the parameters"); Dialog.addString("File suffix: ", ".tif", 5); Dialog.show(); suffix = Dialog.getString(); processfolder(dir1); function processfolder(dir1) { list = getfilelist(dir1); for (i = 0; i < list.length; i++) { if(file.isdirectory(list[i])) processfolder("" + dir1 + list[i]); if(endswith(list[i], suffix)) processfile(dir1, dir2, list[i]); } } function processfile(dir1, dir2, file) { open(dir1 + file); filename = gettitle(); dotindex = indexof(filename,"."); imgname = substring(filename, 0, dotindex); selectwindow(filename); rename(imgname); print(imgname); 43
45 # The commands for the image processing begins here # run("set Scale...", "distance=1.218 known=1 pixel=1 unit=µm global"); setminandmax(55, 230); # The values above adjust bright and contrast for the low background images. The corresponding value for the high background images was (85, 155)# run("apply LUT"); run("colour Deconvolution", "vectors=[user values] show [r1]= [g1]= [b1]= [r2]= [g2]= [b3]= [r3]= [g3]= [b3]= "); selectwindow(imgname +" (Colour[3])"); close(); selectwindow(imgname +" (Colour[2])"); close(); # The vectors for the BlackGold II resembling color that was selected for further processing # selectwindow(imgname +" (Colour[1])"); title = gettitle(); # Save intermediate images as.tif file # saveas("tiff", dir2 + title); setautothreshold("default"); //run("threshold..."); # Background subtract # setthreshold(0, 240); setoption("blackbackground", false); # This turned the image in black and white, containing all stained area # run("convert to Mask"); # To decrease the noise in each image, I discarded all the little, circular particles # run("analyze Particles...", "size=0-infinity circularity=
46 show=masks add"); roimanager("show All with labels"); roimanager("show All"); selectwindow("mask of " + title + ".tif"); title = gettitle(); saveas("tiff", dir2 + title); setautothreshold("default"); //run("threshold..."); setthreshold(100, 255); setoption("blackbackground", false); run("convert to Mask"); # Set the measurements to calculate the BlackGold II stained area. # run("set Measurements...", "area limit display redirect=none decimal=3"); run("measure"); selectwindow("colour Deconvolution"); close(); selectwindow(imgname); close(); selectwindow(title); close(); } Appendix 2. Laine, Trontti, Misiewicz, Sokolowska et al., 2018: Genetic Control of Myelin Plasticity after Chronic Psychosocial Stress (research article) (Next page) 45

47 This Accepted Manuscript has not been copyedited and formatted. The final version may differ from this version. Research Article: New Research Disorders of the Nervous System Genetic Control of Myelin Plasticity after Chronic Psychosocial Stress Mikaela A. Laine 1, Kalevi Trontti 1, Zuzanna Misiewicz 1, Ewa Sokolowska 1, Natalia Kulesskaya 1, Aino Heikkinen 1, Suvi Saarnio 1, Ingrid Balcells 1, Pierre Ameslon 1, Dario Greco 2, Pirkko Mattila 3, Pekka Ellonen 3, Lars Paulin 2, Petri Auvinen 2, Eija Jokitalo 2 and Iiris Hovatta 1 1 Molecular and Integrative Biosciences Research Program, University of Helsinki, Helsinki FI-00014, FinlandP.O.Box 56 2 Institute of Biotechnology, University of Helsinki, Helsinki FI-00014, FinlandP.O.Box 56 3 Finnish Institute of Molecular Medicine, University of Helsinki, Helsinki FI-00014, FinlandP.O.Box 20 DOI: /ENEURO Received: 30 April 2018 Revised: 13 June 2018 Accepted: 25 June 2018 Published: 2 July 2018 Author contributions: M.A.L., K.T., Z.M., E.S., and I.H. designed research; M.A.L., K.T., Z.M., E.S., N.K., A.H., S.S., I.B., P. Ameslon, P.M., P.E., L.P., P. Auvinen, E.J., and I.H. performed research; M.A.L., K.T., Z.M., E.S., N.K., A.H., S.S., and I.H. analyzed data; M.A.L., K.T., Z.M., N.K., and I.H. wrote the paper; D.G. contributed unpublished reagents/analytic tools. Funding: European Research Council (ERC): GenAnx ERA-NET NEURON: AnxBio. Yliopisto (University of Helsinki); Doctoral Program Brain and Mind, University of Helsinki; A*MIDEX: ANR-11-IDEX Institute of Biotechnology, University of Helsinki; Helsinki Institute of life Science; Biocenter Finland; doi.org/ / sigrid Juséliuksen Säätiö (Sigrid Jusélius Stiftelse); The authors declare no competing financial interests. Funded by the European Research Council (Starting Grant GenAnx ) to IH, ERA-NET NEURON (AnxBio to IH), University of Helsinki (to IH), Sigrid Jusélius Foundation (to IH), Doctoral Program Brain and Mind, University of Helsinki (to ML and ZM), and A*MIDEX grant (ANR-11-IDEX ) funded by the French Government Investissements d Avenir program (to PA). The EM-unit is supported by the Institute of Biotechnology (University of Helsinki), Helsinki institute of Life Science and Biocenter Finland (EJ). M.A.L., K.T., Z.M. and E.S. contributed equally to this work. Corresponding author: Dr. Iiris Hovatta, Molecular and Integrative Biosciences Research Program, P.O. box 56, University of Helsinki, Finland. Phone iiris.hovatta@helsinki.fi Cite as: eneuro 2018; /ENEURO Alerts: Sign up at eneuro.org/alerts to receive customized alerts when the fully formatted version of this article is published. Accepted manuscripts are peer-reviewed but have not been through the copyediting, formatting, or proofreading process. Copyright 2018 Laine et al. This is an open-access article distributed under the terms of the Creative Commons Attribution 4.0 International license, which permits unrestricted use, distribution and reproduction in any medium provided that the original work is properly attributed.
48 Genetic control of myelin plasticity after chronic psychosocial stress Mikaela A. Laine* 1, Kalevi Trontti* 1, Zuzanna Misiewicz* 1, Ewa Sokolowska* 1, Natalia Kulesskaya 1, Aino Heikkinen 1, Suvi Saarnio 1, Ingrid Balcells 1, Pierre Ameslon 1, Dario Greco 2, Pirkko Mattila 3, Pekka Ellonen 3, Lars Paulin 2, Petri Auvinen 2, Eija Jokitalo 2, Iiris Hovatta 1 * Equal contribution 1 Molecular and Integrative Biosciences Research Program, University of Helsinki, P.O.Box 56, FI University of Helsinki, Finland 2 Institute of Biotechnology, University of Helsinki, P.O.Box 56, FI University of Helsinki, Finland 3 Finnish Institute of Molecular Medicine, University of Helsinki, P.O.Box 20, FI University of Helsinki, Finland Abbreviated title: Myelination in chronic psychosocial stress Corresponding author: Dr. Iiris Hovatta, Molecular and Integrative Biosciences Research Program, P.O. box 56, University of Helsinki, Finland. Phone iiris.hovatta@helsinki.fi Number of figures: 5 Number of tables: 1 Number of multimedia: 0 Number of words in Abstract: 248 Number of words in Significance Statement: 115 Number of words in Introduction: 637 Number of words in Discussion: 1596 Conflicts of interest: The authors declare no competing financial interests. Acknowledgments: Funded by the European Research Council (Starting Grant GenAnx ) to IH, ERA-NET NEURON (AnxBio to IH), University of Helsinki (to IH), Sigrid Jusélius Foundation (to IH), Doctoral Program Brain and Mind, University of Helsinki (to ML and ZM), and A*MIDEX grant (ANR-11-IDEX ) funded by the French Government Investissements d Avenir program (to PA). The EM-unit is supported by the Institute of Biotechnology (University of Helsinki), Helsinki institute of Life Science and Biocenter Finland (EJ). We thank Saija-Anita Callan, Sanna Kängsepp, and Laura Salminen for help with mouse work; Maria Razzoli for help with setting up the CSDS protocol; Vootele Voikar from the Mouse Behavioral Phenotyping Facility [supported by University of Helsinki (HiLIFE) and Biocenter Finland] for support with behavioral testing; Jenni Lahtinen for RNA-seq library preparation; Juho Väänänen and Birgitta Paranko for help with bioinformatic analyses; Mervi Lindman, Arja Strandell and Helena Vihinen for help with electron microscopy; Päivi Laamanen, Harri Kangas and Matias Rantanen from the Institute of Biotechnology (University of Helsinki) for RNA-seq; the IT Centre for Science (CSC) for computing facilities; Petri Hyytiä, Anders Paetau, Eva Rikandi, Outi Mantere, Tuula Kieseppä, Jaana Suvisaari, Tuukka Raij, and Hovatta lab members for helpful discussions. We also thank the Sequencing Unit at FIMM Technology Centre supported by University of Helsinki and Biocenter Finland. 1
49 Laine, Trontti, Misiewicz, Sokolowska et al. Article Abstract Anxiety disorders often manifest in genetically susceptible individuals after psychosocial stress, but the mechanisms underlying these gene-environment interactions are largely unknown. We used the chronic social defeat stress (CSDS) mouse model to study resilience and susceptibility to chronic psychosocial stress. We identified a strong genetic background effect in CSDS-induced social avoidance using four inbred mouse strains: 69% of C57BL/6NCrl (B6), 23% of BALB/cAnNCrl, 19% of 129S2/SvPasCrl, and 5% of DBA/2NCrl (D2) mice were stress-resilient. Furthermore, different inbred mouse strains responded differently to stress, suggesting they use distinct coping strategies. To identify biological pathways affected by CSDS, we used RNA-seq of three brain regions of two strains, B6 and D2: medial prefrontal cortex (mpfc), ventral hippocampus (vhpc), and bed nucleus of the stria terminalis. We discovered overrepresentation of oligodendrocyte-related genes in the differentially expressed gene population. Because oligodendrocytes myelinate axons, we measured myelin thickness and found significant region and strainspecific differences. For example, in resilient D2 mice mpfc axons had thinner myelin than controls, whereas susceptible B6 mice had thinner myelin than controls in the vhpc. Neither myelin-related gene expression in several other regions, nor corpus callosum thickness, differed between stressed and control animals. Our unbiased gene expression experiment suggests that myelin plasticity is a substantial response to chronic psychosocial stress, varies across brain regions, and is genetically controlled. Identification of genetic regulators of the myelin response will provide mechanistic insight into the molecular basis of stressrelated diseases, such as anxiety disorders, a critical step in developing targeted therapy. Significance Statement Chronic psychosocial stress is a well-established risk factor for anxiety disorders, but the development of targets for therapeutic intervention is limited by ignorance of the underlying molecular and cellular mechanisms. We used inbred genetically defined mice to identify neurobiological pathways that underlie stress-induced social avoidance, a type of anxiety. We found genetically controlled differences in myelinrelated gene expression in stress-exposed mice, with concurrent differences in myelin thickness, suggesting that myelin plasticity is a major stress response of the brain. The adaptive response to stress may increase or decrease myelin thickness, depending on the demands of the specific circuit. Our findings provide a foundation for the identification of specific genetic regulators of chronic stress-induced myelin plasticity. 2
50 Laine, Trontti, Misiewicz, Sokolowska et al. Article Introduction Anxiety disorders, including panic disorder, social anxiety disorder, specific phobias, and generalized anxiety disorder, are the most common mental disorders with a prevalence of 14 % (Wittchen et al., 2011). Human genetic studies of anxiety disorders have confirmed a modest heritability and considerable environmental component (Hettema et al., 2001). However, identification of replicated risk variants is challenging due to genetic heterogeneity, environmental factors that cannot be well-controlled in human settings, and poor availability of large patient cohorts with accurate phenotypes (Hovatta and Barlow, 2008; Smoller, 2016). Consequently, many investigators have resorted to animal models, which allow controlled experiments on both genetic and environmental risk factors, to reveal the biological mechanisms underlying these diseases Chronic psychosocial stress is a well-established risk factor for anxiety disorders (Kemeny and Schedlowski, 2007; Moffitt et al., 2007; Donner et al., 2012). It can be modeled in mice by the chronic social defeat stress (CSDS) paradigm, that has etiological, predictive, and face validity for affective and anxiety disorders [see Hammels et al. (2015)]. It leads to social avoidance and long-term plastic changes in the brain (Avgustinovich et al., 2005; Krishnan et al., 2007). However, only a portion of mice exhibit social avoidance after CSDS, and thus the defeated animals can be divided into stress-susceptible and resilient. Comparison of these groups allows investigation of the mechanistic basis of stress-induced social avoidance and anxietylike behavior and resilience to it. Understanding the underlying risk factors and promotion of the resilience factors in susceptible individuals should facilitate development of secondary prevention methods of anxiety disorders after traumatic events, and selective pharmacological treatment of anxiety (Howlett and Stein, 2016) Most insight into the molecular mechanisms of CSDS comes from the C57BL/6 mouse strain, in which specific genetic, epigenetic, and neurophysiological mechanisms underlie stress susceptibility and resilience [see (Han and Nestler, 2017)]. Because genetic background strongly modulates mouse behavior (Threadgill et al., 1995; Hovatta et al., 2005; Sittig et al., 2016), hypotheses of any mechanisms should be tested across different mouse strains. Such studies are also critical for translating the results to genetically heterogeneous humans. CSDS has different behavioral and physiological consequences in C57BL/6J and BALB/c strains 3
51 Laine, Trontti, Misiewicz, Sokolowska et al. Article (Razzoli et al., 2011a; Razzoli et al., 2011b; Savignac et al., 2011), reflecting underlying genetic, and by extension, gene expression differences between the strains. Therefore, comprehensive unbiased transcriptomic approaches applied to mouse strains with different responses to CSDS should reveal geneenvironment interactions that explain why some individuals are more susceptible to stress-induced maladaptive behaviors than others To examine how genetic background affects the behavioral response to chronic stress, we performed behavioral testing in four inbred mouse strains after CSDS. We selected C57BL/6NCrl (B6) and BALB/cAnNCrl (BALB) strains, which differ in behavioral and metabolic responses to CSDS (Razzoli et al., 2011a; Razzoli et al., 2011b; Savignac et al., 2011), and DBA/2NCrl (D2) and 129S2/SvPasCrl (129) as they are sensitive to stress-induced anxiety- and depression-like behavior in general (Ducottet and Belzung, 2005; Millstein and Holmes, 2007). To identify the major underlying biological pathways, we performed unbiased transcriptomic analysis in the B6 and D2 strains that showed the largest differences in susceptibility to stress. We studied three brain regions, the medial prefrontal cortex (mpfc), ventral hippocampus (vhpc), and bed nucleus of the stria terminalis (BNST), which critically regulate anxiety and the stress response (Garakani et al., 2009; Calhoon and Tye, 2015; Tovote et al., 2015), and are activated by CSDS (Vialou et al., 2014; Laine et al., 2017). In the follow-up gene expression and histological analyses, we found that myelination was significantly altered after stress in a strain and brain region-dependent manner. Our results illustrate that genetic background has a large effect on both the behavioral and brain transcriptomic response to chronic psychosocial stress. Moreover, we demonstrate that the pattern of stress-induced myelination changes is dependent on the genetic background and varies across brain regions Methods Animals We ordered 5-week-old male mice from four inbred strains [DBA/2NCrl (D2), 129S2/SvPasCrl (129), BALB/cAnNCrl (BALB), and C57BL/6NCrl (B6); Charles River Laboratories, Sulzfeld, Germany] for all CSDS experiments and let them acclimatize for 10 days prior to CSDS, housed in groups in a temperature (22 ±2 C) and humidity (50 ±15 %) controlled facility on a 12h light/dark cycle (lights on ). 4
52 Laine, Trontti, Misiewicz, Sokolowska et al. Article From the end of CSDS to the time of dissection, all mice were single-housed. As aggressors for CSDS, we used male Clr-CD1 mice (CD1, Charles River Laboratories), aged weeks. All mice had ad libitum access to food and water throughout the experiment, except for the durations of behavioral tests. Aspen chip bedding (Tapvei Oy, Harjumaa, Estonia) in the cages was changed weekly (except for the duration of the CSDS) and standard environmental enrichment [aspen strips as nesting material (Tapvei Oy), and an aspen brick (Tapvei Oy)] was provided throughout the experiment. Animal procedures were approved by the Regional State Administration Agency for Southern Finland (ESAVI and ESAVI/2766/ /2014) and carried out in accordance to directive 2010/63/EU of the European Parliament and of the Council, and the Finnish Act on the Protection of Animals Used for Science or Educational Purposes (497/2013) Behavioral experiments Chronic social defeat stress (CSDS). We carried out CSDS as previously described (Golden et al., 2011; Laine et al., 2017). Briefly, aggressor CD1 mice were first checked for appropriate aggression levels during a 3-day screening prior to all social defeat experiments. The selected aggressors had to meet the following criteria: attack in at least two consecutive sessions, had latency to attack of less than 90 seconds and do not attack within 1-5 seconds in any of the sessions. For CSDS, each defeated mouse was placed into the cage of an aggressor mouse for max. 10 min. The mouse was then transferred to another compartment of the cage, separated from the aggressor by a perforated plexiglass wall, for 24 h. This procedure was repeated for 10 days, and each day the experimental mouse encountered a novel aggressor. Physical contact time was shortened in the case of severe physical aggression. Control mice were housed in similar cages but with another control mouse as a cage-mate, and without physical contact, switching cage-mates daily. The day after the last defeat session, all mice were separated into single-housed cages, and maintained like this until dissection. The order of testing for all consecutive behavioural tests was randomized Social avoidance (SA) test. Twenty-four hours after the last social defeat session, at the start of the dark phase of the light cycle, we tested both defeated and control mice in the SA test. All animals were brought to the experiment room at least 30 minutes before the start of the test, and animals performing the test were separated from experimenters and the remaining animals by a screen. For the first trial (no-target), the mouse 5
53 Laine, Trontti, Misiewicz, Sokolowska et al. Article was placed in the center of an open arena (42 cm x 42 cm) with an empty perforated plexiglass cylinder located next to one of the walls. The movements of the mouse were tracked using a camera and EthoVision XT10 software (Noldus Information Technology, Wageningen, Netherlands) for 150 s, after which the mouse was placed back into the home cage. The arena was cleaned and the plexiglass cylinder was replaced with another one containing an unfamiliar CD1 social target mouse. The test mouse was then placed back in the middle of the arena and tracked for 150 seconds (target trial). The amount of time the mice spent in the interaction zone (IZ), defined as a semicircle (370 cm 2 ) around the perforated plexiglass cylinder, was measured and a social interaction ratio (SI) calculated by dividing the IZ time of the social target trial with the IZ time of the no-target trial, multiplied by 100. Thus, a low SI ratio indicates high social avoidance To account for strain differences in baseline social behavior, we assessed the response of defeated mice in relation to same-strain controls, following the statistical approach previously implemented by Nasca et al. (2015). We calculated mean SI ratios of control mice from each strain based on several cohorts (n: 129 = 8, BALB = 40, B6 = 126, D2 = 114). We used log-transformation to normalize the distribution, removed outliers (> 3 IQRs from the median), and divided the defeated mice to stress-resilient (resembling controls) and susceptible (showing social avoidance) based on SI ratios, with the border determined as the controls mean score minus 1 SD. SI ratio border values for each strain were: 129 = 62.68, BALB = 81.76, B6 = 76.49, D2 = Body weight was recorded at the beginning of CSDS (day 1) and on every second day throughout the CSDS (days 2, 4, 6, 8 and 10). The amount of body weight gain was calculated as the difference between the first and the last measurement Open field test (OF). We assessed spontaneous locomotor activity and anxiety-like behavior with an automatic MedAssociates system (St. Albans, VT, USA) at the start of the light phase of the light cycle. Individual mouse cages were brought to the experimental room in two groups. After 30 min adaptation to the experimental room (lit at 100 lx), the mouse was released to the corner of the experimental chamber (27 cm x 27 cm x 20 cm, transparent walls and white floor virtually divided into a 19 x 19 squares grid) and allowed to explore freely for 5 min. 6
54 Laine, Trontti, Misiewicz, Sokolowska et al. Article Elevated zero maze (EZM) was performed at the start of the light phase of the light cycle. All animals were brought to the experiment room at least 30 min before the test, and animals performing the test were separated from experimenters and the remaining animals by a screen. The apparatus consisted of plastic annular runway (diameter = 50 cm, width = 5 cm) elevated 40 cm above the floor. The runway was divided into 4 sectors: 2 open sectors opposing each other and 2 opposing closed sectors protected by inner and outer non-transparent walls (height = 15 cm). After 30 min adaptation to the experimental room (dimly lit at lx), the mouse was placed in the middle of one of the closed sectors and allowed to explore the maze freely for 5 min. The mouse was video-tracked with EthoVision XT Forced swim test (FST). All animals were brought to the experiment room at least 30 min before the test, and animals performing the test were separated from experimenters and the remaining animals by a screen. After adaptation to the experimental room (150 lx), the mouse was placed in a glass cylinder (diameter = 18 cm, height = 25 cm) filled with water (room temperature) to the height of 15 cm. The immobility time (passive floating) was detected with EthoVision XT10 system for 6 min with 2 min time bins. Data from the last 4 min was used Gene expression profiling Dissections. We dissected the mpfc (B6: Con n = 6, Res n = 6, Sus n = 6; D2: Con n = 6, Sus n = 8), BNST (B6: Con n = 5, Res n = 5, Sus n = 5; D2: Con n = 5, Res n = 3, Sus n = 5), and vhpc (B6: Con n = 6, Res n = 8, Sus n = 3; D2: Con n = 6, Sus n = 5) 6-8 days after the last CSDS (mice aged 8 weeks, see Fig. 2A; Fig. 2-1). Mice were killed by cervical dislocation between 8 am and 11 am to avoid circadian differences in gene expression, and the order was counterbalanced across groups (resilient, susceptible, and control mice). Dissections were performed on a sterile chilled petri dish within 7 min, and tissue was flash-frozen in liquid N RNA-sequencing (RNA-seq). Total RNA was extracted with TriReagent (Molecular Research Center Inc., OH, USA) and RNA quality was assessed with a 2100 Bioanalyzer (Agilent Technologies, CA, USA) using Agilent RNA 600 Nano Chip Kit (Agilent Technologies). rrna was depleted with Ribo-Zero Gold rrna Removal Kit (Illumina Inc, CA, USA; mpfc and vhpc) or custom Insert Dependent Adaptor Cleavage 7
55 Laine, Trontti, Misiewicz, Sokolowska et al. Article (InDA-C) primers (BNST). RNA was fragmented using the S2 ultrasonicator (Covaris Inc., MA, USA) and sequencing libraries were prepared with Nextera (Illumina; vhpc), ScriptSeq v2 (Epicentre, WI, USA; mpfc), or Ovation Universal RNA-Seq System (NuGEN, Leek, Netherlands; BNST) RNA-seq library preparation kits. Libraries were size-selected with Pippin Prep (Sage Science, MA, USA) and sequencing was conducted on HighSeq 2000 (vhpc, paired-end 91 bp, Illumina) or NextSeq 500 platforms (mpfc and BNST, single-end 96 bp; Illumina) The RNA-seq reads were trimmed for adapters with Cutadapt v1.8.3 (vhpc) and FastX toolkit (mpfc, BNST) and PCR duplicates were removed with PRINSEQ v Reads were aligned using STARv 2.5.0c (Dobin et al., 2013) with default settings to mouse genome GRCm38, and annotated to gene exons with HTSeq v0.6.1 (Anders et al., 2015) using GTF release 86 (update ) Differential expression (DE) analysis was conducted using limma ebayes (Ritchie et al., 2015; Phipson et al., 2016) comparing resilient and susceptible mice to same-strain controls within brain regions. RNA-seq data was filtered to remove low-abundance genes, keeping genes with at least 1 count per million (CPM) in at least six samples (Anders et al., 2015). Subsequently, the data was normalized with voom (Law et al., 2014), and adjusted for sequencing (vhpc) and library preparation batches (vhpc, mpfc, and BNST) with ComBat (Johnson et al., 2007). To identify top differential expressed (DE) genes, we calculated - log10(p)*logfc for each gene and ranked them accordingly (Xiao et al., 2014). 226 Gene expression data is available in Gene Expression Omnibus (GEO; GSE109315) Rank-Rank Hypergeometric Overlap (RRHO) test (Plaisier et al., 2010). RRHO infers pair-wise similarity between two DE result lists, where genes are ranked by differential expression (-log10(p)*logfc) between resilient and control, or between susceptible and control mice, by calculating significance of overlapping genes at different rank bins (Plaisier et al., 2010). We used step size of 100 genes to bin the genes and applied the same -log(p) scale to comparisons within brain regions. Significant overlap of genes in rank groups containing up- and downregulated genes in both lists (lower left corner and upper right corner of square matrix, respectively; see Fig. 2C-D) shows a shared transcriptome-wide gene expression pattern in response to CSDS. 8
56 Laine, Trontti, Misiewicz, Sokolowska et al. Article Gene Set Enrichment Analysis (GSEA). We carried out GSEA using the GSEA Preranked module implemented in GSEA Desktop v3.0 (Mootha et al., 2003; Subramanian et al., 2005) and the curated gene sets (C2) of the Molecular Signature Database (MSigDB) v6.0 ( The preranked GSEA was performed with 1000 permutations. The top five gene sets with the highest positive and negative normalized enrichment scores (NES) (p FDR < 0.05) within each comparison were selected for further analysis. From the selected top up- and downregulated gene sets, all present in at least two comparisons and two brain regions were visualized using Circos software (Krzywinski et al., 2009). The overlap between the top enriched gene sets, presented on the Circos plot, was further investigated with the hypergeometric test implemented in the MSigDB v Gene Ontology (GO) term enrichment. We analyzed GO term enrichment separately for top 300 up- and 300 downregulated differentially expressed genes from each comparison with topgo (Alexa et al., 2006), using the weight01 model to account for GO term dependencies. In RNA-seq, long transcripts yield more read counts and are more easily passed through low-abundance filtering than short genes with the same expression level, and genes with high number of counts have greater statistical power being detected as DE than genes with low number of counts. To minimize these selection biases (Young et al., 2010), we matched the background genes, i.e. the gene universe used to compare the top DE genes with, with the top DE genes using R package genefilter (Gentleman et al., 2017), resulting in 6882 (+/- 290 SEM) background genes Visualizing OPC and OLG marker genes. We manually curated a list of OPC and OLG-specific marker genes, based on prior publications (Zhang et al., 2014; Marques et al., 2016). Figures were constructed based on previously published scripts (Haarman et al., 2014) q-rt-pcr was applied to validate five myelin-related genes from RNA-seq. We used published primers to amplify Mobp and Plp1 (Liu et al., 2012) and designed primer pairs (5-3 forward, reverse) using NCBI primer designing tool ( for Opalin (ACTGCCATCGAATACGACATC, CCTCTACGGGCTCATCATCG), Ermn (AACCAGGCAGGAGACAACTG, GATGGCCTGGTGAACAACGA), and Mbp (ACACACGAGAACTACCCATTATGG, AGAAATGGACTACTGGGTTTTCATCT). RNA samples of 9
57 Laine, Trontti, Misiewicz, Sokolowska et al. Article mpfc and BNST were the same as used in RNA-seq, and for vhpc samples overlapped by 37.5 % (12/32 samples). 250 ng of DNase I (Thermo Scientific, MA, USA)-treated total RNA was converted to cdna with iscript select cdna synthesis kit (Bio-Rad Laboratories, Munich, Germany) and amplified with 250 nm of primers in CFX384 Real-Time PCR cycler using IQ SYBR Green supermix (Bio-Rad Laboratories). Expression levels were normalized to Ppib (GGAGATGGCACAGGAGGAAA, CCCGTAGTGCTTCAGCTTGAA). Each reaction was run in triplicate and relative expression level was calculated using a standard curve (7.15, 10.0, 5.0, 2.0, 1.0, 0.5 and 0.25 ng of cdna) present on each assay plate with CFX Manager (Bio-Rad Laboratories). Statistical analysis (Pearson s r) was carried out with GraphPad Prism v7.02 (GraphPad Software Inc., CA, USA) Immunohistochemistry Mice were anaesthetized 6-8 days after CSDS with a lethal dose of pentobarbital (Mebunat Vet 60 mg/ml, Orion Pharma, Espoo, Finland) and transcardially perfused with 4 % paraformaldehyde (PFA) in phosphate buffered saline (PBS). After post-fixation in 4 % PFA overnight (+4 C), the brains were cut into 20 μm coronal sections using a Leica VT-1200S vibratome (Leica Biosystems, Nussloch, Germany) and stored at - 20 C free-floating in cryoprotectant. Sections were washed 3 x in PBS and mounted on Superfrost Ultra Plus (ThermoFisher Scientific, MA, USA) slides. We performed antigen retrieval by submerging the slides in 0.01 M citrate buffer, heated to a boil for 20 min. Slides were blocked in 2.5 % BSA in 0.5 % PBST % normal goat serum, followed by primary antibody incubation with mouse anti-cnpase (1:250, Merck Life Science, Darmstadt, Germany, #MAB326R) overnight at +4 C. Slides were washed in PBS before goat antimouse AlexaFluor 488 secondary antibody incubation (1:400, ThermoFisher Scientific, #A-11029) for 2 h at RT. After washing in PBS we coverslipped the slides with Vectashield + DAPI mounting medium (Vector Laboratories, CA, USA, #H-1200). We acquired images with ZEISS Apotome.2 system (Zeiss, Oberkochen, Germany) and analyzed them with ImageJ software (National Institutes of Health, MD, USA). We measured corpus callosum thickness on both sides of the midline from each section (2-6 sections per animal, distance from Bregma between 0.22 and -0.10) using ImageJ, and calculated their mean. 10
58 Laine, Trontti, Misiewicz, Sokolowska et al. Article Transmission electron microscopy (TEM) Mice were anaesthetized 6-8 days after CSDS with a lethal dose of pentobarbital (Mebunat Vet). We transcardially perfused the mice with PBS followed by fixation with 100 ml 2 % glutaraldehyde (GA) / 2 % PFA in 0.1 M sodium cacodylate (NaCac) buffer (glutaraldehyde, paraformaldehyde, and NaCac: Sigma Aldrich, MO, USA), heated to +37 C. The brains were postfixed in the same fixative for 2-4 h and immersed in 0.1 M NaCac buffer for 2-24 h, both at +4 C. We cut them into 200 μm sagittal slices with a Leica VT-1200S vibratome (Leica Biosystems) in 0.1 M phosphate buffer. Regions of the mpfc, BNST and vhpc were cut manually by using anatomical landmarks (see Fig. 5-1) We postfixed the sections in osmium tetroxide [1 %, +1.5 % K4[Fe(CN)6] in 0.1 M NaCac] for 2 h at +4 C, stained en-bloc with uranyl acetate for 1 h at +4 C, dehydrated with EtOH and acetone, and embedded them into hard Epon nm sections were cut with an ultramicrotome and placed on copper grids for microscopy and stained with lead citrate. We imaged the ultrathin sections using a Jem-1400 transmission electron microscope (Jeol, Tokyo, Japan) and randomly selected and imaged myelinated axons at x5000 magnification We measured myelin thickness, axon diameter and g ratio using ImageJ. We calculated the diameter by measuring the area of the whole fiber and the area of the axon (inside the compacted myelin sheath). The diameters of geometric circles with the same areas were calculated for both parameters. We calculated the g ratio by dividing the diameter of the axon with the diameter of the whole fiber. Myelin thickness was measured at three fully compacted positions and their average calculated Statistical analysis Statistical analyses were conducted with SPSS Statistics 24 (IBM) or GraphPad Prism 7.02 (GraphPad Software Inc.). Planned post hoc comparisons (control vs. resilient, control vs. susceptible and resilient vs. susceptible) were conducted by Fisher s LSD. For these tests we report nominal p-values, evaluated for significance against an α-level adjusted for multiple corrections with test-wise Bonferroni correction (see Table 1). Only p-values which survive this correction are shown. 11
59 Laine, Trontti, Misiewicz, Sokolowska et al. Article Group differences in TEM data were assessed using generalized estimating equations (GEE) to control for within-subject dependencies of individual axons measured from the same animal (ranges for each region: mpfc = , BNST = 31-69, and vhpc = axons per animal). We selected this approach due to the low number of animals per group, which could not be reliably analyzed by ANOVA. GEE has been proposed as a suitable approach for analyzing data with non-independent features (Hanley et al., 2003), such as axons measured from the same individual. Pairwise contrasts were computed for comparing groups with Fisher s LSD and significance determined against the Bonferroni corrected α-level as above Data analysis of RNA-seq data was performed as described above. Multiple testing correction was done by the Benjamini-Hochberg method (Benjamini and Hochberg, 1995) Results Genetic background influences behavioral response to CSDS To determine whether genetic background affects the behavioral response to psychosocial stress, we carried out 10-day CSDS in mice from four inbred strains, D2, 129, BALB and B6 (Fig. 1A). Twenty-four hours after the last defeat session we carried out the social avoidance (SA) test to assess their social avoidance phenotype. To account for the strain differences in baseline social behavior during SA test, we evaluated the response of defeated mice in relation to same-strain controls. We divided the defeated mice into stresssusceptible and resilient groups, considering mice with SI ratios within one standard deviation, or above, of the same-strain control mean as resilient (i.e. resembling the control mice), and those with the SI ratio below one standard deviation from the mean as susceptible. We observed a significant difference in the distribution of susceptible and resilient mice between the strains (χ 2 = , p = 1.102*10-13 ), with the B6 defeated mice being mostly resilient and the 129, BALB, and D2 mice mostly susceptible to stress (Fig. 1B). During the social target trial of the SA test, susceptible mice from all strains spent significantly less time in the interaction zone (Fig. 1C) and more time in the corners of the arena (Fig. 1D) than during the no-target trial We next determined how CSDS influences other behaviors. To assess locomotor behavior, we measured the distance moved during the no-target trial of the SA test (Fig. 1E) and the OF test (Fig. 1F). B6 and D2 12
60 Laine, Trontti, Misiewicz, Sokolowska et al. Article defeated mice moved significantly less than control mice during both tests. We did not observe differences in distance travelled between defeated and control 129 or BALB mice. For the B6 strain we also performed the EZM and FST to assess anxiety-like and despair behavior, respectively. Susceptible mice showed increased anxiety-like, but not despair behavior, compared to controls (Fig. 1G-H). To study metabolic effects of CSDS, we measured body weight before and after CSDS (Fig. 1I). All B6 mice gained weight (mixed ANOVA post hoc comparison before vs. after CSDS: controls p = 9.98*10-28, resilient p = 2.21*10-26 and susceptible p = 6.23*10-20 ). BALB and 129 controls gained weight (p = 4.90*10-5 and p = 0.012, respectively), while the weight of the defeated mice of these strains did not change during CSDS. Both D2 resilient and susceptible mice lost weight (p = and p = 2.53*10-6, respectively) Oligodendrocyte-related genes are differentially expressed in response to stress To establish which biological pathways were affected by chronic stress, we carried out RNA-seq one week after CSDS in mpfc, vhpc, and BNST (Fig. 2A). We selected the B6 and D2 strains for this analysis as they represented the phenotypic extremes in the proportions of susceptible and resilient mice. We were not able to analyze gene expression levels of resilient D2 mice for mpfc and vhpc due to low number of animals in this group. We always compared the stress-susceptible or resilient mice to the same-strain controls. We first determined the overlap of the top 300 up- and downregulated genes between the strains in each brain region (Fig. 2B, Fig. 2-2), followed up by the RRHO analysis, which shows the overall similarity and direction of differential expression of all genes (Fig. 2C-D, Fig. 2-3A-B). In the mpfc, only 26 (2.2 %) of the top differentially expressed genes between the susceptible vs. control mice were shared between the B6 and D2 strains, and the RRHO analysis confirmed the highly divergent stress response of the two strains. In the BNST, the transcriptomic response of the two strains was marginally more similar as resilient B6 and D2 mice shared 67 (5.9 %), and susceptible B6 and D2 mice shared 101 (9.2 %) of the top genes. We detected the greatest overlap of the gene expression response between the strains in the vhpc, where B6 and D2 susceptible mice shared 390 (48.1 %) of the top genes. Unlike in the mpfc or BNST, the stress effect was stronger than the strain effect in the vhpc. However, in the vhpc, several genes were downregulated both in the B6 susceptible and resilient mice. 13
61 Laine, Trontti, Misiewicz, Sokolowska et al. Article To ask which biological pathways were affected by CSDS, we carried out Gene set enrichment and Gene Ontology term enrichment analyses. GSEA showed significant enrichment of several gene sets (Fig. 2-4), of which ageing and oligodendrocyte (OLG)-related sets were enriched in nearly all comparisons in all brain regions and both strains (Fig. 2E, Fig. 2-3C). Although functionally diverse, the genes included in the agingrelated gene sets were significantly overrepresented in the Lein OLG Markers gene set (p FDR = 1.2*10-16 ). In accordance with GSEA, the most enriched GO terms were related to myelination and OLG development, in particular among the downregulated genes of B6 susceptible mice in the mpfc (Fig. 2-5). These combined results from both enrichment analyses prompted us to further investigate OLG-related genes Mature OLGs develop from OLG progenitor cells (OPCs) which persist even in the adult brain as committed precursors. We asked whether either OPC or OLG cell populations dominantly contributed to the observed differential expression. The transcriptomic signature associated with CSDS was stronger in the mature OLG markers (Fig. 2G) than in the OPC markers (Fig. 2F). To validate the RNA-seq findings, we analyzed Opalin, Ermn, Mobp, Plp1, and Mbp gene expression levels with q-rt-pcr in mpfc, BNST, and vhpc, and found high correlation with RNA-seq and q-rt-pcr measurements of these myelination-related genes (mean r = 0.82; Fig. 3) Myelin-related variation after stress is not observed globally in the brain To test whether differences in myelin-related gene expression were observed across the brain, we measured expression levels of Opalin, Ermn, Mobp, Plp1 and Mbp in the whole cortex (lacking the mpfc), hypothalamus and dorsal hippocampus (dhpc) by q-rt-pcr. Using mixed ANOVA we determined that there was no significant main effect by the group (control, resilient or susceptible) on myelin-related gene expression in any of the brain regions of either strain. While Opalin expression was lower in D2 susceptible mice compared to controls in the hypothalamus as determined by post hoc comparison (p = 0.006), the expression levels of the other genes did not differ between the stressed and control mice in any region (Fig. 4A-F). We also measured the thickness of the corpus callosum in brain sections stained with a myelinbinding antibody (anti-cnpase) (Fig. 4G). We observed no differences in stress-susceptible or resilient mice compared to controls (Fig. 4H-I). 14
62 Laine, Trontti, Misiewicz, Sokolowska et al. Article Myelin thickness and g ratio differ in brain region and genetic background-dependent manner To determine if CSDS affects myelination, we carried out transmission electron microscopy (TEM) of myelinated axons in mpfc, BNST, and vhpc. In addition to analyzing axons of different diameters within each brain region and stress group together (Fig. 5-2), we divided the axons to three size groups given that different types of neuronal projections may differ in axon diameter (Fig. 5, Fig. 5-3). We discovered several brain region- and strain-specific differences between stress groups in g ratio, i.e. the ratio of the inner axonal diameter to the total outer diameter, myelin thickness, and axon diameter. Overall, D2 resilient mice had higher g ratio and thinner myelin in the mpfc compared to susceptible mice. B6 susceptible mice had thinner myelin in the vhpc compared to controls and thicker myelin in the BNST compared to resilient mice (Fig. 5-2). In addition to these general findings, we found significant differences between stress susceptible or resilient mice compared to controls in axons of certain diameter (Fig. 5). We also observed modestly but significantly smaller axon diameter (without the myelin sheath) in the mpfc of D2 susceptible mice (Fig. 5-2) Discussion We established that the behavioral and brain transcriptomic responses to chronic psychosocial stress are genetically controlled. We discovered that BALB, 129, and D2 mice were more susceptible to chronic stress than B6 mice. We demonstrated, by unbiased RNA-seq, that differential expression of myelination-related genes was among the most significantly affected biological pathways by CSDS in the mpfc, vhpc, and BNST. Consistently, we observed significant brain region and strain-dependent differences in myelin thickness after stress. Neither myelin gene expression in other cortical regions or the dhpc, nor corpus callosum thickness, differed between stressed and control mice, suggesting no overall white matter changes due to CSDS We first established the CSDS paradigm in four inbred mouse strains and demonstrated that genetic factors control their adaptive behavior to stress. Consistently with prior findings (Razzoli et al., 2011a; Savignac et al., 2011), BALB mice were more sensitive to CSDS-induced social avoidance than B6 mice. Additionally, 15
63 Laine, Trontti, Misiewicz, Sokolowska et al. Article innately anxious D2 and 129 mice were also highly susceptible to CSDS, suggesting that anxious strains may in general be stress-sensitive. CSDS did not affect locomotor activity of 129 or BALB mice, but both resilient and susceptible mice failed to gain weight during the defeat period. By contrast, the defeated D2 mice had lower locomotor activity than controls, and they lost weight during defeat. Differently to the other strains, the defeated B6 mice had lower locomotor activity compared to controls but they gained weight during defeat, similarly to controls. We also investigated other behaviors in this strain, and found that the stress-susceptible mice had increased anxiety-like behavior, but no difference in despair behavior, as in previous studies (Krishnan et al., 2007; Razzoli et al., 2011a). We acknowledge that due to limitations of our animal facility, all mice were brought into the experimental room together before behavioral testing, where they stayed behind a screen during the testing of other animals, possibly introducing confounding factors. Overall, our results suggest that the studied strains use different coping strategies to stress, and that such behavior has a strong genetic basis In addition to different behavioral responses to CSDS, we observed large differences in the brain transcriptomic response to stress between B6 and D2 strains. mpfc and BNST expression patterns were more similar within strains, between the resilient and susceptible mice, than between susceptible or resilient mice of different strains. However, in vhpc, the transcriptomic response of B6 and D2 susceptible mice was highly similar. This result may reflect the different organization and roles of these three brain regions in processing stress-related signals. It may be that the vhpc relays primary information regarding stress, while the BNST and mpfc may have more interpreting and processing roles, and therefore little genetic variation is tolerated within the hippocampal stress response. vhpc gene expression is influenced by glucocorticoids through glucocorticoid receptors, which are strongly expressed in the hippocampus (Ahima and Harlan, 1990; Ahima et al., 1991; Gray et al., 2017). BNST receives projections from several amygdalar nuclei and mediates anxiety-related information to hypothalamic and brain stem targets (Davis et al., 2010). The mpfc influences stress-associated social behavior by evaluation of perceived threats, top-down control of goaldirected behavior (Carlen, 2017), and emotion regulation (Etkin et al., 2015). These differences reflected on the transcriptomic response to stress may contribute to the distinct coping strategies of the strains. 16
64 Laine, Trontti, Misiewicz, Sokolowska et al. Article We found significant enrichment of oligodendrocyte- and aging-related genes within the differentially expressed genes in both strains and all brain regions. The highly significant overlap between both of these gene sets suggests similar changes in oligodendrocyte-related gene expression may be associated with both aging and chronic psychosocial stress. This oligodendrocyte-related signal was derived mostly from genes expressed in mature OLGs, which are the myelin-producing cells in the central nervous system. Myelin plasticity, a response of OLGs to neuronal activity (Gautier et al., 2015; Koudelka et al., 2016; Purger et al., 2016; Mitew et al., 2018), is retained in adulthood (Bengtsson et al., 2005; McKenzie et al., 2014). Downregulation of OLG-related genes was especially pronounced in the vhpc, and also in the mpfc of B6 susceptible mice. On the structural level, vhpc myelin sheaths of B6 susceptible mice were thinner than in control mice, concurring with the downregulation of myelin-related genes. Interestingly, in the BNST, B6 susceptible mice had thicker myelin sheaths and smaller g ratio compared to both resilient and control mice, also concurring with the gene expression patterns. D2 susceptible mice had an opposite gene expression pattern in the BNST, which, however, was not supported by changes in myelin sheath thickness or g ratio. Opposite gene expression changes in different inbred mouse strains in response to stress have previously been observed in other models, but the underlying mechanisms are not fully understood (Mozhui et al., 2010; Malki et al., 2015). In mice, various stressors have diverse effects on myelination, likely reflecting involvement of distinct neural processes, developmental stage at the time of stress exposure, and duration of stress. Early life stress affects myelin-related gene expression in the mpfc (Bordner et al., 2011; Makinodan et al., 2012), and myelination of the amygdala (Ono et al., 2008). In adult mice, social isolation (Liu et al., 2012) and 14-day CSDS in susceptible mice (Lehmann et al., 2017) reduce myelin-related gene expression and myelination within the frontal cortex. Intermittent social defeat stress leads to reduced MBP-stained myelin area in the mpfc (Zhang et al., 2016). Corpus callosum myelination is decreased after chronic restraint stress (Choi et al., 2017). Also chronic variable stress induces temporally variable myelin-related gene expression changes, and these changes were regionally selective in the mpfc, nucleus accumbens, and corpus callosum (Liu et al., 2018). Therefore, it is likely that alterations in gene expression and physical parameters of the myelin sheaths occur dynamically over days and weeks (Montesinos et al., 2015; Almeida and Lyons, 2017), possibly explaining thicker myelin in B6 resilient mice in the mpfc, without differences in myelin-related gene expression compared to controls. Overall, our results concur with earlier studies and 17
65 Laine, Trontti, Misiewicz, Sokolowska et al. Article suggest that stress does not simply cause widespread downregulation of myelin-related genes or myelin loss, but that stress-influenced myelin-plasticity involves specific stress-associated brain circuits Our strategy to divide the stressed animals to susceptible and resilient groups allowed identification of specific patterns of myelination-related differences between these groups. We observed that chronic stress associates with thicker myelin in the susceptible (in the BNST of B6 mice) and thinner myelin in resilient mice (D2 mpfc). No prior studies exist, to our knowledge, on resilience-related myelin thinning. Although DTI measures are only considered proxies for myelination, in humans, baseline fractional anisotropy has been demonstrated to correlate positively with state anxiety, but following exposure to a traumatic event, correlation is negative (Sekiguchi et al., 2014). Furthermore, increased fractional anisotropy, suggestive of enhanced integrity, has been reported in the cingulate gray matter of panic disorder patients (Han et al., 2008). Also, the number of mature OLGs in the ventromedial PFC of depressed subjects with childhood abuse is increased (Tanti et al., 2017). Our results suggest that these complex patterns are strongly modulated by genetic factors Although myelination studies on human anxiety disorders and chronic stress are scarce, major depression has been consistently associated with white matter disruptions (Wang et al., 2014). Depressed suicide completers with childhood abuse have impaired myelin-related gene expression and reduced myelin thickness in the anterior cingulate cortex (Lutz et al., 2017). Interestingly, this effect was only seen in small caliber axons, similarly to our finding of mpfc myelin thickness being larger in B6 resilient mice compared to controls. Axons of different diameter may represent specific types of neurons (Perge et al., 2012) and therefore be differentially vulnerable to the effects of stress. For example, in the macaque cortex, axons which project longer distance from the point of origin have larger diameters than those projecting to proximal targets (Innocenti et al., 2014). Based on the axon diameters measured by TEM, it is not possible to infer the type of neurons affected in our experiment but this question could be addressed with immuno-electron microscopy How may structural changes in myelin affect behavior? Myelin thickness is a key component in determining axonal conduction speed, thereby influencing circuit function. Myelin deficient rats have altered conduction time and lower average synchrony levels in the cerebellum (Lang and Rosenbluth, 2003). Mice have 18
66 Laine, Trontti, Misiewicz, Sokolowska et al. Article increased synchronous activity between the vhpc and mpfc in an anxiogenic environment (Adhikari et al., 2010). Furthermore, in primates, increased power and phase synchrony in the theta range has been detected in the amygdala-prefrontal circuit during aversive conditioning (Taub et al., 2018). Altered synchrony has also been recorded in human psychiatric disorders (Schulman et al., 2011; Leuchter et al., 2015). Genetic factors affect synchronous oscillations during sleep in the inbred mouse strains (Franken et al., 1998; Tafti et al., 2003). The role of brain oscillations in myelination and psychiatric phenotypes are still poorly understood, but myelin plasticity may be a mechanism that allows regulation of axonal conduction and spatial connectivity Overall, our unbiased brain gene expression analysis suggests that myelin plasticity is among the most significant responses to chronic psychosocial stress. Our strategy to divide the mice into stress-susceptible and resilient groups allowed us to demonstrate significant differences in myelination-related gene expression and myelin thickness between these groups. Furthermore, variable myelin plasticity across brain regions suggests that chronic stress has localized effects on myelination. Importantly, by using two different inbred mouse strains we demonstrated that stress-induced myelin plasticity is genetically controlled. Identification of the genetic regulators of the myelin response will provide mechanistic insight into the molecular basis of stress-induced anxiety, a critical step in developing targeted therapy for anxiety disorders References Adhikari A, Topiwala MA, Gordon JA (2010) Synchronized activity between the ventral hippocampus and the medial prefrontal cortex during anxiety. Neuron 65: Ahima RS, Harlan RE (1990) Charting of type II glucocorticoid receptor-like immunoreactivity in the rat central nervous system. Neuroscience 39: Ahima RS, Krozowski Z, Harlan R (1991) Type I corticosteroid receptor-like immunoreactivity in the rat CNS: distribution and regulation by corticosteroids. J Comp Neurol 313: Alexa A, Rahnenfuhrer J, Lengauer T (2006) Improved scoring of functional groups from gene expression data by decorrelating GO graph structure. Bioinformatics 22:
67 Laine, Trontti, Misiewicz, Sokolowska et al. Article Almeida RG, Lyons DA (2017) On Myelinated Axon Plasticity and Neuronal Circuit Formation and Function. J Neurosci 37: Anders S, Pyl PT, Huber W (2015) HTSeq--a Python framework to work with high-throughput sequencing data. Bioinformatics 31: Avgustinovich DF, Kovalenko IL, Kudryavtseva NN (2005) A model of anxious depression: persistence of behavioral pathology. Neurosci Behav Physiol 35: Bengtsson SL, Nagy Z, Skare S, Forsman L, Forssberg H, Ullen F (2005) Extensive piano practicing has regionally specific effects on white matter development. Nat Neurosci 8: Benjamini Y, Hochberg Y (1995) Controlling the False Discovery Rate: A Practical and Powerful Approach to Multiple Testing. J R Stat Soc Series B Stat Methodol 57: Bordner KA, George ED, Carlyle BC, Duque A, Kitchen RR, Lam TT, Colangelo CM, Stone KL, Abbott TB, Mane SM, Nairn AC, Simen AA (2011) Functional genomic and proteomic analysis reveals disruption of myelin-related genes and translation in a mouse model of early life neglect. Front Psychiatry 2:18. Calhoon GG, Tye KM (2015) Resolving the neural circuits of anxiety. Nat Neurosci 18: Carlen M (2017) What constitutes the prefrontal cortex? Science 358: Choi MH, Na JE, Yoon YR, Lee HJ, Yoon S, Rhyu IJ, Baik JH (2017) Role of Dopamine D2 Receptor in Stress-Induced Myelin Loss. Sci Rep 7: Davis M, Walker DL, Miles L, Grillon C (2010) Phasic vs sustained fear in rats and humans: role of the extended amygdala in fear vs anxiety. Neuropsychopharmacology 35: Dobin A, Davis CA, Schlesinger F, Drenkow J, Zaleski C, Jha S, Batut P, Chaisson M, Gingeras TR (2013) STAR: ultrafast universal RNA-seq aligner. Bioinformatics 29: Donner J, Sipila T, Ripatti S, Kananen L, Chen X, Kendler KS, Lonnqvist J, Pirkola S, Hettema JM, Hovatta I (2012) Support for involvement of glutamate decarboxylase 1 and neuropeptide Y in anxiety susceptibility. Am J Med Genet B Neuropsychiatr Genet 159B: Ducottet C, Belzung C (2005) Correlations between behaviours in the elevated plus-maze and sensitivity to unpredictable subchronic mild stress: evidence from inbred strains of mice. Behav Brain Res 156:
68 Laine, Trontti, Misiewicz, Sokolowska et al. Article Etkin A, Buchel C, Gross JJ (2015) The neural bases of emotion regulation. Nat Rev Neurosci 16: Franken P, Malafosse A, Tafti M (1998) Genetic variation in EEG activity during sleep in inbred mice. Am J Physiol 275:R Franklin KBJ, Paxinos G (2008) The Mouse Brain in Stereotaxic Coordinates, 3rd Edition. USA:New York, NY: Academic Press. Garakani A, Murrough JW, Charney JD, Bremner JD (2009) The Neurobiology of Anxiety Disorders. In: Neurobiology of Mental Illness, 4th Edition (Charney DS, Sklar P, Buxbaum J, Nestler EJ, eds), pp Oxford; New York: Oxford University Press. Gautier HO, Evans KA, Volbracht K, James R, Sitnikov S, Lundgaard I, James F, Lao-Peregrin C, Reynolds R, Franklin RJ, Karadottir RT (2015) Neuronal activity regulates remyelination via glutamate signalling to oligodendrocyte progenitors. Nat Commun 6:8518. Gentleman R, Carey V, Huber W, Hahne F (2017) Genefilter: methods for filtering genes from highthroughput experiments. R package version In. Golden SA, Covington HE, 3rd, Berton O, Russo SJ (2011) A standardized protocol for repeated social defeat stress in mice. Nat Protoc 6: Gray JD, Kogan JF, Marrocco J, McEwen BS (2017) Genomic and epigenomic mechanisms of glucocorticoids in the brain. Nat Rev Endocrinol 13: Haarman BC, Riemersma-Van der Lek RF, Burger H, Netkova M, Drexhage RC, Bootsman F, Mesman E, Hillegers MH, Spijker AT, Hoencamp E, Drexhage HA, Nolen WA (2014) Relationship between clinical features and inflammation-related monocyte gene expression in bipolar disorder - towards a better understanding of psychoimmunological interactions. Bipolar Disord 16: Hammels C, Pishva E, De Vry J, van den Hove DL, Prickaerts J, van Winkel R, Selten JP, Lesch KP, Daskalakis NP, Steinbusch HW, van Os J, Kenis G, Rutten BP (2015) Defeat stress in rodents: From behavior to molecules. Neurosci Biobehav Rev 59: Han DH, Renshaw PF, Dager SR, Chung A, Hwang J, Daniels MA, Lee YS, Lyoo IK (2008) Altered cingulate white matter connectivity in panic disorder patients. J Psychiatr Res 42: Han MH, Nestler EJ (2017) Neural Substrates of Depression and Resilience. Neurotherapeutics 14:
69 Laine, Trontti, Misiewicz, Sokolowska et al. Article Hanley JA, Negassa A, Edwardes MD, Forrester JE (2003) Statistical analysis of correlated data using generalized estimating equations: an orientation. Am J Epidemiol 157: Hettema JM, Neale MC, Kendler KS (2001) A review and meta-analysis of the genetic epidemiology of anxiety disorders. Am J Psychiatry 158: Hovatta I, Barlow C (2008) Molecular genetics of anxiety in mice and men. Ann Med 40: Hovatta I, Tennant RS, Helton R, Marr RA, Singer O, Redwine JM, Ellison JA, Schadt EE, Verma IM, Lockhart DJ, Barlow C (2005) Glyoxalase 1 and glutathione reductase 1 regulate anxiety in mice. Nature 438: Howlett JR, Stein MB (2016) Prevention of Trauma and Stressor-Related Disorders: A Review. Neuropsychopharmacology 41: Innocenti GM, Vercelli A, Caminiti R (2014) The diameter of cortical axons depends both on the area of origin and target. Cereb Cortex 24: Johnson WE, Li C, Rabinovic A (2007) Adjusting batch effects in microarray expression data using empirical Bayes methods. Biostatistics 8: Kemeny ME, Schedlowski M (2007) Understanding the interaction between psychosocial stress and immune-related diseases: a stepwise progression. Brain Behav Immun 21: Koudelka S, Voas MG, Almeida RG, Baraban M, Soetaert J, Meyer MP, Talbot WS, Lyons DA (2016) Individual Neuronal Subtypes Exhibit Diversity in CNS Myelination Mediated by Synaptic Vesicle Release. Curr Biol 26: Krishnan V et al. (2007) Molecular adaptations underlying susceptibility and resistance to social defeat in brain reward regions. Cell 131: Krzywinski M, Schein J, Birol I, Connors J, Gascoyne R, Horsman D, Jones SJ, Marra MA (2009) Circos: an information aesthetic for comparative genomics. Genome Res 19: Laine MA, Sokolowska E, Dudek M, Callan SA, Hyytia P, Hovatta I (2017) Brain activation induced by chronic psychosocial stress in mice. Sci Rep 7: Lang EJ, Rosenbluth J (2003) Role of myelination in the development of a uniform olivocerebellar conduction time. J Neurophysiol 89:
70 Laine, Trontti, Misiewicz, Sokolowska et al. Article Law CW, Chen Y, Shi W, Smyth GK (2014) voom: Precision weights unlock linear model analysis tools for RNA-seq read counts. Genome Biol 15:R29. Lehmann ML, Weigel TK, Elkahloun AG, Herkenham M (2017) Chronic social defeat reduces myelination in the mouse medial prefrontal cortex. Sci Rep 7: Leuchter AF, Hunter AM, Krantz DE, Cook IA (2015) Rhythms and blues: modulation of oscillatory synchrony and the mechanism of action of antidepressant treatments. Ann N Y Acad Sci 1344: Liu J, Dietz K, Hodes GE, Russo SJ, Casaccia P (2018) Widespread transcriptional alternations in oligodendrocytes in the adult mouse brain following chronic stress. Dev Neurobiol 78: Liu J, Dietz K, DeLoyht JM, Pedre X, Kelkar D, Kaur J, Vialou V, Lobo MK, Dietz DM, Nestler EJ, Dupree J, Casaccia P (2012) Impaired adult myelination in the prefrontal cortex of socially isolated mice. Nat Neurosci 15: Lutz PE et al. (2017) Association of a History of Child Abuse With Impaired Myelination in the Anterior Cingulate Cortex: Convergent Epigenetic, Transcriptional, and Morphological Evidence. Am J Psychiatry 174: Makinodan M, Rosen KM, Ito S, Corfas G (2012) A critical period for social experience-dependent oligodendrocyte maturation and myelination. Science 337: Malki K, Mineur YS, Tosto MG, Campbell J, Karia P, Jumabhoy I, Sluyter F, Crusio WE, Schalkwyk LC (2015) Pervasive and opposing effects of Unpredictable Chronic Mild Stress (UCMS) on hippocampal gene expression in BALB/cJ and C57BL/6J mouse strains. BMC Genomics 16:262. Marques S et al. (2016) Oligodendrocyte heterogeneity in the mouse juvenile and adult central nervous system. Science 352: McKenzie IA, Ohayon D, Li H, de Faria JP, Emery B, Tohyama K, Richardson WD (2014) Motor skill learning requires active central myelination. Science 346: Millstein RA, Holmes A (2007) Effects of repeated maternal separation on anxiety- and depression-related phenotypes in different mouse strains. Neurosci Biobehav Rev 31:
71 Laine, Trontti, Misiewicz, Sokolowska et al. Article Mitew S, Gobius I, Fenlon LR, McDougall SJ, Hawkes D, Xing YL, Bujalka H, Gundlach AL, Richards LJ, Kilpatrick TJ, Merson TD, Emery B (2018) Pharmacogenetic stimulation of neuronal activity increases myelination in an axon-specific manner. Nat Commun 9:306. Moffitt TE, Caspi A, Harrington H, Milne BJ, Melchior M, Goldberg D, Poulton R (2007) Generalized anxiety disorder and depression: childhood risk factors in a birth cohort followed to age 32. Psychol Med 37: Montesinos J, Pascual M, Pla A, Maldonado C, Rodriguez-Arias M, Minarro J, Guerri C (2015) TLR4 elimination prevents synaptic and myelin alterations and long-term cognitive dysfunctions in adolescent mice with intermittent ethanol treatment. Brain Behav Immun 45: Mootha VK et al. (2003) PGC-1alpha-responsive genes involved in oxidative phosphorylation are coordinately downregulated in human diabetes. Nat Genet 34: Mozhui K, Karlsson RM, Kash TL, Ihne J, Norcross M, Patel S, Farrell MR, Hill EE, Graybeal C, Martin KP, Camp M, Fitzgerald PJ, Ciobanu DC, Sprengel R, Mishina M, Wellman CL, Winder DG, Williams RW, Holmes A (2010) Strain differences in stress responsivity are associated with divergent amygdala gene expression and glutamate-mediated neuronal excitability. J Neurosci 30: Nasca C, Bigio B, Zelli D, Nicoletti F, McEwen BS (2015) Mind the gap: glucocorticoids modulate hippocampal glutamate tone underlying individual differences in stress susceptibility. Mol Psychiatry 20: Ono M, Kikusui T, Sasaki N, Ichikawa M, Mori Y, Murakami-Murofushi K (2008) Early weaning induces anxiety and precocious myelination in the anterior part of the basolateral amygdala of male Balb/c mice. Neuroscience 156: Perge JA, Niven JE, Mugnaini E, Balasubramanian V, Sterling P (2012) Why do axons differ in caliber? J Neurosci 32: Phipson B, Lee S, Majewski IJ, Alexander WS, Smyth GK (2016) Robust Hyperparameter Estimation Protects against Hypervariable Genes and Improves Power to Detect Differential Expression. Ann Appl Stat 10:
72 Laine, Trontti, Misiewicz, Sokolowska et al. Article Plaisier SB, Taschereau R, Wong JA, Graeber TG (2010) Rank-rank hypergeometric overlap: identification of statistically significant overlap between gene-expression signatures. Nucleic Acids Res 38:e169. Purger D, Gibson EM, Monje M (2016) Myelin plasticity in the central nervous system. Neuropharmacology 110: Razzoli M, Carboni L, Andreoli M, Ballottari A, Arban R (2011a) Different susceptibility to social defeat stress of BalbC and C57BL6/J mice. Behav Brain Res 216: Razzoli M, Carboni L, Andreoli M, Michielin F, Ballottari A, Arban R (2011b) Strain-specific outcomes of repeated social defeat and chronic fluoxetine treatment in the mouse. Pharmacol Biochem Behav 97: Ritchie ME, Phipson B, Wu D, Hu Y, Law CW, Shi W, Smyth GK (2015) limma powers differential expression analyses for RNA-sequencing and microarray studies. Nucleic Acids Res 43:e47. Savignac HM, Finger BC, Pizzo RC, O'Leary OF, Dinan TG, Cryan JF (2011) Increased sensitivity to the effects of chronic social defeat stress in an innately anxious mouse strain. Neuroscience 192: Schulman JJ, Cancro R, Lowe S, Lu F, Walton KD, Llinas RR (2011) Imaging of thalamocortical dysrhythmia in neuropsychiatry. Front Hum Neurosci 5:69. Sekiguchi A, Sugiura M, Taki Y, Kotozaki Y, Nouchi R, Takeuchi H, Araki T, Hanawa S, Nakagawa S, Miyauchi CM, Sakuma A, Kawashima R (2014) White matter microstructural changes as vulnerability factors and acquired signs of post-earthquake distress. PLoS One 9:e Sittig LJ, Carbonetto P, Engel KA, Krauss KS, Barrios-Camacho CM, Palmer AA (2016) Genetic Background Limits Generalizability of Genotype-Phenotype Relationships. Neuron 91: Smoller JW (2016) The Genetics of Stress-Related Disorders: PTSD, Depression, and Anxiety Disorders. Neuropsychopharmacology 41: Subramanian A, Tamayo P, Mootha VK, Mukherjee S, Ebert BL, Gillette MA, Paulovich A, Pomeroy SL, Golub TR, Lander ES, Mesirov JP (2005) Gene set enrichment analysis: a knowledge-based approach for interpreting genome-wide expression profiles. Proc Natl Acad Sci U S A 102:
73 Laine, Trontti, Misiewicz, Sokolowska et al. Article Tafti M, Petit B, Chollet D, Neidhart E, de Bilbao F, Kiss JZ, Wood PA, Franken P (2003) Deficiency in short-chain fatty acid beta-oxidation affects theta oscillations during sleep. Nat Genet 34: Tanti A, Kim JJ, Wakid M, Davoli MA, Turecki G, Mechawar N (2017) Child abuse associates with an imbalance of oligodendrocyte-lineage cells in ventromedial prefrontal white matter. Mol Psychiatry. Advance online publication, 21 November DOI: /mp Taub AH, Perets R, Kahana E, Paz R (2018) Oscillations Synchronize Amygdala-to-Prefrontal Primate Circuits during Aversive Learning. Neuron 97: e293. Threadgill DW, Dlugosz AA, Hansen LA, Tennenbaum T, Lichti U, Yee D, LaMantia C, Mourton T, Herrup K, Harris RC, et al. (1995) Targeted disruption of mouse EGF receptor: effect of genetic background on mutant phenotype. Science 269: Tovote P, Fadok JP, Luthi A (2015) Neuronal circuits for fear and anxiety. Nat Rev Neurosci 16: Wang L, Leonards CO, Sterzer P, Ebinger M (2014) White matter lesions and depression: a systematic review and meta-analysis. J Psychiatr Res 56: Vialou V, Bagot RC, Cahill ME, Ferguson D, Robison AJ, Dietz DM, Fallon B, Mazei-Robison M, Ku SM, Harrigan E, Winstanley CA, Joshi T, Feng J, Berton O, Nestler EJ (2014) Prefrontal cortical circuit for depression- and anxiety-related behaviors mediated by cholecystokinin: role of DeltaFosB. J Neurosci 34: Wittchen HU, Jacobi F, Rehm J, Gustavsson A, Svensson M, Jonsson B, Olesen J, Allgulander C, Alonso J, Faravelli C, Fratiglioni L, Jennum P, Lieb R, Maercker A, van Os J, Preisig M, Salvador-Carulla L, Simon R, Steinhausen HC (2011) The size and burden of mental disorders and other disorders of the brain in Europe Eur Neuropsychopharmacol 21: Xiao Y, Hsiao TH, Suresh U, Chen HI, Wu X, Wolf SE, Chen Y (2014) A novel significance score for gene selection and ranking. Bioinformatics 30: Young MD, Wakefield MJ, Smyth GK, Oshlack A (2010) Gene ontology analysis for RNA-seq: accounting for selection bias. Genome Biol 11:R14. Zhang H, Yan G, Xu H, Fang Z, Zhang J, Zhang J, Wu R, Kong J, Huang Q (2016) The recovery trajectory of adolescent social defeat stress-induced behavioral, (1)H-MRS metabolites and myelin changes in Balb/c mice. Sci Rep 6:
74 Laine, Trontti, Misiewicz, Sokolowska et al. Article Zhang Y, Chen K, Sloan SA, Bennett ML, Scholze AR, O'Keeffe S, Phatnani HP, Guarnieri P, Caneda C, Ruderisch N, Deng S, Liddelow SA, Zhang C, Daneman R, Maniatis T, Barres BA, Wu JQ (2014) An RNA-sequencing transcriptome and splicing database of glia, neurons, and vascular cells of the cerebral cortex. J Neurosci 34: Table legend Table 1. Statistical table. Outline of statistical tests and significance levels applied for each experiment. Figure Data structure Statistical test Statistical significance (α) 1B Categorical data Χ C Normal distribution Mixed ANOVA D Normal distribution Mixed ANOVA E Normal distribution One-way ANOVA F Normal distribution One-way ANOVA (129, BALB and B6 strains), independent t-test (D2 strain) 1G Normal distribution One-way ANOVA H Normal distribution One-way ANOVA I Normal distribution One-way ANOVA (group comparisons), mixed ANOVA (within-group comparison of weight before and after CSDS) 27
75 Laine, Trontti, Misiewicz, Sokolowska et al. Article 4A-F Normal distribution Mixed ANOVA (B6) 0.01 (D2) 4H-I Normal distribution One-way ANOVA A-L Normal distribution Generalized estimating equations Figure legends Figure 1. Strong genetic background effect on the behavioral response to CSDS. (A) Timeline of experiments. Each perpendicular line represents one day. (B) Social interaction ratios of the four strains in the SA test. Pie charts represent the proportion of resilient and susceptible mice in each mouse strain. 129, BALB, and D2 strains were highly susceptible to CSDS while B6 strain was the most resilient to CSDS. (C) Time spent in the interaction zone (IZ) and (D) the corner zones of the SA test during sessions with no social target (N) and a CD1 mouse as a social target (T). Susceptible mice of all strains spent less time in the IZ when the target was present compared to when it was not. (E) Distance travelled during the no-target trial of the SA test. In the B6 strain both susceptible and resilient mice had lower locomotor activity, while in the D2 strain only susceptible mice moved significantly less than controls. n (B-E, I) = 129: Con = 7, Res = 3, Sus = 13; C: Con = 34, Res = 10, Sus = 33; B6: Con = 72, Res = 70, Sus = 32; D2: Con = 39, Res = 2, Sus = 40. (F) Distance travelled during the 5 min open field test (OF). B6 resilient and D2 susceptible mice travelled significantly shorter distances than their same-strain control mice. n = 129: Con = 7, Res = 3, Sus = 13; C: Con = 18, Res = 6, Sus = 19; B6: Con = 20, Res = 19, Sus = 4; D2: Con = 19, Res = 1 (not analyzed), Sus = 22. (G) Time B6 mice spent in the open area of the elevated zero maze (EZM). Susceptible mice spent significantly less time in the open zones compared to controls. n: Con = 20, Res = 29, Sus = 11. (H) Immobility time of B6 mice during minutes 2-6 of the forced swim test (FST) did not differ between groups. n = Con = 28, Res = 32, Sus = 21. (I) Difference in body weight before and after CSDS. B6 defeated mice gained weight during CSDS similarly to their same-strain controls, BALB susceptible mice gained 28
76 Laine, Trontti, Misiewicz, Sokolowska et al. Article significantly less weight than controls, and both resilient and susceptible D2 mice lost weight. All figures depict mean ±1 SEM. * = p < 0.05, ** = p < 0.01, *** = p < 0.001, see Figure 1-1 for exact p-values. CSDS: chronic social defeat stress; SA: social avoidance test; D2: DBA/2NCrl strain; BALB: Balb/cAnNCrl; 129: 129S2/SvPasCrl; B6: C57BL/6NCrl; Con: control; Res: resilient; Sus: susceptible; mpfc: medial prefrontal cortex; BNST: bed nucleus of the stria terminalis; vhpc: ventral hippocampus Figure 2. RNA-sequencing implicates oligodendrocyte-related gene expression changes after CSDS. (A) Regions dissected for RNA-seq from D2 and B6 mice, see Figure 2-1 for sample and RNA-seq details. (B) Overlap of 300 top downregulated and 300 top upregulated genes between phenotypes vs. control, separately for each brain region (see Fig. 2-2 for top 300 differentially expressed genes and Fig. 2-3A-B for overlap separately for upregulated and downregulated genes). (C) Key to rank-rank hypergeometric overlap (RRHO) showing a hypothetical heatmap of two identical data sets ( FC sample 1 vs. control and FC sample 2 vs. control ). Following differential gene expression analysis, genes were ranked by their fold change (FC) and assigned to bins of 100 genes. Overlap of genes was then compared between each ranking matched bin of sample 1 vs. control and sample 2 vs. control. Heatmap color represents the significance of the overlap [-log10(p)] of genes between bins. Thus significant p-values in the bottom-left corner indicate that the two data sets have shared upregulated genes, significant p-values in the top-right corner indicate shared downregulated genes, and significant p-values in the middle indicate genes not differentially expressed or with small fold change. Significant p-values in the top-left or bottom-right corner represent genes regulated in opposite directions between the two data sets. (D) RRHO shows significant similarity in the gene expression response to CSDS between resilient and susceptible mice within strains (B6 mpfc and vhpc, D2 BNST) and between susceptible mice of B6 and D2 strains (vhpc). Scale bar = log(p) of rank classes (n = 100), for each brain region separately. (E) Circos plot showing the top five enriched gene sets overlapping between the brain regions in stress-resilient and susceptible mice compared to controls. Only normalized enrichment scores (NES) achieving significance (p FDR < 0.05) are shown. A positive (or negative) NES for a given gene set indicates its overrepresentation at the top (or bottom, respectively) of the ranked list of upregulated (or downregulated, respectively) genes. See Figures 2-4 and 2-5 for GSEA and GO analyses, respectively. See Figure 2-3C for expression fold change for genes in the Lein OLG Markers gene 29
77 Laine, Trontti, Misiewicz, Sokolowska et al. Article set. (F-G) Merged heat map showing the expression fold change (logfc) and significance (p) of OPC- (F) and OLG-specific (G) genes. B6: C57BL/6NCrl strain; D2: DBA/2NCrl strain; Res: resilient; Sus: susceptible; mpfc: medial prefrontal cortex; BNST: bed nucleus of the stria terminalis; vhpc: ventral hippocampus; Lu Aging Brain Up: LU_AGING_BRAIN_UP; Lein OLG Markers: LEIN_OLIGODENDROCYTE_MARKERS; Aging Up: DEMAGALHAES_AGING_UP; KEGG Ribosome: KEGG_RIBOSOME; Cancer: GINESTIER_BREAST_CANCER_ZNF217_AMPLIFIED_DN; GSEA: Gene Set Enrichment Analysis; GO: Gene Ontology Figure 3. Strong correlation of gene expression levels of selected myelin-related genes determined by RNA-seq and q-rt-pcr. Box plots show the gene expression levels of five myelin-related genes (Ermn, Opalin, Mbp, Mobp, and Plp1) measured by RNA-seq (voom normalized number of reads, left y-axis, solid fill) and q-rt-pcr (right y-axis, striped fill). Pearson correlation coefficient (r) was calculated across the five (mpfc, vhpc) or six (BNST) group means. Box plots show distribution of values from min to max. mpfc = medial prefrontal cortex, vhpc = ventral hippocampus, BNST = bed nucleus of the stria terminalis, B6 = C57BL/6NCrl, D2 = DBA/2NCrl, Con = control, Res = resilient, Sus = susceptible Figure 4. No generalized effects on oligodendrocyte-related gene expression or corpus callosum thickness after CSDS. (A-F) Bar graphs showing the normalized expression levels of myelin-related genes in the hypothalamus and two brain regions not critically influenced by CSDS [cortex (without mpfc) and dhpc]. B6 and D2 mice were analyzed 6-8 days following CSDS. Myelin-related gene expression did not differ between phenotype groups in any of the brain regions of either strain. Only Opalin was expressed at a lower level in the hypothalamus of D2 susceptible mice compared to controls as shown by post hoc analysis. Mean ±1 SEM is shown. (G-H) CSDS does not affect corpus callosum thickness in B6 or D2 mice. Myelin visualized by anti-cnpase staining. Atlas outline modified from Franklin & Paxinos (2008). n = B6: Con = 6, Res = 5, Sus = 4; D2: Con = 6, Res = 3, Sus = 8. Error bars = min - max. D2: DBA/2NCrl strain; B6: C57BL/6NCrl strain; Con: control; Res: resilient; Sus: susceptible; dhpc: dorsal hippocampus Figure 5. Chronic social defeat stress influences g ratio, myelin thickness, and axon diameter as measured by transmission electron microscopy. (A-F) Scatter plots of g ratio with mean indexed by a 30
78 Laine, Trontti, Misiewicz, Sokolowska et al. Article horizontal line. G ratio was lower in medium sized BNST axons of B6 susceptible mice compared to both control and resilient mice, and higher in all axon size categories in the mpfc of D2 resilient mice compared to susceptible mice. (G-L) Bar graphs of mean myelin thickness. Concurrently to g ratio measurements, B6 susceptible mice had thicker myelin on medium sized axons in the BNST compared to resilient or control mice, and D2 resilient mice had thinner myelin on medium and large axons in the mpfc compared to susceptible mice. Additionally, myelin was thicker in the small axons of the mpfc in B6 resilient mice compared to controls, and thinner in the small and large axons of the vhpc in B6 susceptible mice compared to controls. n = B6: Con = 3, Res = 4, Sus = 3; D2: Con = 6, Res = 3, Sus = 5. Error bars ± 1 SEM. See Figure 5-1 for schematics of dissected regions, Figure 5-2 for analyses without division of axons into size categories, and Figure 5-3 for size category division criteria. All nominal p-values surviving Bonferroni correction are shown. D2: DBA/2NCrl; B6: C57BL/6NCrl; mpfc: medial prefrontal cortex; BNST: bed nucleus of the stria terminalis; vhpc: ventral hippocampus; TEM: transmission electron microscopy; Con: control; Res: resilient; Sus: susceptible Extended data legends Figure 1-1. Exact p-values for all behavioral tests. The test used for each parameter depicted in Figure 1C- I are outlined along with results of post hoc contrasts. D2: DBA/2NCrl strain; BALB: Balb/cAnNCrl; 129: 129S2/SvPasCrl; B6: C57BL/6NCrl Figure 2-1. Social interaction ratios (SI), division of mice to phenotypic groups, library preparation and sequencing batches, and the number of analyzed RNA-seq reads. mpfc = medial prefrontal cortex, vhpc = ventral hippocampus, BNST = bed nucleus of the stria terminalis, B6 = C57BL/6NCrl, D2 = DBA/2NCrl Figure 2-2. Top 300 up and top 300 down-regulated genes as ranked by -log10(p)* logfc for each comparison shown in Figure 2B. mpfc = medial prefrontal cortex, vhpc = ventral hippocampus, BNST = bed nucleus of stria terminalis, B6 = C57BL/6NCrl, D2 = DBA/2NCrl, res = resilient, sus = susceptible, con = control. 31
79 Laine, Trontti, Misiewicz, Sokolowska et al. Article Figure 2-3. Overlap of the top differentially expressed and oligodendrocyte-related genes after chronic social defeat stress. (A-B) Overlap of the top 300 down-regulated (A) and top 300 up-regulated (B) genes between resilient vs. control and susceptible vs. control mice, separately for each brain region. See Figure 2B. (C). Merged heat map showing the expression fold change (FC) of resilient vs. control and susceptible vs. control groups. Genes belonging to the LEIN_OLIGODENDROCYTE_MARKERS gene set in the Gene Set Enrichment Analysis (see Fig 2E) are shown. FCs are shown only for genes with nominal p < Genes which did not pass the cut-off are marked in grey (NA). mpfc = medial prefrontal cortex, vhpc = ventral hippocampus, BNST = bed nucleus of the stria terminalis, B6 = C57BL/6NCrl, D2 = DBA/2NCrl, Con = control, Res = resilient, Sus = susceptible Figure 2-4. Pathway analysis results from Gene Set Enrichment Analysis (GSEA) for Figure 2E. Only p FDR < 0.05 are shown in the table. p FDR: a false discovery rate corrected p-value; p FWER: familywise-error rate. mpfc = medial prefrontal cortex, vhpc = ventral hippocampus, BNST = bed nucleus of the stria terminalis, B6 = C57BL/6NCrl, D2 = DBA/2NCrl, Res = resilient, Sus = susceptible, Con = control Figure 2-5. Significantly (p < 0.05) enriched Gene Ontology (GO) terms within the top 300 up and top 300 down-regulated genes for each comparison, converging with results from GSEA (Fig. 2E). mpfc = medial prefrontal cortex, vhpc = ventral hippocampus, BNST = bed nucleus of the stria terminalis, B6 = C57BL/6NCrl, D2 = DBA/2NCrl. res = resilient, sus = susceptible, con = control. BP = biological process, CC = cellular component, MF = molecular function, GSEA = Gene Set Enrichment Analysis, GO = Gene Ontology Figure 5-1. Regions dissected for transmission electron microscopy. Purple shaded squares outline the dissected samples from 200 μm sections. Atlas outlines are based on (Franklin and Paxinos, 2008) and the distance from the midline (sagittal) in millimeters is shown below each image Figure 5-2. Effect of chronic social defeat stress on g ratio (A) and myelin thickness (B) when comparing all axons without division into axon size categories (see Fig 5. for results with division into small, medium and large axon size categories), and on axon diameter (C). (D) Representative transmission 32
80 Laine, Trontti, Misiewicz, Sokolowska et al. Article electron microscopy images for each group, scale bar = 0.5 μm. Error bars ± 1 SEM. All nominal p-values surviving Bonferroni correction against α = are shown Figure 5-3. Details of axons assessed by transmission electron microscopy (depicted in Fig. 5). Calculation of axon diameter category boundaries (small, medium, large) in each brain region, and the number of animals and axons per category and group. mpfc = medial prefrontal cortex, vhpc = ventral hippocampus, BNST = bed nucleus of the stria terminalis, B6 = C57BL/6NCrl, D2 = DBA/2NCrl, Res = resilient, Sus = susceptible, Con = control. 33
81 A Mice arrive B social interaction ratio (S I, %) Day % 10 min 19% CSDS 24 h SA IZ Optional behavioral tests (OF, EZM, FST) DISSECT 129 BALB B6 D2 23% 31% 77% 69% 5% 95% Con Res Sus time in IZ (s) C NT NT NT NT NT NT NT NT NT NT NT NT time in open zone of EZM (s) 129 BALB B6 D2 G *** *** distance travelled in SA test without target (cm) E * 0 *** Con Res Sus *** *** *** *** 129 BALB B6 D2 immobility time during minutes 2-6 of FST (s) *** *** ** H *** *** time in corners (s) Con Res Sus D distance travelled during OF (cm) NT NT NT NT NT NT NT NT NT NT NT NT F body weight during CSDS (g) I ** *** *** 129 BALB B6 D2 0 ** *** 129 BALB B6 D2 * *** * 129 BALB B6 D2 ***

82
83 Relative expression level Relative expression level Relative expression level Relative expression level Relative expression level Relative expression level Relative expression level Relative expression level Relative expression level Relative expression level Relative expression level Relative expression level Relative expression level Relative expression level Relative expression level Normalized CPM Normalized CPM Normalized CPM Normalized CPM 10 0 mpfc Ermn Con Res Sus Con Sus B6 D2 Opalin Con Res Sus Con Sus B6 D2 Mbp Con Res Sus Con Sus B6 D2 Mobp Con Res Sus Con Sus B6 D2 r= r= r= r= Normalized CPM Normalized CPM Normalized CPM Normalized CPM 12 BNST Ermn Con Res Sus Con Res Sus B6 D2 Opalin Con Res Sus Con Res Sus B6 D2 Mbp Con Res Sus Con Res Sus B6 D2 Mobp Con Res Sus Con Res Sus B6 D2 r= r= r= r= Normalized CPM Normalized CPM Normalized CPM Normalized CPM 10 0 vhpc Ermn Con Res Sus Con Sus B6 D2 Opalin Con Res Sus Con Sus B6 D2 Mbp Con Res Sus Con Sus B6 D2 Mobp Con Res Sus Con Sus B6 D2 r= r= r= r= RNA-seq qpcr Normalized CPM Plp1 Con Res Sus Con Sus B6 D2 r= Normalized CPM Plp1 Con Res Sus Con Res Sus B6 D2 r= Normalized CPM 11 Plp1 Con Res Sus Con Sus B6 D2 r=


84 Relative expression Relative expression A D Opalin B6 Cortex Ermn Mobp Plp1 D2 Cortex Opalin Ermn Mobp Plp1 Mbp Mbp Relative expression E Relative expression B B6 Hypothalamus D2 Hypothalamus p = Opalin Ermn Mobp Plp1 Mbp Opalin Ermn Mobp Plp1 Mbp Relative expression F Relative expression C D2 dhpc Opalin Ermn Opalin Ermn Mobp Plp1 Mbp B6 dhpc Con Res Sus Mobp Plp1 Mbp Corpus callosum thickness ( m) H G B6 Con Res Sus Corpus callosum thickness ( m) I D2 Con Res Sus
Capacity Utilization
 Capacity Utilization Tim Schöneberg 28th November Agenda Introduction Fixed and variable input ressources Technical capacity utilization Price based capacity utilization measure Long run and short run
Efficiency change over time
 Efficiency change over time Heikki Tikanmäki Optimointiopin seminaari 14.11.2007 Contents Introduction (11.1) Window analysis (11.2) Example, application, analysis Malmquist index (11.3) Dealing with panel
Gap-filling methods for CH 4 data
 Gap-filling methods for CH 4 data Sigrid Dengel University of Helsinki Outline - Ecosystems known for CH 4 emissions; - Why is gap-filling of CH 4 data not as easy and straight forward as CO 2 ; - Gap-filling
1. SIT. The handler and dog stop with the dog sitting at heel. When the dog is sitting, the handler cues the dog to heel forward.
 START START SIT 1. SIT. The handler and dog stop with the dog sitting at heel. When the dog is sitting, the handler cues the dog to heel forward. This is a static exercise. SIT STAND 2. SIT STAND. The
7.4 Variability management
 7.4 Variability management time... space software product-line should support variability in space (different products) support variability in time (maintenance, evolution) 1 Product variation Product
Other approaches to restrict multipliers
 Other approaches to restrict multipliers Heikki Tikanmäki Optimointiopin seminaari 10.10.2007 Contents Short revision (6.2) Another Assurance Region Model (6.3) Cone-Ratio Method (6.4) An Application of
Characterization of clay using x-ray and neutron scattering at the University of Helsinki and ILL
 Characterization of clay using x-ray and neutron scattering at the University of Helsinki and ILL Ville Liljeström, Micha Matusewicz, Kari Pirkkalainen, Jussi-Petteri Suuronen and Ritva Serimaa 13.3.2012
The CCR Model and Production Correspondence
 The CCR Model and Production Correspondence Tim Schöneberg The 19th of September Agenda Introduction Definitions Production Possiblity Set CCR Model and the Dual Problem Input excesses and output shortfalls
Results on the new polydrug use questions in the Finnish TDI data
 Results on the new polydrug use questions in the Finnish TDI data Multi-drug use, polydrug use and problematic polydrug use Martta Forsell, Finnish Focal Point 28/09/2015 Martta Forsell 1 28/09/2015 Esityksen
16. Allocation Models
 16. Allocation Models Juha Saloheimo 17.1.27 S steemianalsin Optimointiopin seminaari - Sks 27 Content Introduction Overall Efficienc with common prices and costs Cost Efficienc S steemianalsin Revenue
Master's Programme in Life Science Technologies (LifeTech) Prof. Juho Rousu Director of the Life Science Technologies programme 3.1.
 Prof. Juho Rousu Director of the Life Science Technologies programme 3.1.") Master's Programme in Life Science Technologies (LifeTech) Prof. Juho Rousu Director of the Life Science Technologies programme 3.1.2017 Life Science Technologies Where Life Sciences meet with Technology
Master's Programme in Life Science Technologies (LifeTech) Prof. Juho Rousu Director of the Life Science Technologies programme 3.1.2017 Life Science Technologies Where Life Sciences meet with Technology
National Building Code of Finland, Part D1, Building Water Supply and Sewerage Systems, Regulations and guidelines 2007
 National Building Code of Finland, Part D1, Building Water Supply and Sewerage Systems, Regulations and guidelines 2007 Chapter 2.4 Jukka Räisä 1 WATER PIPES PLACEMENT 2.4.1 Regulation Water pipe and its
LYTH-CONS CONSISTENCY TRANSMITTER
 LYTH-CONS CONSISTENCY TRANSMITTER LYTH-INSTRUMENT OY has generate new consistency transmitter with blade-system to meet high technical requirements in Pulp&Paper industries. Insurmountable advantages are
The role of 3dr sector in rural -community based- tourism - potentials, challenges
 The role of 3dr sector in rural -community based- tourism - potentials, challenges Lappeenranta, 5th September 2014 Contents of the presentation 1. SEPRA what is it and why does it exist? 2. Experiences
Constructive Alignment in Specialisation Studies in Industrial Pharmacy in Finland
 Constructive Alignment in Specialisation Studies in Industrial Pharmacy in Finland Anne Mari Juppo, Nina Katajavuori University of Helsinki Faculty of Pharmacy 23.7.2012 1 Background Pedagogic research
Network to Get Work. Tehtäviä opiskelijoille Assignments for students. www.laurea.fi
 Network to Get Work Tehtäviä opiskelijoille Assignments for students www.laurea.fi Ohje henkilöstölle Instructions for Staff Seuraavassa on esitetty joukko tehtäviä, joista voit valita opiskelijaryhmällesi
Alternative DEA Models
 Mat-2.4142 Alternative DEA Models 19.9.2007 Table of Contents Banker-Charnes-Cooper Model Additive Model Example Data Home assignment BCC Model (Banker-Charnes-Cooper) production frontiers spanned by convex
On instrument costs in decentralized macroeconomic decision making (Helsingin Kauppakorkeakoulun julkaisuja ; D-31)
") On instrument costs in decentralized macroeconomic decision making (Helsingin Kauppakorkeakoulun julkaisuja ; D-31) Juha Kahkonen Click here if your download doesn"t start automatically On instrument costs
On instrument costs in decentralized macroeconomic decision making (Helsingin Kauppakorkeakoulun julkaisuja ; D-31) Juha Kahkonen Click here if your download doesn"t start automatically On instrument costs
Information on preparing Presentation
 Information on preparing Presentation Seminar on big data management Lecturer: Spring 2017 20.1.2017 1 Agenda Hints and tips on giving a good presentation Watch two videos and discussion 22.1.2017 2 Goals
RANTALA SARI: Sairaanhoitajan eettisten ohjeiden tunnettavuus ja niiden käyttö hoitotyön tukena sisätautien vuodeosastolla
 TURUN YLIOPISTO Hoitotieteen laitos RANTALA SARI: Sairaanhoitajan eettisten ohjeiden tunnettavuus ja niiden käyttö hoitotyön tukena sisätautien vuodeosastolla Pro gradu -tutkielma, 34 sivua, 10 liitesivua
Kysymys 5 Compared to the workload, the number of credits awarded was (1 credits equals 27 working hours): (4)
: (4)") Tilasto T1106120-s2012palaute Kyselyn T1106120+T1106120-s2012palaute yhteenveto: vastauksia (4) Kysymys 1 Degree programme: (4) TIK: TIK 1 25% ************** INF: INF 0 0% EST: EST 0 0% TLT: TLT 0 0% BIO:
Tilasto T1106120-s2012palaute Kyselyn T1106120+T1106120-s2012palaute yhteenveto: vastauksia (4) Kysymys 1 Degree programme: (4) TIK: TIK 1 25% ************** INF: INF 0 0% EST: EST 0 0% TLT: TLT 0 0% BIO:
LX 70. Ominaisuuksien mittaustulokset 1-kerroksinen 2-kerroksinen. Fyysiset ominaisuudet, nimellisarvot. Kalvon ominaisuudet
 LX 70 % Läpäisy 36 32 % Absorptio 30 40 % Heijastus 34 28 % Läpäisy 72 65 % Heijastus ulkopuoli 9 16 % Heijastus sisäpuoli 9 13 Emissiivisyys.77.77 Auringonsuojakerroin.54.58 Auringonsäteilyn lämmönsiirtokerroin.47.50
Valuation of Asian Quanto- Basket Options
 Valuation of Asian Quanto- Basket Options (Final Presentation) 21.11.2011 Thesis Instructor and Supervisor: Prof. Ahti Salo Työn saa tallentaa ja julkistaa Aalto-yliopiston avoimilla verkkosivuilla. Muilta
Returns to Scale II. S ysteemianalyysin. Laboratorio. Esitelmä 8 Timo Salminen. Teknillinen korkeakoulu
 Returns to Scale II Contents Most Productive Scale Size Further Considerations Relaxation of the Convexity Condition Useful Reminder Theorem 5.5 A DMU found to be efficient with a CCR model will also be
AYYE 9/ HOUSING POLICY
 AYYE 9/12 2.10.2012 HOUSING POLICY Mission for AYY Housing? What do we want to achieve by renting apartments? 1) How many apartments do we need? 2) What kind of apartments do we need? 3) To whom do we
S Sähkön jakelu ja markkinat S Electricity Distribution and Markets
 S-18.3153 Sähkön jakelu ja markkinat S-18.3154 Electricity Distribution and Markets Voltage Sag 1) Kolmivaiheinen vastukseton oikosulku tapahtuu 20 kv lähdöllä etäisyydellä 1 km, 3 km, 5 km, 8 km, 10 km
On instrument costs in decentralized macroeconomic decision making (Helsingin Kauppakorkeakoulun julkaisuja ; D-31)
") On instrument costs in decentralized macroeconomic decision making (Helsingin Kauppakorkeakoulun julkaisuja ; D-31) Juha Kahkonen Click here if your download doesn"t start automatically On instrument costs
On instrument costs in decentralized macroeconomic decision making (Helsingin Kauppakorkeakoulun julkaisuja ; D-31) Juha Kahkonen Click here if your download doesn"t start automatically On instrument costs
Julkaisun laji Opinnäytetyö. Sivumäärä 43
 OPINNÄYTETYÖN KUVAILULEHTI Tekijä(t) SUKUNIMI, Etunimi ISOVIITA, Ilari LEHTONEN, Joni PELTOKANGAS, Johanna Työn nimi Julkaisun laji Opinnäytetyö Sivumäärä 43 Luottamuksellisuus ( ) saakka Päivämäärä 12.08.2010
The Viking Battle - Part Version: Finnish
 The Viking Battle - Part 1 015 Version: Finnish Tehtävä 1 Olkoon kokonaisluku, ja olkoon A n joukko A n = { n k k Z, 0 k < n}. Selvitä suurin kokonaisluku M n, jota ei voi kirjoittaa yhden tai useamman
GOOD WORK LONGER CAREER:
 Juhani Ilmarinen, Ville Ilmarinen, Pekka Huuhtanen, Veikko Louhevaara, Ove Näsman GOOD WORK LONGER CAREER: WORK WELL-BEING IN FINNISH TECHNOLOGY INDUSTRIES 2010-2015 Background Collective agreement between
Bounds on non-surjective cellular automata
 Bounds on non-surjective cellular automata Jarkko Kari Pascal Vanier Thomas Zeume University of Turku LIF Marseille Universität Hannover 27 august 2009 J. Kari, P. Vanier, T. Zeume (UTU) Bounds on non-surjective
Uusi Ajatus Löytyy Luonnosta 4 (käsikirja) (Finnish Edition)
 (Finnish Edition)") Uusi Ajatus Löytyy Luonnosta 4 (käsikirja) (Finnish Edition) Esko Jalkanen Click here if your download doesn"t start automatically Uusi Ajatus Löytyy Luonnosta 4 (käsikirja) (Finnish Edition) Esko Jalkanen
Uusi Ajatus Löytyy Luonnosta 4 (käsikirja) (Finnish Edition) Esko Jalkanen Click here if your download doesn"t start automatically Uusi Ajatus Löytyy Luonnosta 4 (käsikirja) (Finnish Edition) Esko Jalkanen
C++11 seminaari, kevät Johannes Koskinen
 C++11 seminaari, kevät 2012 Johannes Koskinen Sisältö Mikä onkaan ongelma? Standardidraftin luku 29: Atomiset tyypit Muistimalli Rinnakkaisuus On multicore systems, when a thread writes a value to memory,
Digital Admap Native. Campaign: Kesko supermarket
 Digital Admap Native Campaign: Kesko supermarket Digital Admap Native Campaign: Kesko Supermarket Mainosmuoto: Natiivi Media: IS.fi Campaign period: 25 September Date of measurement: 26 September Unique:
Reliable diagnostic support Ultra-light design
 EN Powerful illumination Intelligent charging management Reliable diagnostic support Ultra-light design VISIOMED Optima UV original scale 1:1 VISIOMED Optima Quality Made Easy and an illumination close
OP1. PreDP StudyPlan
 OP1 PreDP StudyPlan PreDP The preparatory year classes are in accordance with the Finnish national curriculum, with the distinction that most of the compulsory courses are taught in English to familiarize
Curriculum. Gym card
 A new school year Curriculum Fast Track Final Grading Gym card TET A new school year Work Ethic Detention Own work Organisation and independence Wilma TMU Support Services Well-Being CURRICULUM FAST TRACK
ReFuel 70 % Emission Reduction Using Renewable High Cetane Number Paraffinic Diesel Fuel. Kalle Lehto, Aalto-yliopisto 5.5.
 ReFuel 70 % Emission Reduction Using Renewable High Cetane Number Paraffinic Diesel Fuel Kalle Lehto, Aalto-yliopisto 5.5.2011 Otaniemi ReFuel a three year research project (2009-2011) goal utilize the
MUSEOT KULTTUURIPALVELUINA
 Elina Arola MUSEOT KULTTUURIPALVELUINA Tutkimuskohteena Mikkelin museot Opinnäytetyö Kulttuuripalvelujen koulutusohjelma Marraskuu 2005 KUVAILULEHTI Opinnäytetyön päivämäärä 25.11.2005 Tekijä(t) Elina
T Statistical Natural Language Processing Answers 6 Collocations Version 1.0
 T-61.5020 Statistical Natural Language Processing Answers 6 Collocations Version 1.0 1. Let s start by calculating the results for pair valkoinen, talo manually: Frequency: Bigrams valkoinen, talo occurred
TM ETRS-TM35FIN-ETRS89 WTG
 SHADOW - Main Result Assumptions for shadow calculations Maximum distance for influence Calculate only when more than 20 % of sun is covered by the blade Please look in WTG table WindPRO version 2.8.579
Metsälamminkankaan tuulivoimapuiston osayleiskaava
 VAALAN KUNTA TUULISAIMAA OY Metsälamminkankaan tuulivoimapuiston osayleiskaava Liite 3. Varjostusmallinnus FCG SUUNNITTELU JA TEKNIIKKA OY 12.5.2015 P25370 SHADOW - Main Result Assumptions for shadow calculations
On instrument costs in decentralized macroeconomic decision making (Helsingin Kauppakorkeakoulun julkaisuja ; D-31)
") On instrument costs in decentralized macroeconomic decision making (Helsingin Kauppakorkeakoulun julkaisuja ; D-31) Juha Kahkonen Click here if your download doesn"t start automatically On instrument costs
On instrument costs in decentralized macroeconomic decision making (Helsingin Kauppakorkeakoulun julkaisuja ; D-31) Juha Kahkonen Click here if your download doesn"t start automatically On instrument costs
Statistical design. Tuomas Selander
 Statistical design Tuomas Selander 28.8.2014 Introduction Biostatistician Work area KYS-erva KYS, Jyväskylä, Joensuu, Mikkeli, Savonlinna Work tasks Statistical methods, selection and quiding Data analysis
TM ETRS-TM35FIN-ETRS89 WTG
 SHADOW - Main Result Assumptions for shadow calculations Maximum distance for influence Calculate only when more than 20 % of sun is covered by the blade Please look in WTG table WindPRO version 2.9.269
Guideline on Similar biological medicinal products containing biotechnology-derived proteins as active substance: non-clinical and clinical issues
 Guideline on Similar biological medicinal products containing biotechnology-derived proteins as active substance: non-clinical and clinical issues EMA Workshop on Biosimilars, 31 October 2014 Pekka Kurki
Siirtymä maisteriohjelmiin tekniikan korkeakoulujen välillä Transfer to MSc programmes between engineering schools
 Siirtymä maisteriohjelmiin tekniikan korkeakoulujen välillä Transfer to MSc programmes between engineering schools Akateemisten asioiden komitea Academic Affairs Committee 11 October 2016 Eija Zitting
ELEMET- MOCASTRO. Effect of grain size on A 3 temperatures in C-Mn and low alloyed steels - Gleeble tests and predictions. Period
 1 ELEMET- MOCASTRO Effect of grain size on A 3 temperatures in C-Mn and low alloyed steels - Gleeble tests and predictions Period 20.02-25.05.2012 Diaarinumero Rahoituspäätöksen numero 1114/31/2010 502/10
Information on Finnish Courses Autumn Semester 2017 Jenni Laine & Päivi Paukku Centre for Language and Communication Studies
 Information on Finnish Courses Autumn Semester 2017 Jenni Laine & Päivi Paukku 24.8.2017 Centre for Language and Communication Studies Puhutko suomea? -Hei! -Hei hei! -Moi! -Moi moi! -Terve! -Terve terve!
3 9-VUOTIAIDEN LASTEN SUORIUTUMINEN BOSTONIN NIMENTÄTESTISTÄ
 Puhe ja kieli, 27:4, 141 147 (2007) 3 9-VUOTIAIDEN LASTEN SUORIUTUMINEN BOSTONIN NIMENTÄTESTISTÄ Soile Loukusa, Oulun yliopisto, suomen kielen, informaatiotutkimuksen ja logopedian laitos & University
Choose Finland-Helsinki Valitse Finland-Helsinki
 Write down the Temporary Application ID. If you do not manage to complete the form you can continue where you stopped with this ID no. Muista Temporary Application ID. Jos et onnistu täyttää lomake loppuun
7. Product-line architectures
 7. Product-line architectures 7.1 Introduction 7.2 Product-line basics 7.3 Layered style for product-lines 7.4 Variability management 7.5 Benefits and problems with product-lines 1 Short history of software
Information on Finnish Language Courses Spring Semester 2018 Päivi Paukku & Jenni Laine Centre for Language and Communication Studies
 Information on Finnish Language Courses Spring Semester 2018 Päivi Paukku & Jenni Laine 4.1.2018 Centre for Language and Communication Studies Puhutko suomea? -Hei! -Hei hei! -Moi! -Moi moi! -Terve! -Terve
( ( OX2 Perkkiö. Rakennuskanta. Varjostus. 9 x N131 x HH145
 OX2 9 x N131 x HH145 Rakennuskanta Asuinrakennus Lomarakennus Liike- tai julkinen rakennus Teollinen rakennus Kirkko tai kirkollinen rak. Muu rakennus Allas Varjostus 1 h/a 8 h/a 20 h/a 0 0,5 1 1,5 2 km
anna minun kertoa let me tell you
 anna minun kertoa let me tell you anna minun kertoa I OSA 1. Anna minun kertoa sinulle mitä oli. Tiedän että osaan. Kykenen siihen. Teen nyt niin. Minulla on oikeus. Sanani voivat olla puutteellisia mutta
Skene. Games Refueled. Muokkaa perustyyl. napsautt. @Games for Health, Kuopio. 2013 kari.korhonen@tekes.fi. www.tekes.fi/skene
 Skene Muokkaa perustyyl. Games Refueled napsautt. @Games for Health, Kuopio Muokkaa alaotsikon perustyyliä napsautt. 2013 kari.korhonen@tekes.fi www.tekes.fi/skene 10.9.201 3 Muokkaa Skene boosts perustyyl.
Lataa Cognitive Function in Opioid Substitution Treated Patiens - Pekka Rapeli. Lataa
 Lataa Cognitive Function in Opioid Substitution Treated Patiens - Pekka Rapeli Lataa Kirjailija: Pekka Rapeli ISBN: 9789523022232 Sivumäärä: 173 Formaatti: PDF Tiedoston koko: 11.54 Mb Opioid substitution
Tynnyrivaara, OX2 Tuulivoimahanke. ( Layout 9 x N131 x HH145. Rakennukset Asuinrakennus Lomarakennus 9 x N131 x HH145 Varjostus 1 h/a 8 h/a 20 h/a
 , Tuulivoimahanke Layout 9 x N131 x HH145 Rakennukset Asuinrakennus Lomarakennus 9 x N131 x HH145 Varjostus 1 h/a 8 h/a 20 h/a 0 0,5 1 1,5 km 2 SHADOW - Main Result Assumptions for shadow calculations
TM ETRS-TM35FIN-ETRS89 WTG
 VE1 SHADOW - Main Result Calculation: 8 x Nordex N131 x HH145m Assumptions for shadow calculations Maximum distance for influence Calculate only when more than 20 % of sun is covered by the blade Please
Somaattinen sairaus nuoruudessa ja mielenterveyden häiriön puhkeamisen riski
 + Somaattinen sairaus nuoruudessa ja mielenterveyden häiriön puhkeamisen riski LINNEA KARLSSON + Riskitekijöitä n Ulkonäköön liittyvät muutokset n Toimintakyvyn menetykset n Ikätovereista eroon joutuminen
EUROOPAN PARLAMENTTI
 EUROOPAN PARLAMENTTI 2004 2009 Kansalaisvapauksien sekä oikeus- ja sisäasioiden valiokunta 2008/0101(CNS) 2.9.2008 TARKISTUKSET 9-12 Mietintöluonnos Luca Romagnoli (PE409.790v01-00) ehdotuksesta neuvoston
Co-Design Yhteissuunnittelu
 Co-Design Yhteissuunnittelu Tuuli Mattelmäki DA, associate professor Aalto University School of Arts, Design and Architecture School of Arts, Design and Architecture design with and for people Codesign
Increase of opioid use in Finland when is there enough key indicator data to state a trend?
 Increase of opioid use in Finland when is there enough key indicator data to state a trend? Martta Forsell, Finnish Focal Point 28.9.2015 Esityksen nimi / Tekijä 1 Martta Forsell Master of Social Sciences
ECVETin soveltuvuus suomalaisiin tutkinnon perusteisiin. Case:Yrittäjyyskurssi matkailualan opiskelijoille englantilaisen opettajan toteuttamana
 ECVETin soveltuvuus suomalaisiin tutkinnon perusteisiin Case:Yrittäjyyskurssi matkailualan opiskelijoille englantilaisen opettajan toteuttamana Taustaa KAO mukana FINECVET-hankeessa, jossa pilotoimme ECVETiä
BLOCKCHAINS AND ODR: SMART CONTRACTS AS AN ALTERNATIVE TO ENFORCEMENT
 UNCITRAL EMERGENCE CONFERENCE 13.12.2016 Session I: Emerging Legal Issues in the Commercial Exploitation of Deep Seabed, Space and AI BLOCKCHAINS AND ODR: SMART CONTRACTS AS AN ALTERNATIVE TO ENFORCEMENT
TM ETRS-TM35FIN-ETRS89 WTG
 SHADOW - Main Result Assumptions for shadow calculations Maximum distance for influence Calculate only when more than 20 % of sun is covered by the blade Please look in WTG table WindPRO version 2.8.579
 Digitally signed by Hans Vadbäck DN: cn=hans Vadbäck, o, ou=fcg Suunnittelu ja Tekniikka Oy, email=hans.vadback@fcg.fi, c=fi Date: 2016.12.20 15:45:35 +02'00' Jakob Kjellman Digitally signed by Jakob Kjellman
Guidebook for Multicultural TUT Users
 1 Guidebook for Multicultural TUT Users WORKPLACE PIRKANMAA-hankkeen KESKUSTELUTILAISUUS 16.12.2010 Hyvää käytäntöä kehittämässä - vuorovaikutusopas kansainvälisille opiskelijoille TTY Teknis-taloudellinen
Tampere-Pirkkala airport Survey on noise
 Tampere-Pirkkala airport Survey on noise Satu Routama Presentation in N-ALM/Copenhagen May 206, Mikko Viinikainen Tampere-Pirkkala airport In 204 400 000 pax (4th biggest in Finland) 5 000 ops (3rd biggest
WindPRO version joulu 2012 Printed/Page :47 / 1. SHADOW - Main Result
 SHADOW - Main Result Assumptions for shadow calculations Maximum distance for influence Calculate only when more than 20 % of sun is covered by the blade Please look in WTG table WindPRO version 2.8.579
TM ETRS-TM35FIN-ETRS89 WTG
 SHADOW - Main Result Assumptions for shadow calculations Maximum distance for influence Calculate only when more than 20 % of sun is covered by the blade Please look in WTG table WindPRO version 2.8.579
Methods S1. Sequences relevant to the constructed strains, Related to Figures 1-6.
 Methods S1. Sequences relevant to the constructed strains, Related to Figures 1-6. A. Promoter Sequences Gal4 binding sites are highlighted in the color referenced in Figure 1A when possible. Site 1: red,
MALE ADULT FIBROBLAST LINE (82-6hTERT)
") Double-stranded methylation patterns of a 104-bp L1 promoter in DNAs from male and female fibroblasts, male leukocytes and female lymphoblastoid cells using hairpin-bisulfite PCR. Fifteen L1 sequences
Double-stranded methylation patterns of a 104-bp L1 promoter in DNAs from male and female fibroblasts, male leukocytes and female lymphoblastoid cells using hairpin-bisulfite PCR. Fifteen L1 sequences
Infrastruktuurin asemoituminen kansalliseen ja kansainväliseen kenttään Outi Ala-Honkola Tiedeasiantuntija
 Infrastruktuurin asemoituminen kansalliseen ja kansainväliseen kenttään Outi Ala-Honkola Tiedeasiantuntija 1 Asemoitumisen kuvaus Hakemukset parantuneet viime vuodesta, mutta paneeli toivoi edelleen asemoitumisen
Palveluiden asiakastyytyväisyyskysely
 Palveluiden asiakastyytyväisyyskysely Yhteenvetoa (Summary in English, see below) Sakari Heikkilä Kehityspalvelut Kyselystä Henkilöstölle suunnattu kysely oli avoinna 2.3.-26.3. Uutista ja siihen liittyviä
Supplementary information: Biocatalysis on the surface of Escherichia coli: melanin pigmentation of the cell. exterior
 Supplementary information: Biocatalysis on the surface of Escherichia coli: melanin pigmentation of the cell exterior Martin Gustavsson, David Hörnström, Susanna Lundh, Jaroslav Belotserkovsky, Gen Larsson
Teacher's Professional Role in the Finnish Education System Katriina Maaranen Ph.D. Faculty of Educational Sciences University of Helsinki, Finland
 Teacher's Professional Role in the Finnish Education System Katriina Maaranen Ph.D. Faculty of Educational Sciences University of Helsinki, Finland www.helsinki.fi/yliopisto This presentation - Background
Basset: Learning the regulatory code of the accessible genome with deep convolutional neural networks. David R. Kelley
 Basset: Learning the regulatory code of the accessible genome with deep convolutional neural networks David R. Kelley DNA codes for complex life. How? Kundaje et al. Integrative analysis of 111 reference
Group 2 - Dentego PTH Korvake. Peer Testing Report
 Group 2 - Dentego PTH Korvake Peer Testing Report Revisions Version Date Author Description 1.0 Henrik Klinkmann First version Table of Contents Contents Revisions... 2 Table of Contents... 2 Testing...
WindPRO version joulu 2012 Printed/Page :42 / 1. SHADOW - Main Result
 SHADOW - Main Result Assumptions for shadow calculations Maximum distance for influence Calculate only when more than 20 % of sun is covered by the blade Please look in WTG table 13.6.2013 19:42 / 1 Minimum
MEETING PEOPLE COMMUNICATIVE QUESTIONS
 Tiistilän koulu English Grades 7-9 Heikki Raevaara MEETING PEOPLE COMMUNICATIVE QUESTIONS Meeting People Hello! Hi! Good morning! Good afternoon! How do you do? Nice to meet you. / Pleased to meet you.
Supply Chain Management and Material Handling in Paper Industry Case Tervakoski Oy
 Tampere University of Applied Sciences Paper technology International Pulp and Paper Technology Supply Chain Management and Material Handling in Paper Industry Case Tervakoski Oy Supervisor Commissioned
Paikkatiedon semanttinen mallinnus, integrointi ja julkaiseminen Case Suomalainen ajallinen paikkaontologia SAPO
 Paikkatiedon semanttinen mallinnus, integrointi ja julkaiseminen Case Suomalainen ajallinen paikkaontologia SAPO Tomi Kauppinen, Eero Hyvönen, Jari Väätäinen Semantic Computing Research Group (SeCo) http://www.seco.tkk.fi/
Information on Finnish Language Courses Spring Semester 2017 Jenni Laine
 Information on Finnish Language Courses Spring Semester 2017 Jenni Laine 4.1.2017 KIELIKESKUS LANGUAGE CENTRE Puhutko suomea? Do you speak Finnish? -Hei! -Moi! -Mitä kuuluu? -Kiitos, hyvää. -Entä sinulle?
TM ETRS-TM35FIN-ETRS89 WTG
 SHADOW - Main Result Assumptions for shadow calculations Maximum distance for influence Calculate only when more than 20 % of sun is covered by the blade Please look in WTG table WindPRO version 2.8.579
TM ETRS-TM35FIN-ETRS89 WTG
 SHADOW - Main Result Assumptions for shadow calculations Maximum distance for influence Calculate only when more than 20 % of sun is covered by the blade Please look in WTG table WindPRO version 2.8.579
TM ETRS-TM35FIN-ETRS89 WTG
 SHADOW - Main Result Assumptions for shadow calculations Maximum distance for influence Calculate only when more than 20 % of sun is covered by the blade Please look in WTG table WindPRO version 2.8.579
The BaltCICA Project Climate Change: Impacts, Costs and Adaptation in the Baltic Sea Region
 The BaltCICA Project Climate Change: Impacts, Costs and Adaptation in the Baltic Sea Region The BaltCICA Project is designed to focus on the most imminent problems that climate change is likely to cause
State of the Union... Functional Genomics Research Stream. Molecular Biology. Genomics. Computational Biology
 Functional Genomics Research Stream State of the Union... Research Meeting: February 16, 2010 Functional Genomics & Research Report III Concepts Genomics Molecular Biology Computational Biology Genome
FinFamily PostgreSQL installation ( ) FinFamily PostgreSQL
 FinFamily PostgreSQL") FinFamily PostgreSQL 1 Sisällys / Contents FinFamily PostgreSQL... 1 1. Asenna PostgreSQL tietokanta / Install PostgreSQL database... 3 1.1. PostgreSQL tietokannasta / About the PostgreSQL database...
FinFamily PostgreSQL 1 Sisällys / Contents FinFamily PostgreSQL... 1 1. Asenna PostgreSQL tietokanta / Install PostgreSQL database... 3 1.1. PostgreSQL tietokannasta / About the PostgreSQL database...
( ,5 1 1,5 2 km
 Tuulivoimala Rakennukset Asuinrakennus Liikerak. tai Julkinen rak. Lomarakennus Teollinen rakennus Kirkollinen rakennus Varjostus "real case" h/a 1 h/a 8 h/a 20 h/a 4 5 3 1 2 6 7 8 9 10 0 0,5 1 1,5 2 km
,0 Yes ,0 120, ,8
 SHADOW - Main Result Calculation: Alue 2 ( x 9 x HH120) TuuliSaimaa kaavaluonnos Assumptions for shadow calculations Maximum distance for influence Calculate only when more than 20 % of sun is covered
NAO- ja ENO-osaamisohjelmien loppuunsaattaminen ajatuksia ja visioita
 NAO- ja ENO-osaamisohjelmien loppuunsaattaminen ajatuksia ja visioita NAO-ENO työseminaari VI Tampere 3.-4.6.2015 Projektisuunnittelija Erno Hyvönen erno.hyvonen@minedu.fi Aikuiskoulutuksen paradigman
TM ETRS-TM35FIN-ETRS89 WTG
 SHADOW - Main Result Assumptions for shadow calculations Maximum distance for influence Calculate only when more than 20 % of sun is covered by the blade Please look in WTG table 5.11.2013 16:44 / 1 Minimum
Exercise 1. (session: )
") EEN-E3001, FUNDAMENTALS IN INDUSTRIAL ENERGY ENGINEERING Exercise 1 (session: 24.1.2017) Problem 3 will be graded. The deadline for the return is on 31.1. at 12:00 am (before the exercise session). You
EEN-E3001, FUNDAMENTALS IN INDUSTRIAL ENERGY ENGINEERING Exercise 1 (session: 24.1.2017) Problem 3 will be graded. The deadline for the return is on 31.1. at 12:00 am (before the exercise session). You
TM ETRS-TM35FIN-ETRS89 WTG
 SHADOW - Main Result Assumptions for shadow calculations Maximum distance for influence Calculate only when more than 20 % of sun is covered by the blade Please look in WTG table 22.12.2014 11:33 / 1 Minimum
TM ETRS-TM35FIN-ETRS89 WTG
 SHADOW - Main Result Calculation: N117 x 9 x HH141 Assumptions for shadow calculations Maximum distance for influence Calculate only when more than 20 % of sun is covered by the blade Please look in WTG
Experimental Identification and Computational Characterization of a Novel. Extracellular Metalloproteinase Produced by Clostridium sordellii
 Electronic Supplementary Material (ESI) for RSC Advances. This journal is The Royal Society of Chemistry 207 Supplementary Information Experimental Identification and Computational Characterization of
Use of spatial data in the new production environment and in a data warehouse
 Use of spatial data in the new production environment and in a data warehouse Nordic Forum for Geostatistics 2007 Session 3, GI infrastructure and use of spatial database Statistics Finland, Population
Windows Phone. Module Descriptions. Opiframe Oy puh. +358 44 7220800 eero.huusko@opiframe.com. 02600 Espoo
 Windows Phone Module Descriptions Mikä on RekryKoulutus? Harvassa ovat ne työnantajat, jotka löytävät juuri heidän alansa hallitsevat ammatti-ihmiset valmiina. Fiksuinta on tunnustaa tosiasiat ja hankkia