The Finnish Eurowaternet with information about Finnish water resources and monitoring strategies
|
|
|
- Jarkko Pakarinen
- 7 vuotta sitten
- Katselukertoja:
Transkriptio

1 The Finnish Environment 445 ENVIRONMENTAL PROTECTION Jorma Niemi, Pertti Heinonen, Sari Mitikka, Heidi Vuoristo, Olli-Pekka Pietiläinen, Markku Puupponen and Esa Rönkä (Eds.) The Finnish Eurowaternet with information about Finnish water resources and monitoring strategies FINNISH ENVIRONMENT INSTITUTE
2
3 The Finnish Environment 445 Jorma Niemi, Pertti Heinonen, Sari Mitikka, Heidi Vuoristo, Olli-Pekka Pietiläinen, Markku Puupponen and Esa Rönkä (Eds.) The Finnish Eurowaternet with information about Finnish water resources and monitoring strategies Compiled by Finnish Environment Institute and Regional Environment Centres HELSINKI 2001 FINNISH ENVIRONMENT INSTITUTE
4 002 ISBN ISSN The publication is available on our website at: Cover page: Part of the Finnish Lake District (75 x 100 km) showing 11 sampling sites belonging to the EUROWATERNET monitoring network.the large lake in the middle is Lake Haukivesi. Published with permission of the National Land Survey of Finland, MML 7/MYY/01. Figs. 1 and 2 published with the same permission. Page layout: DTPage Oy Printer: Edita Ltd Helsinki 2001 Finland 2 The Finnish Environment 445
5 Preface The monitoring of inland waters has a long tradition in Finland. Regular monitoring of surface water levels started in the 1840s and since the 1910s water levels and discharges have been monitored in all important river systems. In 1910 the publication of the Hydrological Yearbook began. National water quality monitoring of rivers started in 1962 and that of lakes in After the implementation of the Water Act in 1962 a local pollution control monitoring network based on the polluter pays-principle was created and has been in operation since then. This network, typical of the Finnish monitoring strategy, currently includes some 5000 sampling sites. The total amount of data produced by monitoring programmes has rapidly increased. Currently the cumulative database of the Finnish Environment Institute contains water quality data of about sampling sites (ca 17 million results), phytoplankton data of about sampling sites (ca results) and hydrological data of more than sites (ca 23 million results). General concern for environmental quality has increased worldwide. Environmental problems have become more international and the role of environmental monitoring has consequently increased. Finland among other countries must develop its monitoring programmes according to international requirements. The national EUROWATERNET monitoring networks should be designed according to the Guidelines presented by the European Environment Agency and put into operation. Together the national networks will form the EUROWATERNETmonitoring network that will be the first step towards a pan-european practice in fresh water monitoring. This report presents the EUROWATERNET monitoring network for Finnish Inland Waters. The network was designed together with the Regional Environment Centres and the Finnish Environment Institute. It is based primarily on sites included in current national monitoring networks and local pollution control monitoring networks and includes a total of 195 river sites, 253 lake sites and 74 hydrological baseline sites. The network for rivers and that of lakes were put into operation from the first of January, In the future the network will be developed to meet the requirements set by the EU Water Framework Directive. I am confident that this network will produce useful information about Finnish waters and will contribute in providing a reliable overall picture of the state of European inland waters. Finally, I would like to take this opportunity of thanking the personnel of the Regional Environment Centres and the Finnish Environment Institute and the editors for their work in the design of the network and in the compilation of this report. Lea Kauppi Director General Finnish Environment Institute The Finnish Environment 445 3
6 4 The Finnish Environment 445
7 Contents Preface...3 Acknowledgements Introduction The Finnish EUROWATERNET The EUROWATERNET river network The EUROWATERNET lake network Surface water quantity Current groundwater network Information about Finnish fresh waters Water resources Water pollution Surface water quality Groundwater quality Current Finnish monitoring strategies Monitoring of surface water quantity Water quality monitoring Analytical methods and quality assurance Reporting based on monitoring results References...35 Appendices 1. The EUROWATERNET river network: sites and analyses The EUROWATERNET lake network: sites and analyses Hydrological baseline sites Current groundwater network Documentation pages The Finnish Environment 445 5
8 Acknowledgements Design of the Finnish EUROWATERNET-monitoring network and the compilation of this report would not have been possible without the efforts and cooperation of experts from different fields of environmental research. A large number of experts working in Environmental Administration both in the Finnish Environment Institute and the Regional Environment Centres contributed in the preparation of this work. Contributors from the Finnish Environment Institute and their field of expertise: Maija Euren: Analytical methods Pertti Heinonen: Surface water quality and quantity, harmful substances Matti Joukola: GIS-tasks Markku Korhonen: Harmful substances Jaakko Mannio: Acidification, heavy metals Sari Mitikka (Sari Antikainen by earlier name): Lakes, reservoirs, surface water quality, maps Jorma Niemi: Rivers, surface water quality Olli-Pekka Pietiläinen: The Water Framework Directive, surface water quality Markku Puupponen: Surface water quantity Jouko Rissanen: Surface water quality, data sy stems Jouko Soveri, Esa Rönkä, Risto Mäkinen and Kimmo Peltonen: Groundwater Heidi Vuoristo: Rivers, lakes and reservoirs, particularly impact sites Contributors from the Regional Environment Centres: Uusimaa Regional Environment Centre: Leena Villa, Heidi Åkerla, Eeva-Riitta Puomio Southwest Finland Regional Environment Centre: Pasi Laihonen, Janne Suomela, Kauko Häkkilä, Helmi Kotilainen, Osmo Purhonen Häme Regional Environment Centre: Petri Horppila Pirkanmaa Regional Environment Centre: Timm Sothmann Southeast Finland Regional Environment Centre: Pentti Välipakka, Marja Kauppi South Savo Regional Environment Centre: Pirjo Hiltunen, Jarmo Kivinen North Savo Regional Environment Centre: Kristiina Servomaa, Taina Hammar North Karelia Regional Environment Centre: Marketta Ahtiainen, Kari-Matti Vuori, Merja Antikainen, Paula Mononen, Hannu Luotonen, Eeva Ottoila, Riitta Niinioja Central Finland Regional Environment Centre: Seppo Yli-Karjanmaa West Finland Regional Environment Centre: Esa Koskenniemi, Hans-Göran Lax Kainuu Regional Environment Centre: Sirkka-Liisa Markkanen North Ostrobothnia Regional Environment Centre: Anneli Ylitolonen, Jouni Näpänkangas, Liisa Kantola, Tero Väisänen Lapland Regional Environment Centre: Pekka Räinä The editors thank the contributors for their efforts and cooperation in the design of the network and the compilation of this report and Michael Bailey for revising the English of the manuscript. deceased 6 The Finnish Environment 445
9 1 Introduction This report presents the European Environment Agency s (EEA) Monitoring Network for Finnish Inland Waters. The Finnish EUROWATERNET is based primarily on existing sites of current national water quality monitoring networks supplemented with new sites; reference sites, impact sites, flux sites and transboundary rivers. In addition, the report presents summarized background information about the characteristics of Finnish fresh waters and the Finnish monitoring strategies (Sections 3 and 4). The design of the Finnish EUROWATERNET network was carried out simultaneously with the revision of the previous national monitoring programme according to the guidelines presented by Nixon (1996) and Nixon et al. (1998) in cooperation with the personnel of the Finnish Environment Institute (FEI) and 13 Regional Environment Centres (REC). The new revised National Monitoring Programme for (Niemi and Heinonen 2000, also available on a website: ) is a summary of all environmental monitoring conducted by the FEI and other national institutes of the country. It presents some 40 individual monitoring programmes run by the FEI and the RECs. The Finnish EUROWATERNET network for inland waters includes a total of 195 river sites (at least 338 were recommended by the guidelines) and 253 lake sites (at least 240 were recommended by the guidelines). Although the number of river sites is smaller than that recommended, it is sufficient to give a representative picture of country s river water quality, particularly as the number of different sampling site types in rivers (e.g. representative, reference, flux etc.) is as high as 245, because some sites belong to more than one site group e.g. a flux site may also be a representative site. The relative number of selected river and lake sites in the network emphasizes the overall importance of lakes in Finnish water resources. The Finnish EUROWATERNET network for rivers and lakes was put into operation from the beginning of January, 2000 in the RECs. In May 2000 water quality data of river and lake sites of this network from the years was sent to the EEA. The groundwater network is still unfinished, but will be completed in the near future. The present groundwater monitoring programme described here includes a total of 53 groundwater reference sites and about 200 water supply and impact sites to be compiled later and will form the basis of the future EURO- WATERNET groundwater network. Monitoring of surface water quality and quantity was integrated as recommended by the guidelines. A hydrological network of 74 baseline sites describing general hydrological characteristics of the country was defined. The network described will form the core of the future fully representative EUROWATERNET monitoring network of the country. In the future this network will be further developed to meet the requirements set by the EU Water Framework Directive (WFD). The WFD will be an operational tool, setting the objectives for water protection across the EU countries for several decades to come. The basic idea of the WFD is to gather the The Finnish Environment 445 7
10 somewhat fragmented water policy instruments currently used in Europe into a single and widely accepted system. The key aims are to coordinate all the different objectives for which water is protected and to coordinate all the measures taken to achieve the objectives and to increase public participation. The role of individual citizens, non-governmental organizations and other interest groups will thus be of crucial importance. The WFD calls for new ways to classify and monitor surface water and groundwater in Europe. The classification of ecological status of surface waters will mainly be based on biological variables instead of physico-chemical variables that have traditionally been used in water quality assessment during recent decades. The monitoring programmes required by the WFD will probably require more stations than are now required by the EUROWATERNET. The linkage between the EUROWATERNET and the WFD is perhaps not as clear as could be expected (Lack and Nixon 2000). However, it may be worth considering whether these two networks should be developed to be, if not identical, very close to each other in the future. 8 The Finnish Environment 445
11 The Finnish EUROWATERNET The EUROWATERNET river network The Finnish EUROWATERNET monitoring network for rivers was put into operation at the beginning of January, It consists of 195 river sites, classified into the following site types: 29 reference sites, 74 representative sites, 79 impact sites, and 63 flux sites (these include 13 transboundary sites). The same site may belong to several groups, e.g. a reference site can be also a transboundary site. Therefore the number of site types (245) is greater than that of individual sites (195). Discharges can be calculated for every site either by direct measurement or by evaluation using data from nearby measurement stations or using models. The design of the network was carried out according to the principles presented by Nixon et al. (1998). The sites were selected using existing national, regional and statutory monitoring networks complemented with additional sites when necessary. Appendix 1 presents the river sites and the analyses carried out. Fig.1 shows their location on the map. Reference sites. According to the guidelines (Nixon et al. 1998), reference sites should be located on rivers in natural catchments with little or no human activity and with > 90% natural landscapes. Rivers that rigorously fulfill both of these criteria can hardly be found. Although all of the rivers selected completely fulfill the latter criterion, most of them are influenced to some extent by human activity. However, in the reference sites chosen human influence is typically slight, e.g. diffuse loading from very small human settlements scattered in the catchment area or insignificant loading from minor villages along the river, typically far upstream from the reference site. After discussions with the Regional Environment Centres (REC), a total of 29 reference sites that best fulfilled the criteria were selected. The sites were chosen by examining their geographical position and historical record of water quality, taking into account their areal distribution throughout the country and studying the published reports of nature conservation areas in the country (Ministry of the Environment 1992, NATURA 2000 programme). This report listed 68 surface waters, coastal areas, lakes and rivers that require particular protection because these waters are significant conservation areas both nationally and internationally. The majority of the reference sites are in northern and eastern parts of the country, where wide areas are still in near-pristine condition, population density is very low and there is little or no industrial activity. All these factors contribute to good water quality. A smaller proportion of the sites are in the Lake District in Central Finland and two are in western Finland. Representative sites. A total of 74 representative sites were selected to the monitoring network. These sites were selected from the earlier national monitoring network, in operation since The objective of the monitoring programme initiated in 1962 was to provide a general picture of the quality of inland waters and a benchmark for further studies. At that time, the effects of waste waters on surface water quality were of particular concern. From 1962 to the beginning of 1990 this network included about 200 sites. Soon after that, however, their number was reduced to about 70. Most of the sites have been monitored continuously The Finnish Environment 445 9
12
13 since 1962 either in national or in regional monitoring programmes. The sites are distributed relatively evenly throughout Finland and provide an overall spatial and temporal picture of the water quality of the country. Earlier monitoring programmes included many straits flowing between lakes. The straits, although a typical feature of the water resources in Finland, were however deleted from this network because they are not rivers in the true meaning of the word. Impact sites. The network for the monitoring of local pollution (See Section 4.2) is based on the Water Act. There are some polluters (cities, pulp and paper mills, other industrial plants, fishfarms etc.) obliged to monitor their impacts in the receiving waters. This network consists of a total of about monitoring sites in rivers, lakes and coastal waters. Of these are river sites. The objective was to distribute the impact sites (41 proposed for Finland) across the country so that the location of major sources of pollution could be taken into consideration. The rivers are polluted mainly by municipal wastewater, diffuse loading from agriculture, peat mining and fish farming; in some cases by industrial wastewater. Most of the rivers in the coastal strip and in northern Finland are impacted by flood control operations and water power production. The impact sites in individual rivers were selected so that they reflect the pollution typical of that river. Priority was given to those sites with high water quality sampling frequency and which are also sampled for biological variables. The aim was to include rivers representing all size categories as far as possible within the limits set by the existing pollution control programmes. The number of selected impact river sites was 79, which is higher than that recommended (41). Flux sites. The network includes 63 flux sites, mainly in rivers discharging to the Baltic Sea, to the Gulf of Bothnia or to the Gulf of Finland. Of these 13 are also transboundary sites. This network of flux sites has been in operation since 1970 and has been used to calculate material inputs discharged to the Baltic Sea by Finnish rivers. Pitkänen (1994) divided these rivers into two groups: large rivers and coastal rivers. The large rivers (R.Kymijoki, R.Kokemäenjoki, R.Oulujoki, R.Iijoki, R.Kemijoki and R.Tornionjoki) have large ( to km 2 ) catchment areas, modest to high lake percentage (5 to 20%) and relatively low percentage of arable land, typically less than 10% (exception: R. Kokemäenjoki, 16%). In these rivers annual variations in discharge are smaller and average residence times of the water much longer than in the case of coastal rivers. Typical characteristics of coastal rivers are a small drainage basin (400 to km 2 ), a low percentage of lakes (usually less than 5% ) and a relatively high percentage of fields (in the catchments of the Gulf of Finland and the Archipelago Sea from 20 to 40% and in those of the Bothnian Sea and Quark from 10 to 30%). Coastal rivers are situated on low terrain, flowing therefore slowly, have wide annual variations in discharge due to hydrological conditions (e.g. snow melt in spring and precipitation) and react rapidly to hydrological events due to their short residence time and high percentage of fields. Because of these characteristics their water quality is poorer than that of other rivers in the country. Sampling frequency and analyses. The EUROWATERNET river network is partly composed of sampling sites belonging to special monitoring programmes designed according to national or international objectives. Therefore, the sampling frequency and analyses carried out vary widely. The river sites of the network and analyses grouped to groups A E are shown in Appendix 1. The sub-programmes of the EUROWATERNET river network, sampling frequencies, sampling depths and analyses carried out are presented below. The Finnish Environment
14 GEMS sites (Global Environment Monitoring System) These sites belong to the GEMS monitoring programme. Water quality data of these sites has regularly been sent to Canada (UNEP and WHO GEMS/Water Collaborating Centre, National Water Research Institute, Environment Canada, Burlington), where they are analysed and reported with corresponding data from other countries. The sites: Kalkkistenkoski 4800, Kymijoki Huruksela 033:5600, Tornionjoki Kukkola Sampling depth: 1m Sampling frequency and analyses: Once per month, additional samples during high discharges groups A,B,C, D (Appendix 1) Monitoring sites of the Fishwater Directive (78/659 EU). This monitoring was commenced at the beginning of January, The sites: Bruksträsket, Luusua 2 Pielisjoki 1 Kaltimo Vuoksi Mansikkakoski 057:2800 Kymijoki Huruksela 033:5600 Vantaa 4,2 (6040) Ingarskilaån 0,4 Konhonvuolle 7300 Vilppulankoski 7700 Tammerkoski 8000 Nokiankoski 8200 Alavirta Siuronkoski 8400 Kokemäenjoki Kojo 35 Pori-Tre Myllykanava vp 9100 Lestijoki tien silta Siikajoki 8-tien silta Kiiminkijoki tien silta Simojoki as Liekovesi Tyrvään VL1 Sampling depth: 1m Sampling frequency and analyses: Sampled once per month for variables stated in the directive: temperature, dissolved oxygen, ph, suspended solids, BOD 7, total phosphorus, nitrites, phenolic compounds, petroleum hydrocarbons, nonionized ammonia, total residual chlorine (HOCl), total zinc and dissolved copper. Agreement of data exchange of the water quality of large rivers (Exchange of Information, Decisions 77/795/EEC and 86/574/EEC) Data have been sent to the EU Commission in Brussels since The sites: Kalkkistenkoski 4800 Kokemäenjoki, Kojo 35 Pori-Tre Vuoksi Mansikkakoski (057:2800) Iijoki Raasakka Oulujoki The Finnish Environment 445
15 Kemijoki Isohaara Tornionjoki Kukkola Paatsjoki Virtaniemi Sampling depth: 1m Sampling frequency and analyses: Sampled once per month, additional samples during periods of high discharges. Groups A,B,C (Appendix 1). Impact sites The sites: The sites, 79 in all, are marked as I in Appendix 1. The sites belong to different statutory monitoring programmes and therefore their analyses and sampling frequencies vary. The programmes are carried out by polluters that are obliged to monitor their receiving waters according to the Water Act and based on decisions of the Water Court. The programmes are supervised by the Regional Environment Centres. Sampling depth: Depths vary according to the programme. Sampling frequency and analyses: Frequency varies, being at least four times a year but often considerably higher. Analyses performed include commonly analysed water quality variables, but the selection varies according to the programme. Variables measured practically every time include dissolved oxygen, nutrients, ph, conductivity, colour, turbidity/suspended solids. Commonly measured variables are hygienic indicator bacteria and COD Mn. Variables measured only occasionally include alkalinity, acidity, dissolved nutrients, chlorophyll a, metals, mercury, dry matter and fixed residue. Seldom measured variables are BOD 7, AOX, TOC, oils, sulphate, chloride, sodium and only very rarely measured variables are total sulphur, phenols, resins, and PCB. Flux sites The sites: Of the 63 flux sites 33 (including 13 transboundary sites) belong to the programme in which the material balances discharged to the Baltic Sea through Finnish rivers are investigated. Sampling depth: Surface samples (1 m) are taken at these 33 sites Sampling frequency and analyses: At least 13 times per year. Some sites are analysed for some variables 22 times per year. Analyses include every time groups A and B and at some sites also C and D. The rest of the sites, 30 in all, (not belonging to the programme in which the material balances discharged to the Baltic Sea through Finnish rivers are investigated) are analysed typically once per month for groups A and B (Appendix 1). These are mostly transboundary rivers analysed with a lower frequency, generally 4 6 times a year. Other sites The sites: These are the sites that are not included in the above- mentioned groups. Sampling depth: 1m Sampling frequency and analyses: Four times a year: 1 10 March, May, August and October. Additional samples are taken during periods of high discharges. Group A (Appendix 1). Benthic animals are determined in 17 sites and toxic chemicals in three sites (R.Kymijoki Huruksela, R. Kokemäenjoki Kojo 35 Pori- Tre and Tornionjoki Kukkola) The Finnish Environment
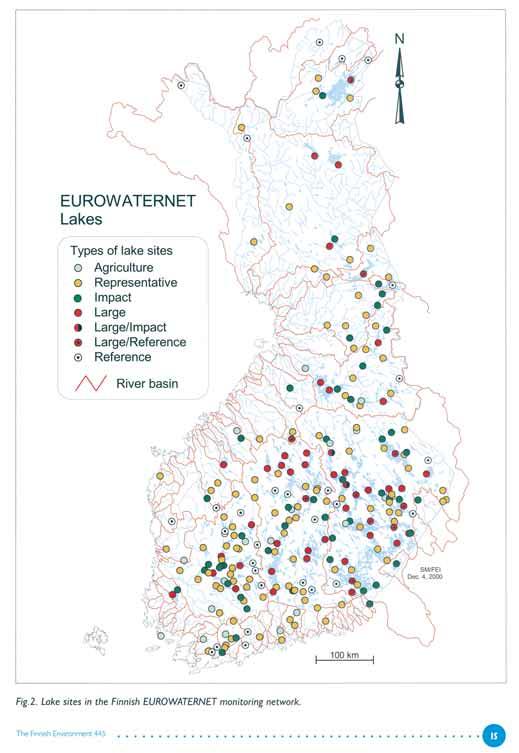
16 2.2 The EUROWATERNET lake network In Finland the number of lakes is high, considerably higher than in most EEA countries except Sweden and Norway (Tables 1 and 2). Table 1. Number of lakes and reservoirs in some countries in the EEA area (Thyssen 1999). Country Surface area km >100 Austria Bulgaria Denmark Finland France(*) Germany(**) ~4 700 ~1 300 ~250 ~ 24 2 Greece >16 1 Ireland ~5 500 ~ Italy - >168 > The Netherlands >100 > Norway Portugal(***) Spain(***) Sweden Switzerland United Kingdom Notes: (*) Incl. lakes and reservoirs; (**) only natural lakes; (***) reservoirs Table 2. The number and total area of lakes in Finland in different size groups (Raatikainen and Kuusisto 1988). Lake area (km 2 ) Number of lakes % Total lake area (km 2 ) % > Total An effort was made to select among this vast number of lakes a representative population for the lake network (large, representative, reference and impact lakes) according to the guidelines presented by Nixon et al. (1998). The sites were selected among the sites of existing national, regional and statutory monitoring networks supplemented with additional sites when necessary. All 71 sites which were earlier included in the national monitoring network in were included. After discussions with the Regional Environment Centres, a total number of 253 lake sites were included in the network (Fig. 2). Of these a total of 50 sites are situated on large lakes, 105 are representative sites, 33 reference sites and 48 impact sites, and 17 are sites affected by agriculture (Table 3). In addition to these 253 lake sites there is a special monitoring programme for acidification in 162 small headwater lakes and ponds. 14 The Finnish Environment 445
17
18 Table 3. Lake sites, their number and description. Lake site N Description L 37 Deep site of a large lake basin, with a surface area over 100 km 2 and water quality typical of the area LB 11 Deep site of a large lake basin, with surface area over 100 km 2 and the major part of the catchment area (90%) in pristine condition LI 2 Impact site of a large lake basin with surface area over 100 km 2 R 105 A site of a lake basin with surface area smaller than 100 km 2 and water quality typical of the area (Representative site) B 33 Deep site in a reference lake with the majority of the catchment area (90%) in pristine condition (Reference site) I 48 Impact site in a lake affected by point source loading or regulation A 17 Deep site in a small lake affected by non-point source loading, particularly agriculture Total 253 The 253 monitoring sites are situated in a total of 216 lake basins, which cover 61% of the lake area of the country (Table 4). The largest basins are best represented in the network. The distribution of lake site types by lake basin areas is shown in Table 5. Table 4. Distribution of lake basins included in the EUROWATERNET by lake basin area and the percentage of the total lake area of the country covered by the size classes. Lake basins by area (km 2 ) > Total No. of lake basins basins Percentage of total 100% 55% 3% 0.2% 61% lake area of the size class covered Table 5. Distribution of lake site types by lake basin area. Type of lake site Number of lake basins in different size classes (km 2 ) > Total Large lake sites (L+LB+LI) Representative sites (R) Reference sites (B) Impact sites (I) Lakes affected by agriculture (A) Total number of lake sites The Finnish EUROWATERNET monitoring network for lakes presented here was put into operation at the beginning of January, Appendix 2 presents list of the lake sites and the analyses carried out. Fig. 2 shows their location on the map. Large lakes. All the 47 largest and well-known lakes (e.g. lakes Inari, Päijänne and Saimaa) of the country (area >100 km 2, Table 2) were included in the network. Several of the largest lakes, e.g. Lake Saimaa, have partly isolated, large sub-basins (area > 100 km 2 ). Five of such sub-basins of large lakes were included in the network. Therefore the network includes a total of 50 large lake sites (of these 11 are reference sites and 2 impact sites). The total area of the large lakes included is km 2. The large lakes with a reference site have a total water area of km The Finnish Environment 445
19 Representative sites. The network of representative sites should reflect the general water quality of lakes of the region in which they are located and provide an overall picture of the quality of lakes in the country. In all there are 105 representative sites in the network. Some of these are situated in large lakes, but mostly in lakes smaller than 100 km 2 by area. The total area covered by representative lakes is km 2. The proportion of lakes with a water area less than 10 km 2 is small in this network (Table 4) in comparison to their great number (Table 2). In order to obtain a representative picture of the water quality of small lakes a Finnish Lake Survey, like that carried out as part of the Nordic Lake Survey in 1995 (Henriksen et al. 1998), should be repeated e.g. every 10 years. The EUROWATERNET guidelines recommend that the most important lakes should be included in the network. The importance of a lake is a very relative question. One criterion of importance could be that the lake is an object of a research project or other environmental study. An example of an important lake as understood in this manner is Lake Pyhäjärvi, a mesotrophic lake situated in south-western Finland in an agricultural area and famous of its large fish stocks. Another example is Lake Tuusulanjärvi situated close to Helsinki, a eutrophic lake which for a long period received treated domestic wastewater. Although waste waters were diverted at the end of the 1970s, due to non-point loading and internal loading the lake is still eutrophic. The third example is Lake Pääjärvi near the town of Lahti, some 100 kilometres north of Helsinki, a lake investigated for decades by the University of Helsinki. All these three lakes were included in the network. Reference sites. A reference site should be situated in a lake basin with no or only little human impact and having more than 90% of natural landscape. Altogether 44 sites, with a total area of km 2, were selected to the lake network according to this criterion. The reference sites selected include both small lakes (33 sites) and sites situated in unpolluted areas of large lakes (11 sites). Most of the lakes which need particular protection (Ministry of the Environment 1992) were included in this network. The NATURA 2000 programme includes some water areas of particular importance. Some of these were included as reference sites. The monitoring of these NATURA 2000 areas and sites included in this network should be coordinated in the future. Some lakes included in the integrated monitoring and acidification programmes were included in the lake network to represent small lakes. Impact sites. Impact sites were selected from the network of local pollution control, which includes a total of about lake sites. Finnish lakes are mainly polluted by agriculture, the pulp and paper industry, municipal waste waters, diffuse loading and fish farming. In recent decades and particularly during the past few years the wastewater loads discharged to surface waters from the pulp and paper industry have decreased. However, this industrial sector still considerably reduces the quality of inland waters. Therefore, of the total number of impacted lake sites (49), a relatively high number (19) is situated near pulp and paper mills. In Finland, waste waters are commonly discharged to lakes, particularly to large lakes with good mixing conditions. Therefore, many of the impact sites are located in lakes where the main basin can, with good reason, be in reference condition or represent the typical water quality of that area. The impacted area usually forms only an isolated part of the lake basin. The EUROWATERNET lake network includes 17 lakes that were especially selected for monitoring of the effects of agriculture. These lakes are small and they are situated in river basins where the percentage of fields is high or animal husbandry is intensive. Such lakes are typically found in south-western Finland, The Finnish Environment
20 but occasionally also in other areas. In the future the land use of these 17 river basins should also be surveyed. There is a special monitoring network for acidification, which includes 162 sites spread all over the country. There is evidence that in recent years the acidification problem has somewhat decreased and this network may therefore be revised in the near future (Mannio and Vuorenmaa 1995). Reservoirs. The total number of reservoirs and man-made lakes is relatively low in Finland. Usually reservoirs have been built for hydro power production and for preventing floods. In addition, some smaller reservoirs have been constructed particularly for water abstraction and recreation. The two largest reservoirs in the country, with maximum areas of 417 km 2 and 214 km 2, are situated in northern Finland (Table 6). In the western coastal area, about 20 small reservoirs with surface areas from 1 to 28 km 2 have been constructed. High concentrations of humic substances, oxygen deficiency and high mercury concentrations in fish have been the main water quality problems of reservoirs, particularly in recently constructed reservoirs. The two largest reservoirs in the north (Lokka and Porttipahta) and three in Ostrobothnia in western Finland (Uljua, Kalajärvi and Venetjärvi) were included in the lake network. Table 6. Reservoirs included in the lake monitoring network. Reservoir Site type Area (km 2 ) 1) Max interval of Year of Percentage of peatbog Min Max regulation (m) 1) impoundment 2) under the water surface 2) Lokka L Porttipahta L Uljua I Kalajärvi I Venetjärvi I ) Finnish Environment Institute, Hydrology and Water Management Division 2) Verta et al. (1986) Sampling frequency and analyses. The EUROWATERNET lake network is a collection of sampling sites belonging to diverse monitoring programmes designed according to national or international objectives or requirements of local pollution control. Therefore, the sampling frequency and analyses carried out vary by site. Analyses are divided into groups A E shown in Appendix 2. Sites of the national programme Monitoring of water quality in lake deeps operated in The sites: All the 71 sites of this earlier network were included in The EUROWA- TERNET. Of these, 15 sites are monitored more intensively for physical and chemical variables and phytoplankton Sampling depths: Samples are taken from the surface (1m), from 5 m depth, mean depth (x), and one metre above the bottom (2x-1). During the autumn turnover samples are taken only from the mean depth. Secchi disk depth is a routine measurement in sampling. Thermocline and oxygen condition are determined by measuring temperature and oxygen concentration at depth intervals of 5 metres. Phytoplankton, chlorophyll a and some supporting physical and chemical variables are analysed from the surface layer (0 2 m). 18 The Finnish Environment 445
21 Sampling frequency and analyses: Water quality is monitored three times a year mostly for four groups of analyses (shown below and in Appendix 2). (i) At the end of winter stagnation (March 15 31) the samples are analysed for groups ABC. In addition, four sites are analysed for group E (selenium) and 15 intensive sites for dissolved PO 4 -P (group F). (ii) At the end of summer stratification (August 15 31) the samples are analysed for groups ABDG. In addition, four sites are analysed for group E (selenium). (iii) During the autumn circulation (October 1 15) the samples are analysed for groups ABC. In addition four sites are analysed for group E (selenium). The groups of analyses include the following variables (See also Appendix 2): Group of analyses Variables A temperature, oxygen B nutrients, colour, ph, Fe, Mn, turbidity, conductivity, alkalinity, CL, SO 4, COD Mn C Al, K, Ca, Mg, Na, TOC, SiO 2 D chlorophyll a E Se F dissolved PO 4 -P G absorbance, suspended solids, residual (for purposes of remote sensing) H other (for purposes of Fishwater directive) Table 7. Lake sites with a monitoring programme with some differences to other national sites. Lake No. of Lake site Site type Winter Summer Autumn river basin Pyhäjärvi Pyhäjärvi, syvänne 88 R ABCE ABDEG ABCE Pyhäjärvi Pyhäjärvi 93 VA93 L ABCE ABDEG ABCE Yli-Kitka Yli-Kitka, syvänne LB ABCE ABCDEG ABCE Inari Inarijärvi Vasikkas 151 LB ABCE ABCDEG ABCE GEMS sites (Global Environment Monitoring System) There are two lake sites belonging to the GEMS monitoring programme: Yli-Kitka and Inari. Water quality data of these sites are regularly sent to Canada (UNEP and WHO GEMS/Water Collaborating Centre, National Water Research Institute, Environment Canada, Burlington), where they are analysed and reported with corresponding data from other countries. The two sites are sampled basically similarly to the sites that belonged to the earlier national monitoring network operated in described above. Only some additional analyses are performed (Table 7). Monitoring sites of the Fishwater Directive (78/659 EU). This monitoring was commenced at the beginning of January, The sites: Altogether 18 sites in the EUROWATERNET lake network are monitored taking into account the requirements of the Fishwater Directive (Table 8). The Finnish Environment
22 Table 8. Lake sites monitored according to the requirements of the Fishwater Directive. Lake No. of river basin Lake site Site type Lohjanjärvi Lohjanj. Isoselkä 91 B Pyhäjärvi Pyhäjärvi 93 Va93 L Saimaa Saimaa Ilkonselkä 021:46 B Saimaa Saimaa Haukiselkä 017 I Haukivesi Heposelkä 35 B Haukivesi Siitinselkä 134 I Kallavesi Kallavesi 25 L Kallavesi Kallavesi 350 I Pielinen Pielinen 62 Törökari I Pielinen Pielinen 7 Kalkkusaari LR Pyhäselkä Pyhäselkä 5 Kokonluoto LR Lappajärvi Lappajärvi Etelä P 125 L Central Päijänne Päijänne 657 I Northern Päijänne Päijänne 69 I Central Päijänne Päijänne 71 L Oulujärvi Paltaselkä 138 I Vanajavesi Vanaja 42 Kärjenniemi I Vanajavesi Vanajanse 98 L Sampling frequency and analyses: The sites are sampled monthly and analysed for variables according to the requirements of the directive, namely: (i) The following variables are analysed monthly: temperature, dissolved oxygen, ph, petroleum hydrocarbons, non-ionized ammonia, total ammonium, total residual chlorine (HOCl), and total zinc. (ii) The following variables are analysed at least twice a year at the end of stagnation periods: suspended solids, BOD 7, total phosphorus, nitrites, phenolic compounds, and dissolved copper. Sampling depths are not mentioned in the directive. Samples are taken from the surface (1m) and from 1m above the bottom. Thermocline and oxygen conditions are determined by measuring temperature and oxygen concentrations in every 5 metres. In deep lakes intermediate samples below thermocline are taken every 10 metres. Impact sites The sites: Impact sites were selected among the sites belonging to local pollution monitoring programmes. Therefore the analyses carried out vary by site according to the programme. Sampling frequency and analyses: Variables measured practically every time are Secchi disk depth, dissolved oxygen, total phosphorus, total nitrogen, ph, conductivity, colour, turbidity and suspended solids. COD Mn and chlorophyll a are generally measured. Variables such as alkalinity, acidity, dissolved nutrients, metals, mercury, dry matter and fixed residue are measured only occasionally. Seldom measured variables are BOD 7, AOX, TOC, oils, sulphate, chloride, sodium and very rarely measured variables are total sulphur, phenols, resins, and PCB. The frequency of sampling is at least four times per year, during stratification and turnover periods. 20 The Finnish Environment 445
23 Lake sites affected by agriculture The sites: A total of 17 lake sites under the influence of agriculture were included in the lake network (Table 9, marked with A in Appendix 2). The sites represent lakes affected mainly by diffuse loading due to agriculture. One lake, however, is affected mainly by animal husbandry (L. Ullavanjärvi) and another by forestry (L. Kalliojärvi). Most sites have total phosphorus data since Table 9. Lakes affected by non-point loading, mainly agriculture. Lake No. of river Lake area Area of river Percentage of basin (ha) basin (km 2 ) fields (%) Pusulanjärvi Tiiläänjärvi Karhijärvi Kirkkojärvi (Rymättylä) Ylisjärvi Rehtijärvi (Loimijoki) Kalliojärvi Mäyhäjärvi Sääksjärvi Valvatus Kirmanjärvi Keskimmäinen-Sulkama Ullavanjärvi Ahveninen Juoksjärvi Ahmasjärvi Sotkamojärvi Sampling frequency and analyses: Sampling was planned in order to obtain a time series of water quality from the deepest point of the lake. Four samples are taken annually, one at the end of winter stratification (March April) and three samples during the summer from June to September (one in April, one in June August and one in August September). Temperature is measured every 1 or 3 metres. Secchi disk depth is measured regularly. The following variables are analysed from the surface (1m) and one metre above the bottom: oxygen, oxygen saturation, ph, conductivity, turbidity, suspended solids, total phosphorus, filtered phosphate-phosphorus, total nitrogen, nitrite+nitrate-nitrogen and ammonium nitrogen. Filtration is carried out using 0.4 µm Nuclepore-filter. In addition the occurrence of algae is estimated using a relative classification system: 0 = algae not found, 1 = algae observed, 2 = dense occurrence of algae and 3 = very dense occurrence of algae. Algal samples are taken to be analysed in the laboratory. Other sites A total of 14 sites included in the EUROWATERNET lake network also belong to a monitoring network of acidification, which includes a total of 162 sites. The sites are monitored once a year at the autumn turnover. In addition, four sites are monitored 6 times per year (Mannio and Vuorenmaa 1995). The Finnish Environment
24 Sites from regional networks are basically monitored similarly to the 71 sites of the national monitoring network operated in , namely (i) at the end of winter stratification (March 15 31) water samples are analysed for the groups ABC, (ii) at the end of summer stratification (August 15 31) for the groups ABD and (iii) during the autumn circulation (October 1 15) for the groups ABC (Appendix 2). A few sites are monitored more intensively. Biological monitoring Phytoplankton is analysed using rotation in sampling the 253 sites in the EURO- WATERNET lake network. Every year about 90 sites are analysed for phytoplankton in July. With this method in three years time all the lake sites will be analysed once for phytoplankton. In addition, 15 sites are monitored six times in May August every year for phytoplankton and once in autumn every year for bottom fauna. Some sampling sites have also biological monitoring, which is included in programmes of local pollution control (Appendix 2). 2.3 Surface water quantity Hydrometric networks and practices are used for the production of the required discharge and water level (water balance) data for the sites at which surface water quality is measured. The national hydrometric network, coordinated by FEI, is the primary monitoring system that is composed of some 400 stations. The regional and sectoral hydrometric networks form another system for the production of water level and discharge data. The former are coordinated by the Regional Environmental Centres and the latter are financed and maintained by different sectors of the water industry. The total number of regional and sectoral hydrometric stations is rather high, some If the above options do not cover the selected sampling sites, there are two additional possibilities for the collection of hydrometric data; (i) the national hydrological modelling system which can be used for the estimation of river discharge in any main and sub catchment (current coverage is 90% of the country) or (ii) temporary water level measurements can be carried out in those lakes which do not have other monitoring arrangements. The hydrological sub-network of baseline stations (used for the spatial estimation of run-off) is composed of 74 stations (Appendix 3). Information of a further 25 stations with a natural, small catchment can be integrated with the data produced by the baseline stations. 2.4 Current groundwater network Groundwater network. Groundwater serves as a major source of public water supply in Finland. The monitoring of groundwater quality is part of a national program to prevent, reduce and eliminate groundwater pollution. At Finnish groundwater stations the observations represent the whole recharge area of groundwater. Consequently, the variables of hydrogeological quality and quantity can be calculated from the balances of water and materials. The Finnish groundwater monitoring network presented here is identical with the present groundwater monitoring network founded in It includes 53 observation stations in different geologic, topographic and climatic conditions (Table 10). The stations produce data concerning natural variation in the quantity and quality of 22 The Finnish Environment 445
25 groundwater and factors affecting this variation. The areal size of the stations varies from 0.2 to 3.0 km 2. This network will form the basis when the Finnish EUROWATERNET groundwater network is developed in the future. The groundwater stations are built on different Quaternary soil-type regions. The areas are classified on the basis of land use and vegetation. The structure and stratification of the soil is investigated in conjunction with the fitting of the groundwater observation tubes by profile drilling. The main directions of groundwater flow in the different areas are estimated with the aid of surface topography formations and by measuring the groundwater level. The main objective of groundwater monitoring is to produce reliable and comprehensive information on groundwater resources and quality. This information can be used as a basis for decisions on environmental issues, with the following additional goals: (i) estimation of temporal and spatial fluxes in the quantity and quality of groundwater under various hydrological and climatic conditions, (ii) estimation of the effects of human activities on the quantity and quality of groundwater, (iii) long-term estimation and predictions of changes in groundwater, and (iv) production of geohydrological information for legislative and research purposes and for the protection and use of water. Continuous monitoring and long-term data series are essential for the estimation and prediction of slow environmental changes, e.g. acidification and climate change. The Finnish monitoring network produces several types of data, e.g. information about groundwater level and quality, precipitation, water equivalence and quality of snow, soil moisture, frost, amount of soil water evaporation and surface runoff. The quantity and quality of infiltration water are monitored by 33 lysimeters. Percolation water samples are taken from trenches in three different podzol layers at seven stations every spring and autumn. The groundwater observation stations are background stations located in areas in almost pristine state, where the groundwater quality has not been remarkably affected by local environmental disturbances. Textural and geological grouping of the areas is carried out on the basis of geotechnical soil type classification. The relative dominances of different types of bedrock were estimated with the aid of available bedrock maps. The soil and bedrock classifications of groundwater stations are presented in Table 10. In addition to the groundwater monitoring network, there are some groundwater intakes, where groundwater quality and quantity are monitored by local waterworks. Groundwater quality. Groundwater samples are taken from the permanent observation stations either from springs or PVC sampling tubes fixed in the soil (see Appendix 3). In order to monitor seasonal changes and to facilitate the comparison of results from different sites, samples are taken regularly during every second month from a fixed depth and using the same standardized sampling procedure. Groundwater samples are taken from 44 springs or tubes and the following analyses are performed: ph, alkalinity, electrical conductivity, nitrate-, ammonium- and total nitrogen, phosphate phosphorus, Cl, SO 4, Mn, Na, K, Ca, Mg, Cu, Ni, Zn, Hg, Pb, Cd, Al, SiO 2 and F. Groundwater quantity. Changes in the level of groundwater reflect the balance between its recharge and discharge. The groundwater level observation tubes are distributed systematically over the 53 groundwater stations to study the areal variation (see Appendix 4). Manual measurements of groundwater level are made at 530 groundwater tubes twice a month. In addition groundwater level is continuously recorded in the permanent groundwater stations. Data measured by 50 automatic recorders are used for determining accurately the time of snowmelt. The Finnish Environment
26 Table 10. Characteristics of the groundwater stations. Groundwater Location Mean altitude Soil type Rock type Land use station Lat. Long. m a.s.l. Siuntio clay granite cultivated land Karkkila gravel granite forest, cultivated land Orimattila silt granite forest, peat land Tullinkangas sand mica gneiss forest Jomala till granite forest, cultivated land Perniö gravel granite forest Oripää gravel granodiorite forest Kuuminainen till sandstone forest Orivesi till porphyry rocks forest Jämijärvi sand granodiorite forest Siikainen till mica gneiss forest, peat land Elimäki till granite forest, peat land Valkeala sand granite forest, peat land Kotaniemi till granodiorite forest Parikkala sand mica gneiss forest Pertunmaa silt veined gneiss forest Pistohiekka sand veined gneiss forest Naakkima till mica schist forest Heinävesi till mica schist forest, peat land Talluskylä sand mica schist forest Viinikkala till diorite forest Kangaslahti sand veined gneiss forest Akonjoki v till granite forest, peat land Kuuksenvaara sand quartz diorite forest Jaamankangas sand mica schist forest Jakokoski gravel granodiorite forest Juutilankangas silt granite forest, cultivated land Rajamäki sand granite forest Taipale till granodiorite forest Laihia clay amphibolite cultivated land, forest Lummukka sand mica schist peat land, forest Mutkala till granodiorite forest Vehkoo sand granite forest Äijälä sand granite forest, cultivated land Taikkomäki till granite forest Halsua sand granodiorite forest Haapajärvi till agglomerate forest Kälviä clay granite cultivated land, forest Kalajoki silt granite forest Pyhäntä sand granite forest Ruukki sand mica gneiss forest Pudasjärvi till granite forest, peat land Kuusamo till mica gneiss forest, peat land Kolmisoppi till granite forest Lumiaho till granite forest Alakangas sand granite forest Kullisuo till granite forest Könölä till mica schist forest Lautavaara sand granite forest Vallovaara till granodiorite forest, peat land Sodankylä sand mica schist forest Muonio sand granodiorite forest Nellim till granite forest 24 The Finnish Environment 445
27 Information about Finnish fresh waters Water resources Finland is a relatively flat northern country with a humid climate. It is situated between 60 and 70 degrees of latitude, being about km in length and having an area of km 2. With a population of five million inhabitants it is sparsely populated, the mean population density being only 16 inhabitants per square kilometre. The population density is highest in the southern part of the country (133 inhabitants km -2 ) and lowest in the northernmost province (2.2 inhabitants km -2 ). Due to its northern location, climatological variations are high and the freezing and break-up of ice on rivers and lakes varies considerably. As much as 30 40% of the annual total of m 3 of water discharged into the sea takes place during the spring thaw. The average rainfall in the country in was 660 mm a -1, of which 341 mm a -1 evaporates resulting in a runoff of 318 mm a -1 (Hyvärinen et al. 1995). The country is divided into 74 main drainage basins (Ekholm 1993). Water resources are abundant in terms of surface area. Inland waters cover some km 2 (about 10% of the total area of the country). A survey showed that the number of lakes and ponds exceeding 500 m 2 (0.05 hectares) totalled Of these about have an area greater than m 2 (0.01 km 2 ) and about have an area greater than 1.0 km 2 (Raatikainen and Kuusisto 1988), see Table 2 in Section 2.2. Lakes are typically shallow, with an average depth of about 7 m and they often form lake chains. The lakes in such chains are interconnected by straits that can occasionally be rapidly flowing and may to a great extent resemble rivers. The majority of large lakes are in the central part of the country. The total volume of lakes, about 235 km 3, is relatively small in comparison to their large area. The detention time of lakes is relatively short, being on average about two years. The deepest lakes, with a maximum depth of m, are Lakes Saimaa, Päijänne, Pääjärvi and Inarinjärvi. The number of rivers is comparatively small. It has been calculated that there are 647 rivers with a catchment area of over 100 km 2 and with at least 10 km of channel uninterrupted by lakes. The total length of these rivers is about km. The distribution of these 647 rivers by drainage basin area is: Number of rivers Drainage basin (km 2 ) 12 > If rivers with smaller drainage basins were included in the calculation this number would be considerably larger. Discharges of rivers vary widely, being highest during the spring thaw. The majority of rivers are in the coastal areas discharging into the Baltic Sea, either into the Gulf of Finland or into the Gulf of Bothnia. Lakes are less abundant in the coastal areas than in other parts of the country The Finnish Environment
28 and in these areas rivers are, therefore, more frequently used as raw water sources and are appreciated for recreational activities such as swimming, fishing and water sports. On average the abstraction of total renewable freshwater resources in Europe is 15%, but in Finland only 2.2%.This shows that Finnish groundwater resources are relatively abundant in comparison to their use. According to the present classification there are about groundwater areas suitable for drinking water purposes. However, the daily use of groundwater is presently only 0.7 million cubic metres or 59% of the water distributed by waterworks. It is estimated that by the year 2010 this percentage will increase to 70%. A volume of about 5.8 million cubic metres per day could be abstracted from the Finnish groundwaters. Regulation of lakes has an important role in the management of water resources. About km 2 or 45% of the lake area is regulated. The main purposes of regulation are hydro power production and flood protection, but water transport, water supply and recreational uses are also important. In addition regulation is often used as a means for restoration of small lakes. 3.2 Water pollution Forest industry wastewater. In the 1980s and particularly since 1985 when the first biological wastewater treatment plants were constructed, the wastewater load of the forest industry started to decrease. During the past decade the wastewater loads of forest industries have further decreased. The use of elementary chlorine in bleaching processes ended in the early 1990s, which dramatically decreased the load of organochlorine compounds. However, the forest industry is still a significant polluter of Finnish surface waters, although in significantly smaller scale than earlier. In 1999 the total annual load from the pulp and paper industry was: total suspended solids tonnes, biological oxygen demand (BOD 7 ) tonnes, chemical oxygen demand (COD Cr ) tonnes, organic chloride compounds (AOX) 0.19 kg per ton produced pulp, phosphorus 225 tonnes and nitrogen tonnes (http// Earlier figures are presented e.g. by Finnish Forest Industries Federation (1997). Municipal wastewater. Since 1970 the environmental protection policies concerning water pollution from urban areas have developed favourably. The municipal discharges of organic matter and phosphorus decreased sharply during the 1970s and this decrease has continued. In 1998 municipal wastewater treatment served about 80% of the population. Effective wastewater treatment dramatically decreases the input of nutrients discharged to waters by municipal wastewater. Information stored in the data banks of the Finnish Environment Institute show that in the beginning of the 1970s ( ) the BOD 7 load from municipalities after treatment varied between and tonnes per year, whereas in 1999 it was only tonnes per year. In the beginning of the 1970s ( ) the phosphorus load from municipalities after treatment was about tonnes per year and in 1999 only 259 tonnes per year. In 1999 the reduction of BOD 7 load was 94.4% and that of phosphorus 93.1% ( vesi/kuormit/yhdyskun/orgkuot.htm and yhdyskun/foskuot.htm). Fish-farming. Some 400 fish farms were in operation in Finland in the 1990s. They produced annually some tonnes of rainbow trout for human consumption. About two thirds of the fish farms are net cage installations located mainly in coastal waters of the Baltic Sea. Only a minor proportion of fish 26 The Finnish Environment 445
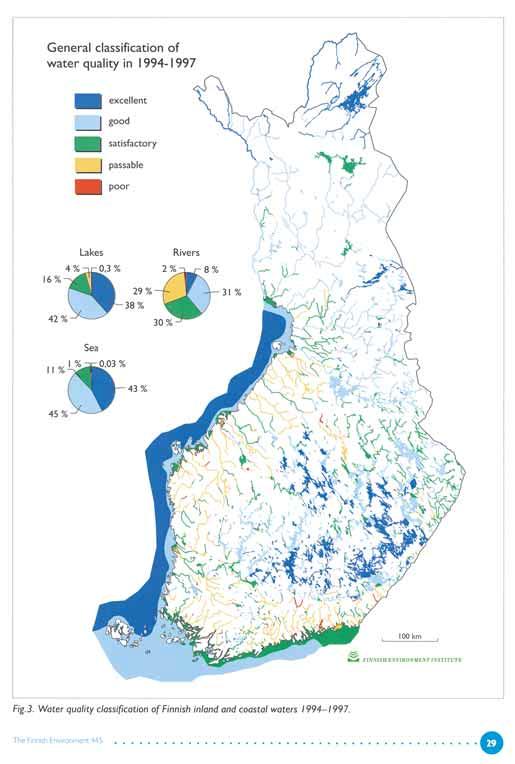
29 farms are land basin installations located in inland waters. Fish-farming damages mainly the water quality of coastal waters, particularly in the south-western part of the country, and locally may also cause quality deterioration in inland waters. Agriculture. Agriculture involves manipulation of soil, water and other natural resources and has significant effects on the environment. In Finland the percentage of agricultural land is 9% of the total land area. In many comparatively large drainage basins, however, it can exceed 30%. In these areas, particularly in south-western Finland, agriculture is a significant source of pollution. Eutrophication of surface waters is the major environmental problem caused by agriculture. Phosphorus and nitrogen losses from agricultural land exceed those of industrial and municipal loads summed together (Rekolainen et al.1992). Particularly during recent decades the proportion of agriculture as a source of phosphorus has increased as the purification of municipal and industrial wastewater has become more effective. Much attention has therefore been paid to policies for reducing loading from non-point sources. Rekolainen (1993), Rekolainen et al. (1997) and Ekholm (1998) studied the effects of agriculture on water pollution in Finland. Because agricultural fields and groundwater aquifers are located in different soil types, agriculture has only minor effects on the nitrogen concentration of groundwater. In 1996 the median value of nitrate concentration in Finnish waterworks was 1 mg l -1 (Kujala-Räty et al. 1998). Only in private wells of sparsely populated areas are higher concentrations occasionally found due to the poor quality of wells and their contamination by runoff. Silviculture and drainage of peatbogs. About 78% of Finland is covered by forests. The drainage basins of lakes and rivers are therefore dominated by forested land. Forests greatly influence the hydrology and the chemical characteristics of streams, lakes and groundwater. Forestry practices such as cutting, drainage, fertilization and preparing of regeneration areas (harrowing, ploughing) affect the hydrology and material balances of the soil, with subsequent effects on water bodies. The percentage of peatbog is high in Finland, being about 30% of the country s area. The drainage of peatbog for silvicultural purposes was initiated in the nineteenth century, when ditches were dug and brooks were cleaned in order to dry waterlogged lands and improve forest growth. Mechanization of drainage, beginning with the blasting of ditches and ploughing in the mid 1950s with significant state subsidies, significantly increased the drainage activities in the 1960s and 1970s. As a result, more than 6 million hectares of peatbog were drained, which is more than 20% of the total area of forested land in Finland. These measures have substantially changed the hydrology, biology and water quality of streams in many parts of the country. The effects of silviculture on the quality of inland waters were studied e.g. by Saukkonen and Kenttämies (1995), Lepistö (1996) and Kenttämies (1998). 3.3 Surface water quality Regional surface water quality. Because of the relatively cold climate and prevalent pre-cambrian bedrock, the rate of weathering is slow and, therefore, the concentrations of inorganic substances in surface waters are low. By contrast, the concentrations of dissolved organic substances, e.g. humic acids can locally be high, because peaty soils cover about 30% of the area of the country. The shallowness of lakes and low discharge of rivers together with a period of several months of ice cover tend to make the inland waters sensitive to pollution. Gener- The Finnish Environment
30 ally speaking, the water quality of Finnish inland waters improves from south to north and from west to east, being poorest in the coastal areas in the south, southwest and west (Laaksonen 1970, Laaksonen and Malin 1985, Niemi 1998, Niemi et al. 1997, Niemi and Niemi 2000). The waters of Finnish lakes and rivers are mainly soft and often humic. Although the country is relatively sparsely populated, the surface waters are affected by different human activities and their consequences (Bernes 1993, Wahlström et al. 1994). Water quality classification. The general quality of Finnish inland waters is shown in a water quality classification carried out on the basis of data of about observation sites from (Fig. 3, Antikainen et al. 1999, 2000). The waters were classified into five classes on the basis of oxygen content, colour, turbidity, nutrients, hygienic indicator bacteria, chlorophyll a, algal blooms and toxic compounds (Heinonen and Herve 1987, National Board of Waters and the Environment 1988). The classification covered 79% of the total lake area (lakes over 1 km 2 ) and 14% of total river length (rivers more than 2 m by width) and nearly 100% of coastal waters (Antikainen et al. 2000). The map gives an overall picture of water quality and the suitability of waters for different uses, e.g. for water supply, fishing and recreational activities. The most affected lakes were close to the centres of population and were typically eutrophic. The quality of waters under the influence of wastewater improved since the 1980s, whereas that of waters under the influence of agriculture deteriorated. Rivers were typically more polluted than lakes. A comparison to the previous classification made with the data of (Vuoristo and Antikainen 1997, Vuoristo 1998) shows that of the classified lake area 8% improved and 4% decreased in quality. Of the classified river length 13% improved and 6% decreased in quality (Antikainen et al. 2000). There are several potential threats to water quality. Most of these are the same factors that are threatening water quality in other industrialized countries. Eutrophication is one of the greatest threats to the Finnish aquatic ecosystem. Eutrophication of inland waters has been monitored e.g. by phytoplankton studies since 1963 (Heinonen 1980, Mannio and Vuorenmaa 1995, 1996, Lepistö 1999, Mannio et al. 2000). Acidification from airborne pollution is evident, although not as severe as in Sweden or Norway. There are some signs that the effects of airborne acidification on surface waters have recently decreased in Finland. Results of acidification research in Finland were presented e.g by Kauppi et al. (1990), Mannio and Vuorenmaa (1995, 1996) and Henriksen et al. (1998). Heavy metals. Tarvainen et al. (1997) studied the distributions of heavy metals (Mn, Zn, Cu, Ni, Cr, Pb, As, and Cd) in Finnish surface waters. Their results showed that the anthropogenic atmospheric pollution of natural waters was more clearly seen in the increase of Cd, As, Cr, Zn, and Ni concentrations than in Cu, Mn, and Pb concentrations, and more clearly in the waters of small headwater lakes than in streams. Human influence was not apparent, although the headwater lakes studied had a high ratio of lake area to catchment size. Other studies of heavy metals in the Finnish environment have been published by e.g. Mannio et al. (1993, 1995) and Verta (1990). Organic chlorocompounds originating mainly from the pulp and paper industry have been monitored since 1984 by the mussel incubation method (Herve 1991). A significant decrease of all chlorophenols in all investigated recipients of the pulp and paper industry was observed. However, the situation with regard to PCB is less positive (Herve et al. 2001). Korhonen et al. (1995) investigated PCP in aquatic indicator specimens in Finland and Korhonen et al. (1998) studied bulk deposition of PAH, PCB and HCH in Finland in The Finnish Environment 445
31
Toimintamallit happamuuden ennakoimiseksi ja riskien hallitsemiseksi turvetuotantoalueilla (Sulfa II)
") Toimintamallit happamuuden ennakoimiseksi ja riskien hallitsemiseksi turvetuotantoalueilla (Sulfa II) Happamuuskuormituksen ennustaminen valuma-aluetasolla Marie Korppoo ja Markus Huttunen 13.5.2019 Päämäärä
Toimintamallit happamuuden ennakoimiseksi ja riskien hallitsemiseksi turvetuotantoalueilla (Sulfa II) Happamuuskuormituksen ennustaminen valuma-aluetasolla Marie Korppoo ja Markus Huttunen 13.5.2019 Päämäärä
Efficiency change over time
 Efficiency change over time Heikki Tikanmäki Optimointiopin seminaari 14.11.2007 Contents Introduction (11.1) Window analysis (11.2) Example, application, analysis Malmquist index (11.3) Dealing with panel
Accommodation statistics
 Transport and Tourism 2011 Accommodation statistics 2011, January Nights spent by foreign tourists in Finland increased by per cent in January The number of recorded nights spent by foreign tourists at
Capacity Utilization
 Capacity Utilization Tim Schöneberg 28th November Agenda Introduction Fixed and variable input ressources Technical capacity utilization Price based capacity utilization measure Long run and short run
Accommodation statistics
 Transport and Tourism 2013 Accommodation statistics 2013, July Nights spent by foreign tourists in Finland up by 1.9 per cent in July 2013 The number of recorded nights spent by foreign tourists at Finnish
Fighting diffuse nutrient load: Multifunctional water management concept in natural reed beds
 PhD Anne Hemmi 14.2.2013 RRR 2013 Conference in Greifswald, Germany Fighting diffuse nutrient load: Multifunctional water management concept in natural reed beds Eutrophication in surface waters High nutrient
Accommodation statistics
 Transport and Tourism 201 Accommodation statistics 201, May Nights spent by foreign tourists in Finland up by 11 per cent in May 201 Overnight stays by foreign tourists continued increasing at Finnish
The BaltCICA Project Climate Change: Impacts, Costs and Adaptation in the Baltic Sea Region
 The BaltCICA Project Climate Change: Impacts, Costs and Adaptation in the Baltic Sea Region The BaltCICA Project is designed to focus on the most imminent problems that climate change is likely to cause
Skene. Games Refueled. Muokkaa perustyyl. napsautt. @Games for Health, Kuopio. 2013 kari.korhonen@tekes.fi. www.tekes.fi/skene
 Skene Muokkaa perustyyl. Games Refueled napsautt. @Games for Health, Kuopio Muokkaa alaotsikon perustyyliä napsautt. 2013 kari.korhonen@tekes.fi www.tekes.fi/skene 10.9.201 3 Muokkaa Skene boosts perustyyl.
Accommodation statistics
 Transport and Tourism 2014 Accommodation statistics 2013, December Nights spent by foreign tourists in Finland up by 5.5 per cent in December 2013 The number of recorded nights spent by foreign tourists
Accommodation statistics
 Transport and Tourism 2013 Accommodation statistics 2012, December Nights spent by foreign tourists in Finland up by 45 per cent in December 2012 The number of recorded nights spent by foreign tourists
Social and Regional Economic Impacts of Use of Bioenergy and Energy Wood Harvesting in Suomussalmi
 Social and Regional Economic Impacts of Use of Bioenergy and Energy Wood Harvesting in Suomussalmi Green Cities and Settlements 18.2.2014 Ville Manninen Writers Project group Sirpa Korhonen, Anna Mari
Results on the new polydrug use questions in the Finnish TDI data
 Results on the new polydrug use questions in the Finnish TDI data Multi-drug use, polydrug use and problematic polydrug use Martta Forsell, Finnish Focal Point 28/09/2015 Martta Forsell 1 28/09/2015 Esityksen
Other approaches to restrict multipliers
 Other approaches to restrict multipliers Heikki Tikanmäki Optimointiopin seminaari 10.10.2007 Contents Short revision (6.2) Another Assurance Region Model (6.3) Cone-Ratio Method (6.4) An Application of
Accommodation statistics
 Transport and Tourism 2015 Accommodation statistics 2015, October Overnight stays at accommodation establishments increased by per cent in October The total number of overnight stays at Finnish accommodation
Accommodation statistics
 Transport and Tourism 2014 Accommodation statistics 2014, October Nights spent by foreign tourists in Finland decreased by 1. per cent in October The number of recorded nights spent by foreign tourists
The CCR Model and Production Correspondence
 The CCR Model and Production Correspondence Tim Schöneberg The 19th of September Agenda Introduction Definitions Production Possiblity Set CCR Model and the Dual Problem Input excesses and output shortfalls
Re-use of Surplus Foundry Sand by Composting (LIFE13 ENV/FI/000285)
") Re-use of Surplus Foundry Sand by Composting (LIFE13 ENV/FI/000285) Duration of project: 01 August 2014 30 September 2017 Total budget: 2,051.644 EU contribution: 996,070 Life 2014 infoseminaari ja työpaja
Re-use of Surplus Foundry Sand by Composting (LIFE13 ENV/FI/000285) Duration of project: 01 August 2014 30 September 2017 Total budget: 2,051.644 EU contribution: 996,070 Life 2014 infoseminaari ja työpaja
Accommodation statistics
 Transport and Tourism 2013 Accommodation statistics 2013, February Nights spent by foreign tourists in Finland down by 2.5 per cent in February 2013 The number of recorded nights spent by foreign tourists
Gap-filling methods for CH 4 data
 Gap-filling methods for CH 4 data Sigrid Dengel University of Helsinki Outline - Ecosystems known for CH 4 emissions; - Why is gap-filling of CH 4 data not as easy and straight forward as CO 2 ; - Gap-filling
LYTH-CONS CONSISTENCY TRANSMITTER
 LYTH-CONS CONSISTENCY TRANSMITTER LYTH-INSTRUMENT OY has generate new consistency transmitter with blade-system to meet high technical requirements in Pulp&Paper industries. Insurmountable advantages are
Accommodation statistics
 Transport and Tourism 2015 Accommodation statistics 2015, September Nights spent by foreign tourists in Finland up by 5.0 per cent in September The number of recorded nights spent by foreign tourists at
Increase of opioid use in Finland when is there enough key indicator data to state a trend?
 Increase of opioid use in Finland when is there enough key indicator data to state a trend? Martta Forsell, Finnish Focal Point 28.9.2015 Esityksen nimi / Tekijä 1 Martta Forsell Master of Social Sciences
Innovative and responsible public procurement Urban Agenda kumppanuusryhmä. public-procurement
 Innovative and responsible public procurement Urban Agenda kumppanuusryhmä https://ec.europa.eu/futurium/en/ public-procurement Julkiset hankinnat liittyvät moneen Konsortio Lähtökohdat ja tavoitteet Every
Tutkimuslääkkeiden GMP. Fimea Pirjo Hänninen
 Tutkimuslääkkeiden GMP Fimea 17.1.2017 Pirjo Hänninen Kliinisiä lääketutkimuksia koskeva EU:n asetus Regulation (EU) No 536/2014 Hyväksytty 16.4.2014 (voimaan 28.5. 2016) Kumoaa nykyisen lääketutkimusdirektiivin
Arcticfood fromfinland
 Arcticfood fromfinland Rakennetaan arktisuudesta suomalais ruualle yhdessä tarina, joka tunnetaan maailmalla! Arktisuus elintarvikeviennin kärkenä -sem 25.10.2018 Eeva Heikkilä, Ruokatieto Taustaselvityksestä
Accommodation statistics
 Transport and Tourism 201 Accommodation statistics 201, July Nights spent by resident tourists increased by 3.7 per cent in July 201 Overnight stays by resident tourists increased by 3.7 per cent in July
Overview on Finnish Rural network and its objectives. Rural Network Unit, Finland
 Overview on Finnish Rural network and its objectives Rural Network Unit, Finland Sivu 1 26.5.2009 Rural Network in Finland consist of all actors under - the Rural Development Programme for Mainland of
On instrument costs in decentralized macroeconomic decision making (Helsingin Kauppakorkeakoulun julkaisuja ; D-31)
") On instrument costs in decentralized macroeconomic decision making (Helsingin Kauppakorkeakoulun julkaisuja ; D-31) Juha Kahkonen Click here if your download doesn"t start automatically On instrument costs
On instrument costs in decentralized macroeconomic decision making (Helsingin Kauppakorkeakoulun julkaisuja ; D-31) Juha Kahkonen Click here if your download doesn"t start automatically On instrument costs
National Building Code of Finland, Part D1, Building Water Supply and Sewerage Systems, Regulations and guidelines 2007
 National Building Code of Finland, Part D1, Building Water Supply and Sewerage Systems, Regulations and guidelines 2007 Chapter 2.4 Jukka Räisä 1 WATER PIPES PLACEMENT 2.4.1 Regulation Water pipe and its
Constructive Alignment in Specialisation Studies in Industrial Pharmacy in Finland
 Constructive Alignment in Specialisation Studies in Industrial Pharmacy in Finland Anne Mari Juppo, Nina Katajavuori University of Helsinki Faculty of Pharmacy 23.7.2012 1 Background Pedagogic research
Tork Paperipyyhe. etu. tuotteen ominaisuudet. kuvaus. Väri: Valkoinen Malli: Vetopyyhe
 etu Monikäyttöpaperi hoitaa useimmat pyyhintätehtävät Sopiva lasipintojen pyyhintään Sopii käsien kuivaamiseen Elintarvikekäyttöön hyväksytty Tork Easy Handling, pakkaus, jota on helppo kantaa mukana,
Vulnerability assessment of ecosystem services for climate change impacts and adaptation (VACCIA)
") Vulnerability assessment of ecosystem services for climate change impacts and adaptation (VACCIA) Action 8: Vulnerability and adaptation of catchment areas and lakes for climate change impacts Foto: Ilpo
Vulnerability assessment of ecosystem services for climate change impacts and adaptation (VACCIA) Action 8: Vulnerability and adaptation of catchment areas and lakes for climate change impacts Foto: Ilpo
Network to Get Work. Tehtäviä opiskelijoille Assignments for students. www.laurea.fi
 Network to Get Work Tehtäviä opiskelijoille Assignments for students www.laurea.fi Ohje henkilöstölle Instructions for Staff Seuraavassa on esitetty joukko tehtäviä, joista voit valita opiskelijaryhmällesi
Information on preparing Presentation
 Information on preparing Presentation Seminar on big data management Lecturer: Spring 2017 20.1.2017 1 Agenda Hints and tips on giving a good presentation Watch two videos and discussion 22.1.2017 2 Goals
Pricing policy: The Finnish experience
 Pricing policy: The Finnish experience Esa Österberg Senior Researcher Alcohol and Drug Research, STAKES, Helsinki, Finland esa.osterberg@stakes.fi Three pillars of traditional Nordic alcohol control Strict
Characterization of clay using x-ray and neutron scattering at the University of Helsinki and ILL
 Characterization of clay using x-ray and neutron scattering at the University of Helsinki and ILL Ville Liljeström, Micha Matusewicz, Kari Pirkkalainen, Jussi-Petteri Suuronen and Ritva Serimaa 13.3.2012
TIEKE Verkottaja Service Tools for electronic data interchange utilizers. Heikki Laaksamo
 TIEKE Verkottaja Service Tools for electronic data interchange utilizers Heikki Laaksamo TIEKE Finnish Information Society Development Centre (TIEKE Tietoyhteiskunnan kehittämiskeskus ry) TIEKE is a neutral,
ProAgria. Opportunities For Success
 ProAgria Opportunities For Success Association of ProAgria Centres and ProAgria Centres 11 regional Finnish ProAgria Centres offer their members Leadership-, planning-, monitoring-, development- and consulting
The role of 3dr sector in rural -community based- tourism - potentials, challenges
 The role of 3dr sector in rural -community based- tourism - potentials, challenges Lappeenranta, 5th September 2014 Contents of the presentation 1. SEPRA what is it and why does it exist? 2. Experiences
16. Allocation Models
 16. Allocation Models Juha Saloheimo 17.1.27 S steemianalsin Optimointiopin seminaari - Sks 27 Content Introduction Overall Efficienc with common prices and costs Cost Efficienc S steemianalsin Revenue
Trends in stream water concentration and export of nitrogen and phosphorus from boreal forested catchments in Finland
 Trends in stream water concentration and export of nitrogen and phosphorus from boreal forested catchments in Finland Sakari Sarkkola 1, Harri Koivusalo 1, Ari Laurén 1, Pirkko Kortelainen 2, Tuija Mattsson
Photo: Paavo Keränen. KAINUU in statistics 2009
 Photo: Paavo Keränen KAINUU in statistics 2009 KAINUU IN PROPORTION TO THE WHOLE OF FINLAND Forest area Total area Roads Primary production Summer cottages Unemployed Populat. over 64 years Number of farms
MEETING PEOPLE COMMUNICATIVE QUESTIONS
 Tiistilän koulu English Grades 7-9 Heikki Raevaara MEETING PEOPLE COMMUNICATIVE QUESTIONS Meeting People Hello! Hi! Good morning! Good afternoon! How do you do? Nice to meet you. / Pleased to meet you.
Accommodation statistics
 Transport and Tourism 2015 Accommodation statistics 2015, July Nights spent by foreign tourists in Finland up by.5 per cent in July The number of recorded nights spent by foreign tourists at Finnish accommodation
Infrastruktuurin asemoituminen kansalliseen ja kansainväliseen kenttään Outi Ala-Honkola Tiedeasiantuntija
 Infrastruktuurin asemoituminen kansalliseen ja kansainväliseen kenttään Outi Ala-Honkola Tiedeasiantuntija 1 Asemoitumisen kuvaus Hakemukset parantuneet viime vuodesta, mutta paneeli toivoi edelleen asemoitumisen
Kysymys 5 Compared to the workload, the number of credits awarded was (1 credits equals 27 working hours): (4)
: (4)") Tilasto T1106120-s2012palaute Kyselyn T1106120+T1106120-s2012palaute yhteenveto: vastauksia (4) Kysymys 1 Degree programme: (4) TIK: TIK 1 25% ************** INF: INF 0 0% EST: EST 0 0% TLT: TLT 0 0% BIO:
Tilasto T1106120-s2012palaute Kyselyn T1106120+T1106120-s2012palaute yhteenveto: vastauksia (4) Kysymys 1 Degree programme: (4) TIK: TIK 1 25% ************** INF: INF 0 0% EST: EST 0 0% TLT: TLT 0 0% BIO:
1. SIT. The handler and dog stop with the dog sitting at heel. When the dog is sitting, the handler cues the dog to heel forward.
 START START SIT 1. SIT. The handler and dog stop with the dog sitting at heel. When the dog is sitting, the handler cues the dog to heel forward. This is a static exercise. SIT STAND 2. SIT STAND. The
MUSEOT KULTTUURIPALVELUINA
 Elina Arola MUSEOT KULTTUURIPALVELUINA Tutkimuskohteena Mikkelin museot Opinnäytetyö Kulttuuripalvelujen koulutusohjelma Marraskuu 2005 KUVAILULEHTI Opinnäytetyön päivämäärä 25.11.2005 Tekijä(t) Elina
Ilmasto muuttuu kuinka muuttuu veden kierto? HSY 13.2.2013 Esko Kuusisto SYKE 14.2.2013
 Ilmasto muuttuu kuinka muuttuu veden kierto? HSY 13.2.2013 Esko Kuusisto SYKE Viime vuoden sadanta Suomessa oli 15-40% yli keskimääräisen Last year s precipitation in Finland was 15-40% above the average
Accommodation statistics
 Transport and Tourism 2015 Accommodation statistics 2015, April Nights spent by foreign tourists in Finland decreased by 4.4 per cent in April The number of recorded nights spent by foreign tourists at
Use of spatial data in the new production environment and in a data warehouse
 Use of spatial data in the new production environment and in a data warehouse Nordic Forum for Geostatistics 2007 Session 3, GI infrastructure and use of spatial database Statistics Finland, Population
Export Demand for Technology Industry in Finland Will Grow by 2.0% in 2016 GDP growth 2016/2015, %
 Russia Rest of Eastern Europe Brazil America Middle East and Africa Export Demand for Technology Industry in Finland Will Grow by 2.% in 216 GDP growth 216/215, % 9 8 7 6 5 4 3 2 1-1 -2-3 -4 Average growth:
Mineral raw materials Public R&D&I funding in Finland and Europe, 2015. Kari Keskinen
 Mineral raw materials Public R&D&I funding in Finland and Europe, 2015 Kari Keskinen DM1369699 DM1369699 Green Mining (2011-2016) 81 projects started (39 company projects and 42 research projects) 117
Stormwater filtration unit
 Stormwater filtration unit Background, concept and applied design work Olli Hakala 2018 WSP Finland Aalto university Kyttä ym. 2014. Veden äärellä kysely, ENTJUSTESS-hanke. Aalto yliopisto. STORMWATER
7.4 Variability management
 7.4 Variability management time... space software product-line should support variability in space (different products) support variability in time (maintenance, evolution) 1 Product variation Product
Continuous environmental monitoring for the automation of water balance management at mines
 Continuous environmental monitoring for the automation of water balance management at mines SYKE Helsinki 28.8.2015 Jaakko Seppälä M.Sc Eng. Head of the Board EHP-Tekniikka Ltd. EHP-Tekniikka Oy Jaakko
Information on Finnish Language Courses Spring Semester 2018 Päivi Paukku & Jenni Laine Centre for Language and Communication Studies
 Information on Finnish Language Courses Spring Semester 2018 Päivi Paukku & Jenni Laine 4.1.2018 Centre for Language and Communication Studies Puhutko suomea? -Hei! -Hei hei! -Moi! -Moi moi! -Terve! -Terve
2017/S Contract notice. Supplies
 Supplies 153936 2017 25/04/2017 S80 - - Supplies - Contract notice - Open procedure I. II. III. IV. VI. -: Medical equipments, pharmaceuticals and personal care products 2017/S 080-153936 Contract notice
Land-Use Model for the Helsinki Metropolitan Area
 Land-Use Model for the Helsinki Metropolitan Area Paavo Moilanen Introduction & Background Metropolitan Area Council asked 2005: What is good land use for the transport systems plan? At first a literature
On instrument costs in decentralized macroeconomic decision making (Helsingin Kauppakorkeakoulun julkaisuja ; D-31)
") On instrument costs in decentralized macroeconomic decision making (Helsingin Kauppakorkeakoulun julkaisuja ; D-31) Juha Kahkonen Click here if your download doesn"t start automatically On instrument costs
On instrument costs in decentralized macroeconomic decision making (Helsingin Kauppakorkeakoulun julkaisuja ; D-31) Juha Kahkonen Click here if your download doesn"t start automatically On instrument costs
FinFamily PostgreSQL installation ( ) FinFamily PostgreSQL
 FinFamily PostgreSQL") FinFamily PostgreSQL 1 Sisällys / Contents FinFamily PostgreSQL... 1 1. Asenna PostgreSQL tietokanta / Install PostgreSQL database... 3 1.1. PostgreSQL tietokannasta / About the PostgreSQL database...
FinFamily PostgreSQL 1 Sisällys / Contents FinFamily PostgreSQL... 1 1. Asenna PostgreSQL tietokanta / Install PostgreSQL database... 3 1.1. PostgreSQL tietokannasta / About the PostgreSQL database...
Teacher's Professional Role in the Finnish Education System Katriina Maaranen Ph.D. Faculty of Educational Sciences University of Helsinki, Finland
 Teacher's Professional Role in the Finnish Education System Katriina Maaranen Ph.D. Faculty of Educational Sciences University of Helsinki, Finland www.helsinki.fi/yliopisto This presentation - Background
GOOD WORK LONGER CAREER:
 Juhani Ilmarinen, Ville Ilmarinen, Pekka Huuhtanen, Veikko Louhevaara, Ove Näsman GOOD WORK LONGER CAREER: WORK WELL-BEING IN FINNISH TECHNOLOGY INDUSTRIES 2010-2015 Background Collective agreement between
HARJOITUS- PAKETTI A
 Logistiikka A35A00310 Tuotantotalouden perusteet HARJOITUS- PAKETTI A (6 pistettä) TUTA 19 Luento 3.Ennustaminen County General 1 piste The number of heart surgeries performed at County General Hospital
NATURE-BASED TOURSIM, OUTDOOR RECREATION AND ADAPTAION TO CLIMATE CHANGE
 Adapting to climate change: current knowledge, future needs: Final Seminar NATURE-BASED TOURSIM, OUTDOOR RECREATION AND ADAPTAION TO CLIMATE CHANGE Tuija Sievänen, Kaarina Tervo, Marjo Neuvonen, Eija Pouta,
Tork Xpress Soft Multifold käsipyyhe. etu
 etu Erinomainen imukyky: kuivaa kädet nopeasti Pehmeä: hellävarainen käsille Tork Carry Pack -pakkaus helpottaa käsittelyä ja hävittämistä Lehti kohokuviointi: suunniteltu tekemään kauniin vaikutelman
Tarua vai totta: sähkön vähittäismarkkina ei toimi? 11.2.2015 Satu Viljainen Professori, sähkömarkkinat
 Tarua vai totta: sähkön vähittäismarkkina ei toimi? 11.2.2015 Satu Viljainen Professori, sähkömarkkinat Esityksen sisältö: 1. EU:n energiapolitiikka on se, joka ei toimi 2. Mihin perustuu väite, etteivät
Olli-Pekka Penttinen, FT, Dos.
 PROJECT «INTERCLUSTER LABORATORY ON ENVIRONMENTAL PROTECTION AND RISKS ASSESSMENT (ILEPRA)» Rajanylityksiä Rajat ylittävää yhteistyötä Suomen ja Venäjän välillä ILEPRA-projekti eli Intercluster laboratory
Returns to Scale II. S ysteemianalyysin. Laboratorio. Esitelmä 8 Timo Salminen. Teknillinen korkeakoulu
 Returns to Scale II Contents Most Productive Scale Size Further Considerations Relaxation of the Convexity Condition Useful Reminder Theorem 5.5 A DMU found to be efficient with a CCR model will also be
EUROOPAN PARLAMENTTI
 EUROOPAN PARLAMENTTI 2004 2009 Kansalaisvapauksien sekä oikeus- ja sisäasioiden valiokunta 2008/0101(CNS) 2.9.2008 TARKISTUKSET 9-12 Mietintöluonnos Luca Romagnoli (PE409.790v01-00) ehdotuksesta neuvoston
ECVETin soveltuvuus suomalaisiin tutkinnon perusteisiin. Case:Yrittäjyyskurssi matkailualan opiskelijoille englantilaisen opettajan toteuttamana
 ECVETin soveltuvuus suomalaisiin tutkinnon perusteisiin Case:Yrittäjyyskurssi matkailualan opiskelijoille englantilaisen opettajan toteuttamana Taustaa KAO mukana FINECVET-hankeessa, jossa pilotoimme ECVETiä
Expression of interest
 Expression of interest Avoin hakemus tohtorikoulutettavaksi käytäntö Miksi? Dear Ms. Terhi virkki-hatakka I am writing to introduce myself as a volunteer who have the eagerness to study in your university.
RANTALA SARI: Sairaanhoitajan eettisten ohjeiden tunnettavuus ja niiden käyttö hoitotyön tukena sisätautien vuodeosastolla
 TURUN YLIOPISTO Hoitotieteen laitos RANTALA SARI: Sairaanhoitajan eettisten ohjeiden tunnettavuus ja niiden käyttö hoitotyön tukena sisätautien vuodeosastolla Pro gradu -tutkielma, 34 sivua, 10 liitesivua
NAO- ja ENO-osaamisohjelmien loppuunsaattaminen ajatuksia ja visioita
 NAO- ja ENO-osaamisohjelmien loppuunsaattaminen ajatuksia ja visioita NAO-ENO työseminaari VI Tampere 3.-4.6.2015 Projektisuunnittelija Erno Hyvönen erno.hyvonen@minedu.fi Aikuiskoulutuksen paradigman
On instrument costs in decentralized macroeconomic decision making (Helsingin Kauppakorkeakoulun julkaisuja ; D-31)
") On instrument costs in decentralized macroeconomic decision making (Helsingin Kauppakorkeakoulun julkaisuja ; D-31) Juha Kahkonen Click here if your download doesn"t start automatically On instrument costs
On instrument costs in decentralized macroeconomic decision making (Helsingin Kauppakorkeakoulun julkaisuja ; D-31) Juha Kahkonen Click here if your download doesn"t start automatically On instrument costs
WindPRO version joulu 2012 Printed/Page :47 / 1. SHADOW - Main Result
 SHADOW - Main Result Assumptions for shadow calculations Maximum distance for influence Calculate only when more than 20 % of sun is covered by the blade Please look in WTG table WindPRO version 2.8.579
Metsälamminkankaan tuulivoimapuiston osayleiskaava
 VAALAN KUNTA TUULISAIMAA OY Metsälamminkankaan tuulivoimapuiston osayleiskaava Liite 3. Varjostusmallinnus FCG SUUNNITTELU JA TEKNIIKKA OY 12.5.2015 P25370 SHADOW - Main Result Assumptions for shadow calculations
Plant protection of cereals current situation
 Plant protection of cereals current situation PesticideLife Opening seminar 19.2.2010, Jokioinen Pertti Rajala Cereals, total 1 203,1 Winter wheat 16,4 Spring wheat 201,9 Winter rye 11,3 Sring rye 5,1
Wastewater collectuion and treatment in the Helsinki capital area Citywater seminar 20.03.2013. Tommi Fred
 Wastewater collectuion and treatment in the Helsinki capital area Citywater seminar 20.03.2013 Tommi Fred HSY HSY provides waste and water management services for the more than one million residents of
Information on Finnish Language Courses Spring Semester 2017 Jenni Laine
 Information on Finnish Language Courses Spring Semester 2017 Jenni Laine 4.1.2017 KIELIKESKUS LANGUAGE CENTRE Puhutko suomea? Do you speak Finnish? -Hei! -Moi! -Mitä kuuluu? -Kiitos, hyvää. -Entä sinulle?
Sisällysluettelo Table of contents
 Sisällysluettelo Table of contents OTC:n Moodlen käyttöohje suomeksi... 1 Kirjautuminen Moodleen... 2 Ensimmäinen kirjautuminen Moodleen... 2 Salasanan vaihto... 2 Oma käyttäjäprofiili... 3 Työskentely
Transport climate policy choices in the Helsinki Metropolitan Area 2025
 Transport climate policy choices in the Helsinki Metropolitan Area 2025 views of transport officials and politicians Vilja Varho Introduction Experts have doubts about whether sufficiently effective policies
Uusi Ajatus Löytyy Luonnosta 4 (käsikirja) (Finnish Edition)
 (Finnish Edition)") Uusi Ajatus Löytyy Luonnosta 4 (käsikirja) (Finnish Edition) Esko Jalkanen Click here if your download doesn"t start automatically Uusi Ajatus Löytyy Luonnosta 4 (käsikirja) (Finnish Edition) Esko Jalkanen
Uusi Ajatus Löytyy Luonnosta 4 (käsikirja) (Finnish Edition) Esko Jalkanen Click here if your download doesn"t start automatically Uusi Ajatus Löytyy Luonnosta 4 (käsikirja) (Finnish Edition) Esko Jalkanen
3 9-VUOTIAIDEN LASTEN SUORIUTUMINEN BOSTONIN NIMENTÄTESTISTÄ
 Puhe ja kieli, 27:4, 141 147 (2007) 3 9-VUOTIAIDEN LASTEN SUORIUTUMINEN BOSTONIN NIMENTÄTESTISTÄ Soile Loukusa, Oulun yliopisto, suomen kielen, informaatiotutkimuksen ja logopedian laitos & University
ELEMET- MOCASTRO. Effect of grain size on A 3 temperatures in C-Mn and low alloyed steels - Gleeble tests and predictions. Period
 1 ELEMET- MOCASTRO Effect of grain size on A 3 temperatures in C-Mn and low alloyed steels - Gleeble tests and predictions Period 20.02-25.05.2012 Diaarinumero Rahoituspäätöksen numero 1114/31/2010 502/10
Satelliittikuvat osana öljypäästövalvontaa
 Öljypäästövalvonta Euroopan meriturvallisuusviraston (EMSA) satelliittikuvilta Kati Tahvonen Suomen ympäristökeskus Kaukokartoituspäivät 2007 Helsinki, 8.11.2007 Satelliittikuvat osana öljypäästövalvontaa
LUONNOS RT 80260 EN AGREEMENT ON BUILDING WORKS 1 THE PARTIES. May 1998 1 (10)
") RT 80260 EN May 1998 1 (10) AGREEMENT ON BUILDING WORKS This agreement template is based on the General Terms and Conditions of Building Contracts YSE 1998 RT 16-10660, LVI 03-10277, Ratu 417-7, KH X4-00241.
RT 80260 EN May 1998 1 (10) AGREEMENT ON BUILDING WORKS This agreement template is based on the General Terms and Conditions of Building Contracts YSE 1998 RT 16-10660, LVI 03-10277, Ratu 417-7, KH X4-00241.
Helsinki Metropolitan Area Council
 Helsinki Metropolitan Area Council Current events at YTV The future of YTV and HKL On the initiative of 4 city mayors the Helsinki region negotiation consortiums coordinating group have presented that:
A new model of regional development work in habilitation of children - Good habilitation in functional networks
 A new model of regional development work in habilitation of children - Good habilitation in functional networks Salla Sipari, PhD, Principal Lecturer Helena Launiainen, M.Ed, Manager Helsinki Metropolia
Smart specialisation for regions and international collaboration Smart Pilots Seminar
 Smart specialisation for regions and international collaboration Smart Pilots Seminar 23.5.2017 Krista Taipale Head of Internaltional Affairs Helsinki-Uusimaa Regional Council Internationalisation
Työsuojelurahaston Tutkimus tutuksi - PalveluPulssi 11.3.2016. Peter Michelsson Wallstreet Asset Management Oy
 Työsuojelurahaston Tutkimus tutuksi - PalveluPulssi 11.3.2016 Peter Michelsson Wallstreet Asset Management Oy Wallstreet lyhyesti Perustettu vuonna 2006, SiPa toimilupa myönnetty 3/2014 Täysin kotimainen,
Accommodation statistics 2011
 Transport and Tourism 2012 Accommodation statistics 2011 Foreign demand for accommodation services grew by ten per cent in 2011 In 2011, the demand for accommodation services grew by four per cent from
Tynnyrivaara, OX2 Tuulivoimahanke. ( Layout 9 x N131 x HH145. Rakennukset Asuinrakennus Lomarakennus 9 x N131 x HH145 Varjostus 1 h/a 8 h/a 20 h/a
 , Tuulivoimahanke Layout 9 x N131 x HH145 Rakennukset Asuinrakennus Lomarakennus 9 x N131 x HH145 Varjostus 1 h/a 8 h/a 20 h/a 0 0,5 1 1,5 km 2 SHADOW - Main Result Assumptions for shadow calculations
AYYE 9/ HOUSING POLICY
 AYYE 9/12 2.10.2012 HOUSING POLICY Mission for AYY Housing? What do we want to achieve by renting apartments? 1) How many apartments do we need? 2) What kind of apartments do we need? 3) To whom do we
OPAL-Life Hankkeen toimet 2019
 OPAL-Life Hankkeen toimet 2019 Jaana Sorvali, Tampere 10.12.2018 PeltoOptimi-työkalu Viljelijäpalautteen käsittely Työkalu osaksi Taloustohtori-sivustoa Koodaus meneillään Testaus 2019 haastatteluissa
AKKREDITOITU TESTAUSLABORATORIO ACCREDITED TESTING LABORATORY LUONNONVARAKESKUS VANTAA, ROVANIEMI
 T203/M13/2014 Liite 1 / Appendix 1 Sivu / Page 1(5) AKKREDITOITU TESTAUSLABORATORIO ACCREDITED TESTING LABORATORY LUONNONVARAKESKUS VANTAA, ROVANIEMI NATURAL RESOURCES INSTITUTE FINLAND VANTAA, ROVANIEMI
TM ETRS-TM35FIN-ETRS89 WTG
 SHADOW - Main Result Assumptions for shadow calculations Maximum distance for influence Calculate only when more than 20 % of sun is covered by the blade Please look in WTG table WindPRO version 2.8.579
Rotarypiiri 1420 Piiriapurahoista myönnettävät stipendit
 Rotarypiiri 1420 Piiriapurahoista myönnettävät stipendit Ø Rotarypiiri myöntää stipendejä sille osoitettujen hakemusten perusteella ensisijaisesti rotaryaatteen mukaisiin tarkoituksiin. Ø Stipendejä myönnetään
( ( OX2 Perkkiö. Rakennuskanta. Varjostus. 9 x N131 x HH145
 OX2 9 x N131 x HH145 Rakennuskanta Asuinrakennus Lomarakennus Liike- tai julkinen rakennus Teollinen rakennus Kirkko tai kirkollinen rak. Muu rakennus Allas Varjostus 1 h/a 8 h/a 20 h/a 0 0,5 1 1,5 2 km