The Multi-Source National Forest Inventory of Finland methods and results 2013
|
|
|
- Juho Pakarinen
- 8 vuotta sitten
- Katselukertoja:
Transkriptio
1
2 The Multi-Source National Forest Inventory of Finland methods and results 2013 Kai Mäkisara, Matti Katila, Jouni Peräsaari and Erkki Tomppo Natural Resources Institute Finland, Helsinki 2016
3
4
5 Abstract Kai Mäkisara, Ma Ka la, Jouni Peräsaari, and Erkki Tomppo, Natural Resource Ins tute Finland (Luke), Economics and society. This report presents the methods and results of the Finnish mul -source forest inventory corresponding to year. In addi on to field data, satellite images, digital map data and other georeferenced data were used. The main purpose of the ar cle is to make mul -source forest inventory results available for the users and to help the users to understand the principles of the methods and advantages and limita ons of the products. The field data originate from the th Finnish Na onal Forest Inventory from years to. The field data have been computa onally updated to the date July,. The satellite images where from years. The basic features of the improved k-nn, ik-nn, es ma on method are described. The results are presented by the regions of the Public Service unit of the Finnish Forest Centre and within the regions by municipali es, the boundaries as on... The es mates are given, for example, for land areas, areas of tree dominance, age, and development classes of stands and o en separately for forests available for wood supply. The mean volume and volume es mates are given in many different ways: by tree and by mber assortments for forest land, and combined forest land and poorly produc ve forest land and also for forests available for wood supply, as well as by age and development classes. The biomass es mates are given, in addi on to the biomass es mates, by tree groups in young thinning stands in which the first commercial thinning was proposed for the first -year period, separately for stem and bark and branches and foliage. The biomass es mates of mature forests are presented separately for branches, foliage and stem residuals, and stumps and large roots by tree groups. These biomass es mates are given separately for land available for wood supply. All presented results can be employed in calcula ng forest resource es mates also for regions larger than municipali es. The error sources for the es mates as well as the reliability of the es mates are briefly discussed in Sec on.. and Chapter. Keywords: mul -source forest inventory, na onal forest inventory, satellite images, gene c algorithm, k-nearest neighbours, small-area es ma on, stra fica on, sta s cal calibra on
6 Contents Introduc on Materials Field data The employed satellite images Digital Map Data The use of the map data The map data Digital eleva on model Large area forest resource data Methods Image rec fica on and radiometric correc on of the spectral values.... Prepara on and upda ng of the field data Canopy cover Overview of upda ng Upda ng of the field plot data Prepara on of the input data sets The es ma on methods The improved k-nn method (ik-nn) Selec ng es ma on parameters and their values for k-nn..... Area and volume es mates for small areas correc on for map errors..... Assessing the errors Results Forest resources by municipali es Biomass es mates and available energy wood.... Digital thema c output maps Discussion References Appendix......
7 List of abbreviations k-nn ik-nn NFI MS-NFI MS-NFI- MS-NFI-OA- Landsat Landsat TM Landsat OLI IRS/Resourcesat LISS- NLS DEM RMSE SE FRYL k-nearest Neighbour method Improved k-nn method Na onal forest inventory Mul -source na onal forest inventory Mul -source na onal forest inventory for Open access MS-NFI- Land satellite Thema c Mapper, a high-resolu on mul spectral scanner system on board the Landsat- and Landsat- satellites Opera onal Land Imager, a high-resolu on mul spectral imaging system on board the Landsat- satellite. Indian Remote Sensing Satellite, Linear imaging self-scanner Na onal Land Survey of Finland Digital eleva on model Root mean square error Standard error Forestry land, in MS-NFI covers forest land, poorly produc ve forest land, and unproduc ve forest land
8 1 Introduction The purpose of this report is to present the municipality levels es mates of forest parameters, and describe the methods and parameters used both when making the year version of the forest resource maps and the municipality level es mates. This report is meant to be self-sufficient for understanding this version of the results, but this means that there is a lot of overlap with publica ons describing the previous versions (e.g., Tomppo et al., ). A more thorough descrip on of the background is found in the book by Tomppo et al. ( b) describing the results from year. The First Na onal Forest inventory (NFI) was carried out in Finland from. The eleventh inventory began in and the field measurements were completed in. Based on the informa on from sample plots, es mates can be made for the en re country, or regions within a country, with a minimum size of about hectares, depending on the forest parameter. The densi es of plots are high enough to ensure that the resul ng sampling errors are low for core variables, such as areas of land classes and the volume of growing stock. Before the latest restructuring of the organiza on of the Finnish Forest Centre, the regions of the Public Service unit of the Finnish Forest Centre used to be the administra ve units of Finnish Forestry. Because of con nuity, they are s ll used when presen ng es mates of forest parameters. The units had forest areas between hectares and million hectares. These units are called in the con nua on also regions of the Forest Centre. The areas of the regions are divided into sub-areas from which forest resource and forest status informa on are needed. High u lisa on levels of forests and the changing prac ces of forestry and forest industries in the s and s required more accurate, localised and up-to-date informa on than previously. The use of field data alone to respond to the increased informa on needs would have been an expensive alterna ve. Either a substan ally denser field plot grid or some other type of informa on was required. The development of the Finnish mul -source na onal forest inventory (MS-NFI) began in the Forest Research Ins tute of Finland (Metla) in, and the first opera ve results were calculated in (Tomppo,,, b). The MS-NFI was introduced during the th rota on of NFI ( ) in the Pohjois-Savo region of the Public Service Unit of the Finnish Forest Centre (see Fig.., Chapter ). The first results for the en re country were published in (Tomppo et al. ). The second country level results were published in (Tomppo et al. b), the third results corresponding year and covering South and Central Finland (Tomppo et al. a), and the fourth results corresponding to year and covering the en re country except Åland and the most northern Lapland (Tomppo et al. ). The fi h results corresponding to year and covering whole country except the three northernmost municipali es in Lapland were published in (Tomppo et al. ), and the sixth results corresponding to year in (Tomppo et al. ). For MS-NFI, methods were sought that would provide area and volume es mates, possibly broken down into subclasses, such as tree, mber assortments, and stand-age classes. Since NFI, the es mates of poten al wood energy biomass from forests have been produced. In the op mal case, the MS-NFI method should be able to provide es mates for small areas as accurate as the field based method provides es mates at na onal and regional levels. Since the first implementa on of this method, it has been modified con nuously and new features have been added (Ka la et al., Ka la and Tomppo,, Tomppo et al. a). The core of the current Finnish MS-NFI method is presented in (Tomppo and Halme ) as well as in (Tomppo et al. b). A somewhat similar method, which combines field data and satellite images, has been developed and employed or tested in a several other countries like Sweden (Nilsson, Reese et al.,, Hagner and Olsson ), USA (Franco-Lopez et al., McRoberts et al. a,b, McRoberts ), Norway (Gjertsen ), Austria (Koukal et al. ), New Zealand (Tomppo et al. ), China (Tomppo et al. ), Germany (Diemer et al. ) and Italy (Maselli et al. ). Tomppo et al. ( b) gives a list of references. The Swedish k-nn product is used for a mul tude of purposes, as well as a basis for poststra fica on to produce the official Swedish forest sta s cs, see also (Tomppo et al. b). McRoberts et al. ( a) and McRoberts et al. ( b) also applied k-nn products to post-stra fied es ma on.
9 examples of the development work in USA are the studies by McRoberts ( ) and McRoberts and Tomppo ( ), who presented a model-based approach to derive k-nn error es mators for a group of pixels at an arbitrary size, Finlay et al. ( ) and Finlay and McRoberts ( ), who presented two methods of increasing the efficiency of the k-nn search. A review of using remote sensing data in NFIs is presented by McRoberts et al. ( a) and McRoberts et al. ( b). An error es ma on method based on bootstrapping is presented by McRoberts et al. ( ) and Magnussen et al. ( ). The progress of the Finnish NFI was changed somewhat for NFI ( ). Measuring field plots throughout the en re country every year was the biggest change. One-fi h of the clusters are measured annually, except the clusters in the archipelago regions (Åland) between Finland and Sweden, which was measured during one field season in. (The clusters in the Northernmost Lapland were not measured in NFI.) At the same me, the inventory rota on was shortened to years, or nearly half of its previous rota on dura on. Inventory progressed by regions from the fi h inventory ( ) un l NFI ( ) (Tomppo a). This change makes it possible to compute the basic forest resource es mates annually for the en re country. This change in inventory progress makes it possible to calculate also the MS-NFI results more frequently than during NFI and NFI. In the NFI plans, MS-NFI results were decided to be calculated every second year for the most part of the country, and for North Finland every fourth year. The new approach to progress sets some addi onal challenges for the MS-NFI, e.g., field measurements from several years can and must be employed. In the results presented in this ar cle, NFI field data from the years were used. The inventory is called MS-NFI- throughout this ar cle. The NFI proceeded in the same way as the NFI except that the cluster sizes were revised to be er correspond to a workload of one working day a er the increased measurements. The method for making MS-NFI- was improved from the method for making MS-NFI- and a similar method has been used in MS-NFI-. Instead of just removing from the ground data the field plots that have changed between imaging and field work, the ground data have been updated to a set date ( July in this case). The forest variables at plots that have been cut (or otherwise radically changed) have been updated to the new state. All of the field data have been computa onally updated so that the volume matches the volume es mated from the field plots for each processing window for year. The method is described in more detail in Sec on... Note that this change affects the difference between MS-NFI- and MS-NFI-. With the old method, the mean field data correspond roughly to the midpoint of the field data interval. With the new method, the field data correspond roughly to the end of the field data interval. This means that the difference between MS-NFI- and MS-NFI- corresponds to a longer me span than two years. The same applies to differences between MS-NFI- and MS-NFI-. The most significant improvement in MS-NFI- comes from the satellite data. Most of the satellite data in the two previous MS-NFI products came from the Landsat TM instrument. The Landsat satellite (Landsat ) was launched in February, and the data were available for public use in Summer. The basic characteris cs of the new OLI sensor were similar the TM sensor but the structure of the scanner and the sensor array resulted in be er quality than was possible with the TM sensor. This is also reflected in the forest resource maps. The pixel size of MS-NFI- was changed to by meters from the by meters used in the previous products. The main reason was to make the products compa ble with WMTS grid in the na onal JHS recommenda on (JHS ). The pixel size is close to the pixel size of the panchroma c channel of the Landsat OLI sensor. The new pixel size also is the same as used by the Finnish Forest Centre when making raster products using ALS (Airborne Laser Scanning), although the origin of the grid is not the same. The Natural Resources Ins tute Finland (Luke) was founded in the beginning of year and comprises the state research ins tutes MTT Agrifood Research Finland, the Finnish Forest Research Ins tute, the Finnish Game and Fisheries Research Ins tute, and the sta s cal services of the Informa on Centre of the Ministry of Agriculture and Forestry. The work on MS-NFI- began at Metla and was completed at Luke. The main users of the MS-NFI results, municipality level es mates and forest resource maps are the
10 forestry authori es at the Finnish Forest Centre, forest industries and forest environment researchers. More details of the uses are given in Tomppo et al. ( a,b,, ). The number of users has increased a er the map form es mates from MS-NFI- were made publicly available in November. The maps from MS-NFI- have been added to the publicly available data sets in September. The maps are available for viewing in the Finnish Paikka etoikkuna portal ( paikkatietoikkuna.fi/) (Paikka etoikkuna a) and for downloading at URL luke.fi/. The objec ves of this ar cle are two-fold, ) to present the methods and results for the products called mul -source na onal forest inventory of Finland for year (MS-NFI- ), ) to present briefly the third set of the MS-NFI products used in the Open spa al data sets and interface services available in Finland free of charge at Paikka etoikkuna ( a) and (Metla ). This data set is called here open access MS-NFI- and abbreviated as MS-NFI-OA-. The core of this product is the map form es mates from MS-NFI-. For a cover as complete as possible for MS-NFI-OA- from the en re country, the product has been completed by the data es mates from the recent years. The product thus consists of the following sub-products:. The es mates from, the NFI field data from and the satellite images from,. The es mates from, the NFI field data from and the satellite images from (Tomppo et al. ),. The es mates from, the NFI field data from and the satellite images from (MS-NFI- ) (Tomppo et al. ),. The es mates for about the municipali es Inari and Utsjoki in North Lapland, the NFI field data from and the satellite images from,. The es mates for about municipality Enontekiö in North Lapland, the NFI field data from and the satellite images from, Furthermore, some areas, covered by clouds in the previous sub-products, have been completed by the MS-NFI es mates from (Tomppo et al. ). The municipality level results are available in electronic form at the Luke web site The MS-NFI methods are only briefly described with the emphasis in the core of the methods and the changes made for this product. References for the methods are given otherwise. 2 Materials 2.1 Field data The field sample plots from NFI from years were used for the results presented in this ar cle, in plots, plots on land, on forestry land (including forestry roads) and plots on the combined forest land, poorly produc ve forest land and unproduc ve land. The Finnish na onal forest inventory is a sampling based inventory. The sample plots are arranged into clusters. An important aspect is that measuring the plots in a cluster should represent one day s average field work. The field measurements and assessments of the NFI are carried out on the field sample plots and on those forest stands that include at least a part of a field plot. The field sample plot is also a unit in the field data based es ma on (Tomppo a, Tomppo et al. a). The field sample plot of NFI has been an angle count plot (Bi erlich) plot since NFI and was also in NFI. A maximum distance from the centre point of the plot to the trees to be included into the plot was introduced during NFI in North Finland in (Fig.. ). The maximum distance detracts
11 very li le from the reliability of the es mates but decreases the amount of field work and also reduces possible errors caused by unobserved trees. The basic principles of the NFI design are similar to those of NFI and NFI (Tomppo Public Service Units a). In NFI, satellite image-based digital volume maps and sampling simula ons were em- 1 Rannikko 0 Åland ployed to evaluate different sampling designs. The 1a Etelärannikko 1b Pohjnamnaa sampling intensity was fi ed to the spa al varia- 2 Lounais-Suomi on in forests throughout the whole country, being lower in the north than in the south (Hen onen 3 Häme-Uusimaa 4 Kaakkois-Suomi 13 5 Pirkanmaa, Tomppo et al. a). 6 Etelä-Savo 7 Etelä-Pohjanmaa The number of the plots per cluster was 8 Keski-Suomi slightly decreased for NFI to reduce the workload 9 Pohjois-Savo (Korhonen et al. ). For NFI, the num- 10 Pohjois-Karjala 11 Kainuu ber of the plots on the temporary clusters decreased and the distance between the two adja- 13 Lappi Pohjois-Pohjanmaa 12 cent plots in the Southernmost Finland increased 1b (Fig.., Valtakunnan ( )). The temporary plot loca ons were changed from NFI to NFI, 7 and from NFI to NFI by moving the clusters in the west-east and north-south direc on. New sampling simula on studies were carried out for 5 6 NFI in all parts of the country for the forest area, 2 0 mean volumes by tree (m 3 /ha), and 3 4 volumes (m 3 ) variables. The six sampling intensity regions, together 1a Figure. : The Public Service Units of the Finnish Forest Centre and Åland region... Digital map data: Na onal Land Survey of Finland, licence No. MML/VIR/MYY//. with field plot clusters, are shown in Fig... The NFI sampling designs, cluster sizes, and distances between clusters, in the southernmost part of the country, Central Finland, North Central Finland and South Lapland, as well as the plot cluster for North Lapland are shown in Fig... The average distances between clusters were km by km in the southernmost Finland (extra cluster lines were added to obtain high enough number of field plots in Åland, Region, Fig..), km by km in Central Finland, km by km in North Central Finland, with fewer plots than in Central Finland, and km by km in the municipality of Kuusamo and in South Lapland. Figure. : A sample plot of NFI. The maximum distance to trees to be counted is. m in South Finland (q= ) and. m in North Finland (sampling regions in Fig.. )(q=. ). Every th tree is measured as sampling tree, counted by crews star ng from the beginning of the field season.
12 a) 3 km 3 km 6 km 3 km 1250 m 3 km 6 km 3 km 3 km 1250 m P P 1200 m T T T 1200 m T T T P P T T T Temporary clusters (T) sample plots 1-9 Permanent clusters (P) sample plots m (T) 1250 m (P) 300 m (T) 250 m (P) Permanent and temporary plot Permanent plot Temporary plot b) 3 km 4 km 7 km 3 km 1500 m 3 km 7 km 4 km 3 km 1200 m P P 1500 m T T T 1500 m T T T P P T T T m Temporary clusters (T) sample plots 1-11 Permanent clusters (P) sample plots 1-10, m c) 3 km 4 km 7 km 3 km 1500 m P 1500 m 3 km 7 km 4 km 3 km K 1200 m 1200 m P T T T T T P P T T T m 1500 m Temporary clusters (T) sample plots 1-9 Permanent clusters (P) sample plots d) 1 km 9 km 10 km 1 km P 1500 m 1 km 10 km 9 km 1 km 1500 m 1800 m P 1800 m T P T T T P T 300 m m Temporary clusters (T) sample plots 2-7 and 9-14 Permanent clusters (P) sample plots Figure. : Sampling designs of the NFI in different inventory regions: (a) region, (b) region, (c) region, (d) region. The tree level volumes on the field sample plots are converted to volumes per hectare in the MS-NFI using the expansion factor. Volumes per hectare are es mated for each sample plot by tree and by mber assortment classes based on the tally tree volumes. The es ma on of volumes and volumes of mber assortments for tally trees from field measurements is described in Tomppo et al. ( a). wise, the field variables used are similar to those in the NFI calcula ons that use field data only. As the calcula ons based on field measurements do not involve increment es mates for tally trees, increment es mates are not usually produced using the mul -source method. Biomass es mates were calculated for each field plot by tree groups and by tree compartments. The biomass es mates can be used for assessing carbon balance of forests in small areas, and for energy wood es ma on. The two main poten al development classes of wood energy sources of forests in Finland are young thinning stands and mature stands. All tree compartments above stump of those trees to be harvested as energy wood are removed in a young thinning stand, i.e., the en re stem over stump, branches and foliage.
 are removed for energy in the case of the regenera on cu ng of")
13 Figure. : NFI layout of clusters and the six geographic regions with different sampling intensi es, NFI. Digital map data: Na onal Land Survey of Finland, licence No. MML/VIR/MYY//. Only the residual part of stem, in addi on to branches, and op onally stumps and coarse roots (with a theore cal minimum diameter of cm) are removed for energy in the case of the regenera on cu ng of a mature stand. 2.2 The employed satellite images High-resolu on (about metres pixel size) mul spectral satellite images were used in the opera ve applica on. Large coverage and good availability with reasonable price, or free of charge, were addi- onal selec on criteria. Based on these requirements, the Landsat OLI sensor was the most suitable one for this applica on. High quality Landsat OLI images over Finland were available for summers and, and these were used for most of the processed area. These images were available from USGS (U.S. Geological Survey) without cost (Landsat ). The images were orthorec fied to UTM zones,, and, as appropriate. To fill the gaps in the TM coverage, images from the Resourcesat LISS-III instrument were used (Table. ). The land area of Finland, analysed for MS-NFI-, was. million hectares, and the area together with the lakes and rivers. million hectares. For processing, this area was covered using images assembled from satellite image frames (Table., Fig.. ). Where possible, adjacent satellite image frames from same path and date were combined to increase the number of field plots within image and to simplify processing. For MS-NFI-, the target year of image acquisi on was. of the Landsat OLI image frames were from that year. The Resourcesat LISS-III images were from years ( frame) and. A
14 Table. : List of satellite images used in the MS-NFI- : image index number in Fig.., satellite sensor, path/row, acquisi on dates of image frames and number of image frames in one image. Image No. Sensor Path/Row Date No. of image (Fig.. ) frames Landsat OLI / to Landsat OLI / to Landsat OLI / to Landsat OLI / Landsat OLI / to Landsat OLI / to Landsat OLI / to Landsat OLI / to Landsat OLI / to Landsat OLI / to Landsat OLI / to Landsat OLI / to Landsat OLI / to Landsat OLI / to Landsat OLI / to Resourcesat LISS-III / Resourcesat LISS-III / to Landsat OLI / Landsat OLI / to suitable imaging season for forest inventory purposes in Finland is from mid-may un l the end of August, with the op mal me being from early June un l the end of July. The imaging season is rather short and cloud cover is frequent even in the summer, which makes image acquisi on problema c. All the satellite images needed to be in the ETRS-TM FIN coordinate system for further processing. The Landsat OLI images were delivered in the UTM projec on but the rec fica on accuracy was not good enough for our purposes. Some of the images were delivered in UTM projec on zones and. Because of these facts, the OLI images were re-rec fied to the ETRS-TM projec on. The Resourcesat images were already rec fied to the ETRS-TM FIN projec on with good accuracy and did not need re-rec fica on. See Sec on. for details. 2.3 Digital Map Data The use of the map data Digital map data are used to reduce the errors in the es mates. The errors in both the area and volume es mates can be reduced significantly by the mul -source method if the differen a on of forestry land from non-forestry land can be supported by digital map informa on in addi on to satellite images (Tomppo ). The map informa on is used to separate forestry land from other land classes, such as arable land, built-up areas, roads, urban areas and single houses. The effect of possible map errors on small-area es mates is reduced by using one of two alterna ve sta s cal methods (Ka la et al., Ka la and Tomppo, Tomppo et al. b). The first one is a calibra on method using a confusion matrix derived from the land class distribu ons on the basis of field plot data and map data, and the second one employs stra fica on of the field plots on the basis of map data (see Subsect... ). In addi on, the map data are used to stra fy the forestry land area and the corresponding field plots into a mineral soil stratum, a peatland soil stratum and open bog and fen stratum. Digital map data is also used to delineate the computa on units in the MS-NFI. Areas of protected forests were used to calculate es mates for forestry land available for wood supply by municipali es. The mineral soils and different types of organic soils (peatland soils) can have significantly different spectral signatures even when the growing stock is the same (e.g., Ka la and Tomppo ). In addi- on, some peatland cannot be separated from mineral soils by means of remote sensing. Therefore,
.")
15 Figure. : The satellite image mosaic used to cover the Finland in MS-NFI- and MS-NFI-OA- and the boundaries of the s. Digital map data: Na onal Land Survey of Finland, licence No. MML/VIR/MYY//. stra fica on based on digital peatland informa on is used to decrease the predic on and es ma on errors (Tomppo, Ka la and Tomppo ). The site class defini on is vegeta on-based in the NFI: the forest stand is considered to be peatland (spruce mires, pine mires, open bogs and fens) if the organic layer covering the mineral soil is peat or if % of the under storey vegeta on is peatland vegeta on (Lehto and Leikola ). A geological defini on of peatland is used for the topographic mapping: peatland is covered mainly by peat vegeta on and the thickness of peat layer is over cm. Thus, the peatland mask can not be used in a categorical way, but it is used to stra fy the forestry land, satellite images and corresponding field plots for subsequent analysis in the es ma on phase. Stra fica on is used to avoid the biases caused by the peatland map that deviates from the peatland used in the NFI, the devia ons caused by the different defini ons and loca onal errors in the maps. Almost all map data were obtained in vector format from the Topographic database of Na onal Land Survey of Finland (NLS) (Table. ) (Maanmi auslaitoksen maasto etokohteet ). A raster map with m by m pixel size was computed from selected topographic database elements. For the
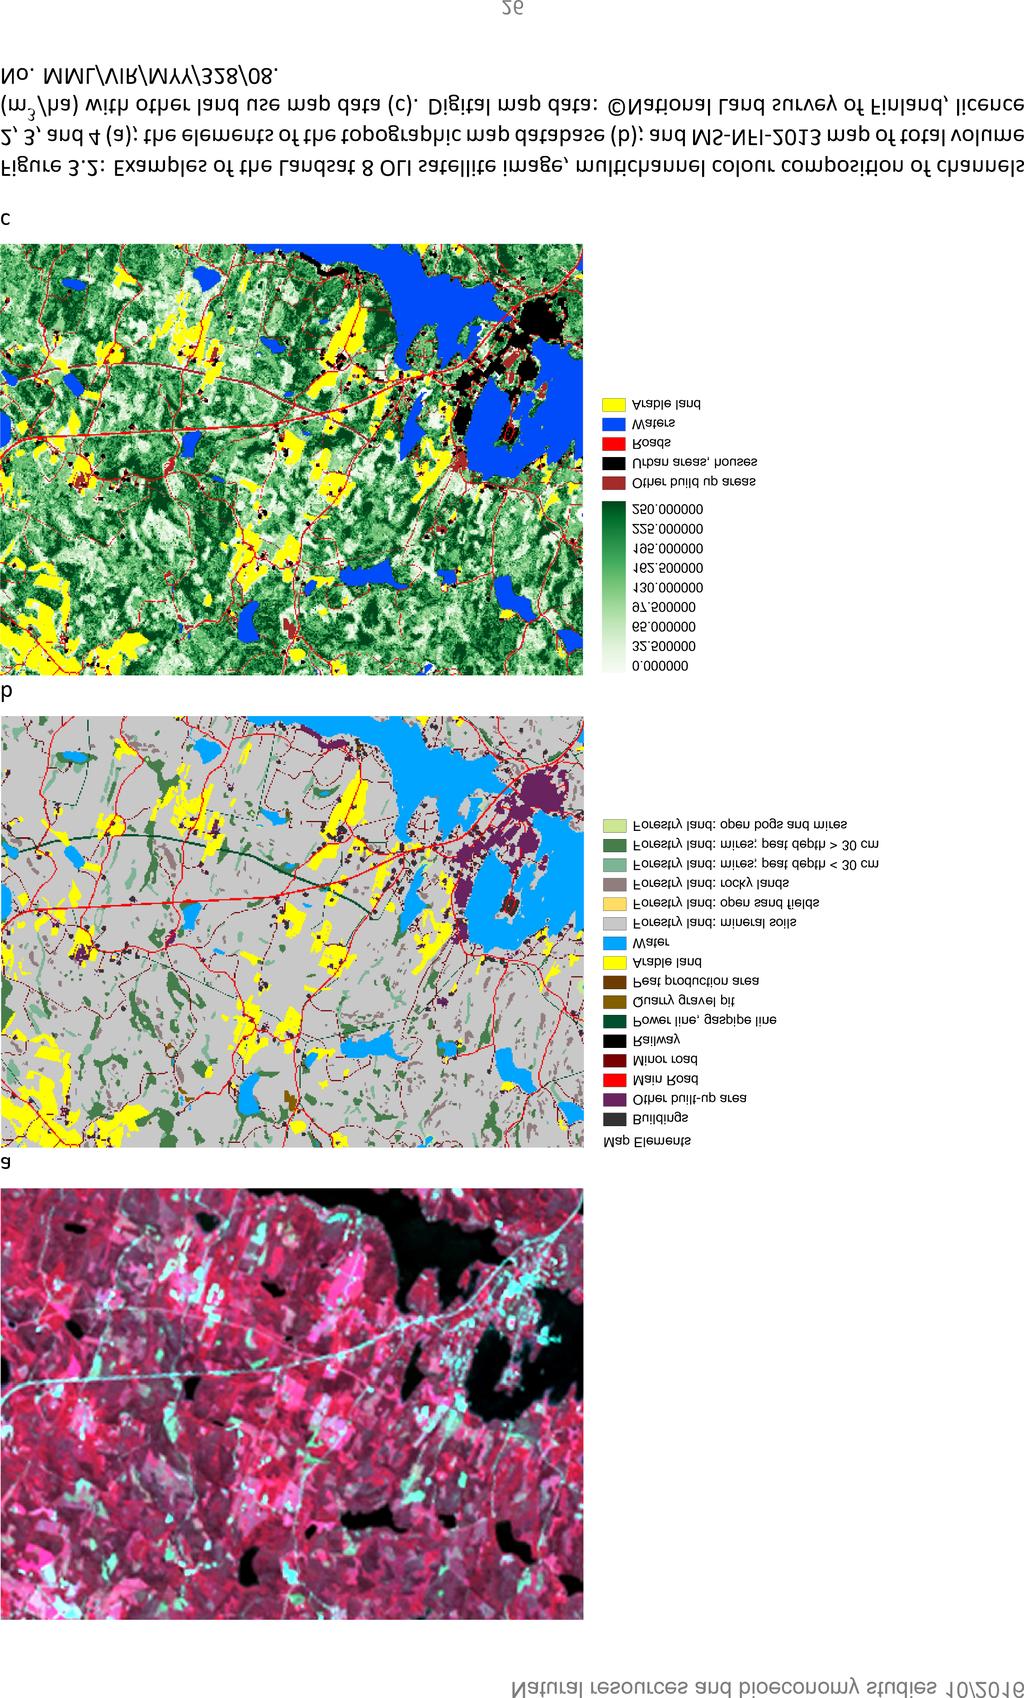
16 Table. : Sources and quality of the numerical map data. Map theme(s) Delivered by Scale Date in databaseg Area covered Data source Topographic database; NLS : whole country Topographic database landuse classes, peatlands, municiplaity borders Protected forests SYKE.. private forests whole country Nature conserva on.. state forests databases Nature conserva on SYKE whole country Nature conserva on programmes databases Regional land use SYKE :.. most of the Regional land use plans (Maakuntakaava), country GIS-database protected areas S Old regional land use SYKE, : some of the VASEPA plans (Seutukaava), Regional country databases protected areas S councils purposes of the calibra on method (Subsect... ), the overlaying of the map elements was done in such a way that it would be possible to form map strata as homogeneous as possible with respect to the NFI field plot based land class distribu on (Ka la et al. ). The main objec ve was to use the derived digital land use map (Fig.. b) to obtain as precise es mate as possible for the combined forest land, poorly produc ve forest land and unproduc ve forest land (denoted by forestry land) when compared to the NFI field data based es mate. The accuracy of an earlier version of derived land use map data were studied against the NFI field based land classes by Tomppo et al. ( b) The map data The elements from the topographic database The version of of the topographic database was used. The posi onal accuracy of the topographic database is comparable to maps on scale : : (Maanmi auslaitoksen maasto etokohteet ). The topographic database consists of map sheets which are updated in year periods. However, all roads and almost all the buildings are updated annually, as well as administra ve boundaries. Due to this staggered processing, the date of the topographic map elements varies and the date of the oldest elements were from and half the maps were from or later (Fig.. ). In Fig.. the me stamp of a par cular map sheet is the year when it is entered to the database. In prac ce the maps can be considered to capture the land use of the previous year as the aerial photos for mapping purposes are usually taken one year earlier (Krannila personal communica on) All the map elements were rasterised to m by m pixel size. The rasterisa on was done separately for each element and suitable widths for line elements (roads, power lines, etc.) and buffer zones for buildings were defined. These widths and buffer zones were determined itera vely by comparing the propor ons of the land classes based on the rasterised topographic database and the NFI field plot data (Tomppo et al. ). The main principle in the rasterisa on and generalisa on was to keep the area covered by each map theme as same as that based on the NFI data. The visual appearance of the non-forestry land classes in the MS-NFI output map was considered to be of secondary importance. The selected elements of topographic database, possible width in processing and their priority in overlaying of the elements are described in Table.. The topographic database includes subclasses of open bogs, woody peatland (peat depth >= cm) and paludified lands (peat depth < cm). It was therefore possible to stra fy the peatland in the ik-nn es ma on into open bogs and woody peatland (Subsect... ). Paludified peatland correspond most o en to mineral soils in NFI field plots and were thus kept as mineral soils in MS-NFI-. Arable land is the third largest land class a er forestry land and inland waters with an area of. million hectares (Finnish Sta s cal Yearbook of Forestry ). The area of the forestry land was. million hectares and the area of the inland watercourses. million hectares. Most of the land use changes occur between arable land and other land classes.
17 Time stamp Figure. : The me stamp of the topographic database map sheets ( : ) and a grid of : map sheets. Digital map data: Na onal Land Survey of Finland, licence No. MML/VIR/MYY//. Urban areas and other built-up areas (e.g., mineral resources extrac on areas, peat produc on areas, landfill areas, cemeteries, air-fields, parks, sports and recrea on areas) were delineated using elements of the topographic database. The delinea on of water was taken from the topographic database. A conserva ve threshold of water employing near infrared spectral channel values was used to backup the cases of possible missing map data or seasonal changes in the water level. An addi onal constraint to the above masks and water thresholds was used in the ik-nn es ma on by using a digital eleva on model: for the water pixels, the angle between solar illumina on and the normal terrain should be near the angle defined for flat terrain, i.e., should not deviate from that angle more than a given small threshold (Tomppo et al. ). Digital boundaries of the computa on units The basic computa on unit in the mul -source inventory is the municipality, the number being at the beginning of. Their land areas range from around hectares to some hundreds of thousands of hectares. Digital municipality boundaries are used to delineate the computa on units (Tomppo ). The boundary informa on originates from NLS topographic database and was obtained in vector format. The map data and land areas of the municipali es da ng.. were employed to calculate the small area es mates (cf. calibra on to official land areas, Subsect... ).
18 Table. : The elements of the topographic database selected to the land class map, applied line buffer zone widths in the rasterising. The elements are in the priority order in the table (uppermost first). Forestry land is the area not covered by elements extracted from the topographic database. MS-NFI code MS-NFI Map code Descrip on Topog. database code(s) Notes Roads See roads below Overl. over water Sea water Fresh water, Decomposing relic on area Built-up area Railroad, Buffer m Roads, class Ia - IIIb, Buffer m Buffer m Buffer m, Buffer m Agricultural field Quarry, gravel pit,, Peat produc on area Meadow Airport Graveyard Landfill Garden Park Earth fill Sports/recrea onal area Built construc on Buffer m Basin Buffer m Storage area road Buffer m Power line Buffer m Buffer m Gas pipe Buffer m predic on Bare sand predic on Exposed bedrock, Building Buffer m, Buffer m Buffer m Buffer m Buffer m, Buffer m Buffer m predic on Paludified area, <=. ha predic on Paludified area <=. ha predic on Paludified area predic on Forested marsh <=. ha, predic on Forested marsh <=. ha, predic on Forested marsh, predic on Open bog, predic on Open relic on area predic on Forestry land <=. ha predic on Forestry land <=. ha predic on Forestry land Digital boundaries of protected forests Some es mates for municipali es were calculated for forestry land available for wood supply (Subsect.., Appendix Tables). Areas of protected forests and nature conserva on programmes obtained from the Finnish Environment Ins tute were used for this purpose (Ympäristöhallinnon paikka etoaineistot ). The protected forests data were obtained in vector format da ng.. for the private forests and for the same date for the state owned forests, while the nature conserva on programmes delinea ons originate from the date of founding the programmes ( ). All the map data were rasterised to m by m pixel size. The protected areas included
19 strict nature reserves, na onal parks, wilderness areas, special protected areas, protected old-growth forest areas, protected herb-rich forest areas, mire conserva on areas, nature reserves on private land (protected permanently or temporarily), protected areas established by the Finnish Forest and Park Service and natural habitat types preserved on the basis of Nature Conserva on Act. The nature conserva on programmes employed are: Aarnialue, areas protected based on decision by the authority responsible of management; mires; herb-rich forests; natural parks and nature reserves developing; avian water areas ( Mikkelin saaret ). The nature conserva on programmes digital database has not been updated since its crea on. Therefore it contains a) areas where there is not yet final decision of protec on made, b) areas with decision of status made. However, among the la er ones there is a minor propor on of areas which have been rejected and thus are erroneously classified as protected forests in our mask. Thirdly, the protected areas (code S ) from the regional land use plans were used to complete the protected forests mask. There were two data sources for the regional land use plans, new ones called Maakuntakaava as of.. and for minor number of regions the old ones called Seutukaava from year. 2.4 Digital elevation model A digital eleva on model is used in two ways: for stra fica on on the basis of eleva on data and for correc ng the spectral values by reference to the angle between solar illumina on angle and the terrain normal (Subsect... ) (Tomppo, Tomppo et al. b,, ). Stra fica on in this context means using the maximum ver cal distance from a pixel to its nearest neighbours. The selec on of parameters for stra fica on and spectral correc on has been studied by Ka la and Tomppo ( ). The digital eleva on model (DEM) employed was a raster file with a horizontal spa al resolu on of metres by metres and with a ver cal resolu on of. metres (Korkeusmalli m ). The values used in the by metre grid were obtained by applying a Gaussian filter to the data a er resampling. This was done to prevent artefacts in the slope computed from the DEM. The full width of the Gaussian at half maximum (FWHM) was meters. 2.5 Large area forest resource data The basic k-nn method was employed in MS-NFI ( ). The improved ik-nn method was introduced during NFI. The la er employs a coarse scale varia on of the key forest variables to guide the selec on of field plots from which the data are transferred to the pixel to be analysed. The varia on is presented in the form of coarse-scale digital forest variable maps (Fig.. ), derived either from the current inventory data or from the data of the preceding inventory. In MS-NFI, the field data from NFI was employed (Tomppo et al. b). For MS-NFI- of the present ar cle, the NFI field plots from were used. The large area changes in forests are slow and the tree propor ons of the volume of growing stock do not change essen ally in a few years. The coarse scale maps made with the field data from the years are thus relevant also for the MS-NFI products for the year. There were field plots on land across the en re country in the data, of which were on forestry land, on combined forest land and poorly produc ve forest land, and were on forest land alone. All the plots on forest land and poorly produc ve forest land were used for the final large-area maps. The principles construc on of the maps is described in (Tomppo et al. b). Moving average interpola on was used. The cluster level averages of the volumes by tree groups (pine, spruce, birch and other broad-leaved tree ) were first calculated. The averages of these cluster level averages were calculated within a circle of a radius of km and the original cluster levels averages were replaced by these moving averages. The values of these moving averages were predicted for each grid cell of km x km in Finland using -NN method. The distance was in the geographical space. Further smoothing was employed using moving averages twice with windows sizes of km x km and km x km.
 of pine")
 with boundaries of the s.")
20 Figure. : Large scale varia on of mean volumes (m 3 /ha) of pine (a), spruce (b), birch (c), and other tree (d) in NFI and NFI ( ) with boundaries of the s. Digital map data: Na onal Land Survey of Finland, licence MML/VIR/MYY//.
21 3 Methods 3.1 Image rectification and radiometric correction of the spectral values Point-type objects (e.g., small islands) were iden fied on both the satellite images and the basic maps and a regression model was fi ed to their image coordinates and map coordinates. First or second order polynomial regression models were usually employed for this purpose. A typical number of control points has been around. The nearest neighbour method was applied to re-sampling of the images to pixel size of m by m. The absolute values of the residuals in the rec fica on models at control points typically ranged from. to metres. No atmospheric correc on was performed. Areas corresponding to the cloud-free parts of satellite images are used in opera ve applica ons. Forests under clouds and in cloud shadows are assumed to be similar on the average to those on the cloud-free part of the same areal unit (e.g., municipality). The slope and aspect of the terrain locally change the illumina on condi ons of the surface and affect the reflectance from the ground and vegeta on, as well as the radiance received by an imaging instrument. A digital eleva on model was employed to remove the varia on of the spectral values caused by the changes in the slope and aspect of the terrain. The details of the method are given in (Tomppo, Tomppo et al. b). The parameter selec on has been studied in Ka la and Tomppo ( ). 3.2 Preparation and updating of the field data Canopy cover The canopy cover was measured at field plots in NFI, but the measurement was not con nued in NFI. In order to provide mul -source es mates for canopy cover, it was es mated for NFI field plots using NFI data. The models presented by Korhonen et al. ( ) were tested using NFI field plots. The result was that the models could not reproduce the measured values when the canopy cover was very low or very high. Because of this, a new method for es ma ng the canopy cover was designed. The design goal was to make a method that can reproduce the values measured in NFI as well as reasonably possible. Because the NFI field data were extensive, the k-nn method was used. The input variables and weights were manually determined. This was done separately for forest land, poorly produc ve land, and unproduc ve land because the set of available field measurements was different. For forest land and poorly produc ve land, the es ma on was done separately according to the dominant (pine, spruce, others). The canopy cover for deciduous trees was computed from the canopy cover according to the propor on of deciduous trees in the field plot (computed from stem counts in seedling stands and basal area in mature stands). These algorithms have been used from MS-NFI Overview of updating The key input data file for the MS-NFI is the ground truth data, consis ng of field plot data as well as image and map data associated to each plot. The field plot data set in MS-NFI- consisted of field plots on land, of which field plots with centre point on NFI forestry land (land use classes ) and on the the combined forest land, poorly produc ve forest land and unproduc ve land (land use classes ). All NFI plots were located using GPS. The satellite images are from a different date than the field work. This means that there may be large differences between the state of the plot at me of field work and at the me of imaging. An example is clear-cut between the dates. In these cases the image data and field data should not be
22 used as such because of the incompa bility of the field data and image data. This incompa bility would increase the es ma on and predic on errors. In the first applica ons, we solved this problem by omi ng these plots from the field data. This, however, changes the distribu on of the field data and this tends to reflect in the predic on results. A typical case is clear-cut between the measurement date of the field data and imaging date. In this case, a high-volume plot is removed from the field data lowering the average volume of the predic on results. Another problem is that the field data have been collected during five years wherefore the average date of the field data is about two years before the target imaging date. This means that the predic on results reflect, on average, the me two years before the images. The distribu ons of the forest variables correspond to the imaging dates. We have done previously several a empts to computa onally update the field data. One version is presented in Tomppo et al. ( a). The result has always been that the predic on averages based on the updated field data have not been close enough to averages computed from newer field data. In those experiments, we have tried to use tree level growth models and to es mate the removals based on Forest Sta s cs (Me nfo ). To solve the problems men oned above, we decided to use a conserva ve par al upda ng controlled by the NFI field data and satellite images. The algorithm was designed to match the volume a er upda ng to the es mate computed from the field data only (Subsect... ). The data of individual field plots were modified according to the satellite image data and, in some cases, aerial photographs. If the plot was not cut between the field work and imaging, the growth models were applied to the growing stock variables. If the plot was iden fied as cut a er the field work, the forest variables were modified according to the cut type iden fied from the image data and the growth models were applied to this modified data. It was not possible to detect thinnings from image data and these cases are included into the growth models. The growth models were controlled so that the volume a er upda ng matched the target. The satellite images are from different dates and even different years. This means that the correc on for the cu ngs is different for different processing windows. Because of this, the upda ng was performed separately for each processing window Updating of the field plot data The upda ng target The simplest upda ng target would be the mean of the volume of the whole field data set. However, looking at the data from different years within the processing windows shows that, in many cases, this average does not represent well the volume at the target me of upda ng. One reason for this may be an increasing or decreasing trend visible in the volumes. The yearly averages within windows fluctuate so that using a single year average would not be a good solu on. Because of this, we decided to fit a regression line to the averages of the five years of field data. The predic ons computed with regression were visually compared to the averages computed from the field data for each year. The predic ons looked reasonable in all cases in this work. However, the method may need to be refined later if cases will be found where the predic on does not look reasonable. Large changes The large changes at the field plots between the image data and the field data are mostly due to regenera on cuts, but include also, e.g., severe windfalls. These changes can t be handled by models, but can, in most cases, be iden fied by examining visually the field plot data and available image data. The field plot data can also be reasonably modified to reflect the state at the image date if the field work has been done before the image date. If the change has occurred a er image date but before field work, the field data can t be modified. In these cases, the plots were removed from the training material. The other cases were handled in the following way. First, the field plots were listed where these kind of changes poten ally occur. These plots included advanced thinning stands and mature stands, together with young thinning stands where volume was at least m 3 /ha. The image data at these
23 candidate plots was matched against image data from plots that were cut according to field data and the candidate plots were ordered according to decreasing similarity. The candidate plots were then visually checked using the satellite data and, if available, recent aerial photographs. The plots where image data did not visually match what was expected from the field plot data were selected for modifica on. The selected plots were classified to plots where some trees were le (natural regenera on cut), and plots with no trees (clear cut). The field plot data were changed according to the status of the field plot in the visual inspec on. All of the substands were combined in to one stand. This was because it was not possible in prac ce to reliably iden fy different changes for the different substands. The updated forest variables reflected partly the previous state of the center point stand. The dominant tree was retained and no other was assumed to survive. In case of clear cut, the volumes, basal area, mean height, mean diameter, mean age, and tree cover were zeroed. In case of natural regenera on cut, the changes were more complicated. The mean height, mean diameter and mean age were le intact. The volume was set to the mean of storeys of this type in the field data in this geographic regions ( m 3 /ha in Southern Finland and m 3 /ha elsewhere). The other volumes, basal area, canopy cover and biomasses where changed according to the change in volume. The main changes to field data were: development class: temporarily unstocked regenera on stand for plots with no trees, seedling tree or shelter tree stand for plots with some trees, randomized according to the ra o between seed tree and shelter tree cuts in NFI data from cut type: regenera on cut for ar ficial regenera on for plots without trees, regenera on cut for natural regenera on for plots with some trees field work date: midpoint between original field work date and image date, according to the growing season defini on (see subsec on Growth models) dominant tree : not changed, except when temporarily unstocked stand was changed to young seedling stand mean age, mean height, mean diameter: set to zero if no trees, otherwise unchanged volume: zero for plots without trees, m 3 /ha (Southern Finland) or m 3 /ha (otherwise) for plots with some trees second storey volume; zero other volumes, basal area, canopy cover: zero for plots without trees, otherwise put all to dominant (canopy cover for broad-leaved trees set only if dominant is broad-leaved) biomasses: dominant modified according to volume change, others set to zero Growth models Some key plot level (sub-plot level) and stand level variables were updated using growth models, in addi on to cu ng and natural mortality assessments (see subsec on.. ). The models were applied to each plot part and sub-plot stand separately when a plot intersected several stands (subsec on. ). The data were updated to the date July, independently of the date of the image acquisi on. Either exis ng growth models or own models, derived for this purpose, were used to es mate the increment from the date of the field measurements to July. The variables updated with the increments were the plot level mean volumes (m 3 /ha) by tree groups and mber assortments, plot level biomasses by the tree groups and tree compartments, canopy cover of all trees and separately for broad-leaved trees, as well as stand level variables, mean diameter, mean height and mean age and basal area of trees, as defined in the NFI. The increments of the stand level variables were es mated separately for the dominant tree storey and a possible second storey. The basal area is recorded in NFI also for all tree storeys. The development class of stand was checked and updated based on the changes in the growing stock. The phases in the increment es ma ons and models were as follows. The length of the increment period in days was calculated first for each field plot and was defined as the number of the days in
24 the growing season between the date of July and the date of the field measurement. It was assumed that the growing season starts on May and ends on August. The number of the days in the full season is thus. If the number of the days in this way was nega ve, that is, the field measurement date was a er July, the value of zero was selected for the length of the period. The number of the days in the increment period was changed to the number of growing seasons ( ) by dividing it by. The plot level volume increments were es mated using the stand level models by Nyyssönen and Mielikäinen ( ) for pine and spruce dominated tree layers. The models of pine dominated forests were used also for the broad-leaved dominated tree layers. The models were thus employed by tree storeys. The volumes by tree storeys at plot level were not available in the data. They were es mated as the shares of the plot level mean volume, the shares propor onal to the quan ty were is the basal area and the mean height of tree storey. The increased volumes by tree storeys were combined to the plot level volumes. The model had been es mated for the natural logarithm of the percentage of the volume increment (( )). The model for a pine dominated stand is ( ) = + 1 ( ) / ( ) 8 / { 4} ( ) (. ) where and are the age and mean diameter of the tree storey in ques on in a stand, the volume of the tree storey on a plot and { 4} ( ) the indicator func on of the site fer lity class ( ). The values of the parameters are: =., 1 =-., 2 =., 3 =-. and 4 =.. If was zero or missing, the parameters of the model had been es mated without, and are: =., 1 =-., 2 =. and 4 =.. The model for the percentage of the volume increment of a spruce dominated stand is (Nyyssönen and Mielikäinen ) ( ) = + 1 ( ) + 2 ( ) + 3 (( )( )) ( ) 2 / (( )) { 2} ( ) (. ) The values of the parameters are: =., 1 =-., 2 =-., 3 =., 4 =-., 5 =-. and 6 =.. If was zero or missing, the parameters of the model had been es- mated without, and are: =., 1 =., 2 =-., 3 =. and 4 =-., 6 = (site fer lity indicator was missing from the model). The increased volume of the tree storey in the end of the upda ng period, including the es mated increment over the upda ng period, was 2 = 1 (1+ /100) where 1 and 2 are the volume of the tree storey in the beginning and in the end of the period, the increment percentage form the model and as above, the number of growing seasons in years. The increased volume for a plot was the sum of the increased volumes of the dominant tree storey, the increased volume of a possible second storey and the original volume of a possible third tree storey. The third tree storey is quite uncommon and the significance of its possible volume to the volume negligible. The ra o / was used as a factor to calculate the volumes by tree groups and by mber assortments. Here is the original plot level volume. The same ra o / was used also to increase the variables canopy cover of trees and canopy cover of broad-leaved trees as well as biomasses by the tree groups and tree compartments. For the increment es mates of the other key variables, except the age of a tree storey of a stand, new models were derived using the permanent field plot data of NFI and NFI. The age was updated simply increasing the the assessed age by the number of the growing seasons. The mean diameter, mean height and basal area of a stand were updated also by tree storeys. The model for the logarithm of the rela ve diameter increment ( / ) was ( / ) = ( ) + 3 ( ) { =2} ( )+ 7 { =3} ( ) (. )
25 where is the annual mean diameter increment of the tree storey in ques on calculated from the successive measurements of field plot stands of NFI data, is the basal area of the trees of the tree storey in ques on, the effec ve temperature sum, { = } ( ), the indicator func on of tree groups, and the other variables as in Eqs.. and.. The tree groups were, pine and other coniferous than spruce ( ), spruce ( ) and broad-leaved The values of the parameters were =-., 1 =-., 2 =-., 3 =., 4 =-., 5 =., 6 =. and 7 =.. The model for the logarithm of the rela ve height increment ( / ) was ( / ) = ( ) + 3 ( ) (. ) where is the annual mean height increment of the tree storey in ques on calculated from the successive measurements of field plot stands of NFI data and the other variables as in Eqs..,. and.. The values of the parameters were =-., 1 =-., 2 =-., 3 =. and 4 =.. The model for the logarithm of the rela ve increment of the basal area of the trees of the storey in ques on( / ) was ( / ) = ( ) + 3 ( ) { =1} ( )+ 7 { =2} ( ) + 7 { =3} ( ) (. ) where is the annual basal area increment calculated from the successive measurements of field plot stands of NFI data and the other variables as in Eqs..,.,. and.. The values of the parameters were =. 1 =-. 2 =-. 3 =. 4 =. 5 =-. 6 =-. 7 =-. The model was applied to the basal areas of the stands by the tree storeys. Only the dominant tree storey and a possible second tree storey were updated using the increment models of the diameter, height and basal area. A possible third storey was not updated. The values of variables,, and by tree storeys on July were calculated in a same way as the volumes, that is, 2 = 1 (1 + ) where 1 and 2 are the value of the variable in the beginning and in the end of the period, the rela ve increment from the models and as above, the number of growing seasons in years. and are given in NFI data only by tree storeys, but also for all storeys together. The basal area of the stands was the sum of the basal areas of the tree storeys. The mean age was adjusted according to the years between the field data date and. Calibra on to the upda ng target The growth model results were calibrated to the upda ng target by mul plying the growing me with a mul plier. This mul plier was determined itera vely by compu ng the volume (m 3 ) a er the increment predic on and comparing the result to the upda ng target determined for the corresponding image. Upda ng of development class The following possible changes in the development class were considered from the date of the field measurement to the upda ng date (July, ): ) from temporarily unstocked regenera on stand to young seedling stand ) from shelter tree or seed tree stand to open area or young seedling stand ) from young seedling stand to advanced seedling stand ) from advanced seedling stand to young thinning stand ) from young thinning stand to advanced thinning stand ) from advanced thinning stand to mature stand.
26 For upda ng purposes, mainly to judge the development class of young seedling stand versus open area, we calculated the following four-dimensional distribu on i) cu ng me ii) development class iii) the effec ve temperature sum (three classes,,, ) iv) site fer lity. Only one effec ve temperature sum class was used for site fer lity class one due to the lack of the data. The means and standard devia ons of the mean diameter of tree storeys of stands by development classes were calculated for making decisions concerning possible transi ons. The transi on frequencies from regenera on cu ng, both ar ficial and natural, to the development class young seedling stand were es mated from the NFI data as a func on of cu ng me, effec ve temperature sum and site fer lity class. The transi ons were simulated based on the distribu on. The possible new development classes, in case of an open and temporarily unstocked regenera on stand for ar ficial regenera on, were temporarily unstocked regenera on stand and young seedling stand. This rule was used due to the short upda ng period. The longest upda ng period was four years. The distribu on of the dominant tree by site fer lity classes in young seedling stands were es mated from the NFI data from the years. The dominant tree was selected from this distribu on in case of transi on from a temporarily unstocked regenera on stand to young seedling stand. For natural regenera on (open area), the possible new development classes were, the one on the date of field measurement (shelter or seedling tree stand), open area and young seedling stand. The dominant tree for a possible young seedling stand was the one of the shelter tree / seedling tree stand. Dominant tree, mean diameter, mean height and age remained / were changed to those corresponding an temporarily unstocked regenera on stand ( ) if the result was a temporarily unstocked regenera on stand. To update case ), a possible transi on from young seedling stand to advanced seedling stand, the updated mean height was first checked using the original height and the height increment (Eq.. ). A simple model was derived to es mate the mean diameter as a func on of the height. Similarly, a simple model was es mated for the volume (m 3 /ha) as a func on of the mean height. The dominant tree remained as the same as in the date of the field measurements. The biomass es mates were updated respec vely. A possible change from the development class advanced seedling stand to young thinning stand was done as follows: the development class was up-graded if the updated mean diameter of a stand exceeded the average mean diameter of the young thinning stands by two standard devia ons of the mean diameters of those stands. A possible change from the development class young thinning to an advanced thinning stand was done similarly, as well as a possible change from an advanced thinning stand to a mature stand except in the la er case, the standard devia on of the development class mature stand was used, based on prac cal tests. 3.3 Preparation of the input data sets In the image analysis (Fig.. ), the input data sets were ) ground truth data, i.e., one record for each plot part and stand corresponding to a centre point of a plot, called here centre point stand and also for stands intersec ng other parts of a plot, called here sub-plot stand: a) field data and b) satellite image data, c) digital map data, d) and other numeric feature data in text format, ) a pre-processed satellite image, ) a digital map of land use classes and mire and open bog mask, ) a digital eleva on model and thereof derived image of the angle between terrain normal and sun illumina on, ) cloud and cloud shadow delinea on mask, ) large-area forest resource data and ) a map of computa on units to calculate small-area es mates (Fig.. ). The land class map was employed to dis nguish the combined forest land, poorly produc ve forest land and unproduc ve forest land (MS-NFI forestry land) from the other land classes. In this analysis, all
27
28
29 , ). The basic principles are listed here. With the k-nn method, the plot weights (Eq.. ) (not equal for each plot) are computed for each plot by computa on units, e.g., by municipali es (Tomppo ). The weights are computed for each field sample plot, where is the set of field plot parts, centre point plot part or sub-plot part, belonging to forestry land. These plot weights are sums of the weights that are computed for the field plots over all satellite image pixels on the forestry land mask of the computa on unit. The plot weights corresponding to a single pixel (Eq.. ), in turn, are computed by a non-parametric k-nn es ma on method (Tomppo,, Tomppo et al. b,, ).The method u lises the distance metric, defined in the current version in the feature space of the satellite image data and coarse scale forest variables. The nearest field plot pixels, in terms of, i.e., pixels that cover the centre of a field plot, are sought for each pixel under the forestry land mask of the cloud free satellite image area. Note that the plot parts belonging to non-fryl land categories are removed from the data set. The sum of the weights of the rest of the plot parts is scaled to one for each pixel. A maximum geographical distance is employed, if necessary, in order to avoid selec ng the nearest plots (spectrally similar plots) from a region in which the response of image variables to field variables is not equal to that of the pixel under considera on. This is due to, e.g., changing atmospheric condi ons or a large image frame. The feasible set of nearest neighbours for pixel is thus { (, ), (, ) max,,, ( ) = ( )} (. ) where (, ), is the geographical horizontal distance from pixel to pixel, is the distance in the are their maximum allowed values, and ( ) is the indicator func on of land class on the basis of map data (Tomppo,,, b, Ka la et al., Ka la and Tomppo, Tomppo et al. b,, ). Denote the nearest feasible field plots by 1 ( ),, ( ). The weight, of field plot to pixel is defined as ver cal direc on, (, ) and, = 1, / = 0 otherwise. 1, { 1 ( ),, ( )}, if and only if { 1 ( ),, ( )} (. ) The distance weigh ng power is a real number, usually [0, 2].A small quan ty, greater to zero, is added to when = 0 and { 1 ( ),, ( )}. The distance metric employed was 2, = 2, (,, ) 2 + 2, (,, ) 2 =1 =1 (. ) where, is the th normalised intensity value of the spectral band image variable, normalising done on the basis of digital eleva on model,, = 0, / cos ( ), with the angle between sun illumina on and terrain normal, the user given power for the cosine correc on,, the large area predic on of the lth applied forest variable, the number of image variables (or features), the number of coarse scale forest variables and, and, the weights for image features and coarse scale forest variables respec vely. The values of the weights, and, are computed by means of a gene c algorithm (Tomppo and Halme, Tomppo et al. b,, ). A pixel size of km by km is used in the coarse scale forest variable predic ons,. The first phase of the improved version of k-nn, ik-nn, is to run the op miza on algorithm by strata, e.g., mineral soil stratum and mire and bog stratum. The es ma on a er that is similar to the basic k-nn es ma on.
30 For compu ng forest parameter es mates for computa on units, sums of field plot weights to pixels,, are calculated by computa on units, for example, by municipali es, and by map stratum h over the pixels belonging to the unit. An example of a stratum could be mineral soil forestry land. The weight of the sub-plot of plot in forest stratum and in map stratum h to computa on unit is denoted,h, =, (. ) h where h is the set of the pixels in the map stratum h, is the pixel size and is the share of the field plot belonging to the forest stratum and map stratum h on forestry land. Reduced weight sums,h, are obtained from the formula., if clouds or their shadows cover a part of the area of the computa on unit. The real weight sum for plot is obtained expanding the weight (. ) by the ra o forestry land divided by the forestry land not covered by the clouds in each computa on unit. The weights (. ) are computed within forestry land separately for mineral soil stratum and peatland strata. The weights are also computed for other land classes, arable land, built-up land, roads and waters using the plots falling in the corresponding stratum if the stra fica on based map correc on method is employed Ka la and Tomppo ( ), and plots falling into forestry land map stratum if the calibra on method is used (Ka la et al. ). A er the final field plot weights to computa on units (,h, ) have been calculated, the ra o es ma- on is employed to obtain the small-area es mates (e.g., Cochran ( )). In this way, the es ma on is similar to that using field plot data only (Tomppo a, Tomppo et al. b,, ). Predic ons of some forest variables are wri en in the form of a digital map during the procedure. The land classes outside forestry land are transferred to map form predic ons directly from the digital map file. Within forestry land mask, the variables are predicted by the weighted averages of the k nearest neighbours (Tomppo, ). A pixel-level predic on of variable for pixel is defined as = h, /, (. ) where is the value of the forest variable on stand of plot, h the set of the field plots belonging to map stratum h, the share of the stand of plot and the set of the plot parts of plot belonging to forestry land. The mode or median value can be used instead of the weighted average for categorical variables. Mode has turned out to work be er than median in the prac cal tests (Tomppo et al. b). One special detail of the Finnish NFI is that some stand level variables are not recorded in the field for the plot parts not including a centre point of a plot in case there are no tally trees belonging those plot parts. The reason is that the area es mates are based on the numbers of the centre points while volumes are summed up from all tally trees in the stratum in ques on. The variables not recorded for the sub-plots without a centre point and without any tally tree are for example land class based on the FAO classifica on, main site class, site fer lity class, stand age, mean diameter of stand, mean height of stand, stand basal area, canopy cover of trees and canopy cover of broad-leaved trees. This fact is taken into account in the municipality level es mates in such a way that the missing value is imputed from the distribu on of the variable in ques on when the distribu on is calculated from a similar forest stratum. In pixel level predic ons, those plot parts are removed, that is, they are not included in set of Eq... The predicted variables in a map form are usually land class, main site class, site fer lity class, stand age, mean diameter of stand, mean height of stand, stand basal area, canopy cover of trees, canopy cover of broad-leaved trees and volumes by tree (pine, spruce, birch, other broad leaved trees) and by mber assortment classes as well as biomass by tree groups and tree compartments. The number of the maps in MS-NFI- and MS-NFI-OA- was therefore (Table. ).
31 Table. : The ik-nn es ma on parameters employed in MS-NFI-. Parameter Variables applied in the distance metric Distance metric Value of k Weights a ached to the nearest neighbours Restric ons for search of nearest neihbours Choice Illumina on corrected spectral values for satellite image bands and large area forest variable es mates Weighted Euclidean distance Weights propor onal to the inverse distance (t= ) Large area forest maps are used to direct the NN selec on. In addi on, the geographic distance between the pixel being processed and the acceptable reference plots was limited Selecting estimation parameters and their values for k-nn The basic principle of k-nn es ma on is straigh orward. However, prac ce has shown that the predic ons and es ma on errors depend to a large extent on the core es ma on parameters of the k-nn algorithm. These are:. the variables employed in the distance metric, spectral bands or their transforma ons, possible correc on for varia on in illumina on angle of the pixel based on eleva on varia on (slope, aspect) (Tomppo ). the distance metric (Tomppo and Halme ). the value of k (Ka la and Tomppo ). the weights to be a ached to the nearest neighbours, e.g., even weights or func ons of the used distance and powers (nega ve),. the variables employed in restric ng the area from which the nearest neighbours are sought for a pixel, e.g., a geographical reference area (Ka la and Tomppo ). In MS-NFI-, the country was divided into processing windows. A geographical distance limit was used in the largest image windows to prevent use of plots from different atmospheric imaging condi ons. the use of addi onal informa on, e.g., large area varia on of forest variables in the distance metric (Tomppo and Halme ),. the use of ancillary data in the es ma on, e.g., for stra fica on. The parameters and their values in MS-NFI- are given in Table.. The parameters are selected separately for each image (consis ng of one or more image frames, see Table. ). The criteria are the mean square error and bias of pixel level predic ons using leave-one-out cross valida on, and par cularly, the difference between areal es mates based on i) mul -source inventory and ii) on the field data based es mates and their sampling errors (Tomppo et al. b,, ). The differences of the areal es mates are assessed in terms of sampling error based on the field data plots (e.g., Ka la and Tomppo, Tomppo and Halme ). The values of the parameters usually vary by image depending on, e.g., imaging condi ons, number of available field plots and variability of forests. The selec ons are not independent. A change in one parameter affects the op mal value of the other parameter. A crucial factor concerning the accuracy of the es mates seems to be the performance of the gene c algorithm. It was slightly revised for MS-NFI- as an aim to control the weights of the feature variables coming out from the algorithm Area and volume estimates for small areas correction for map errors In the mul -source es ma on, numerical map data (see Sect... ) are employed to decrease es ma on errors. If the numerical map data would be error free, the computa on unit weights (Eq.. )
32 Map correction areas Figure. : The large regions used for calcula ng the error probabili es between land classes and map strata for MS-NFI-, and the boundaries of the s. Digital map data: Na onal Land Survey of Finland, licence MML/VIR/MYY//. could be calculated using pixels belonging to forestry land (according the map data) only. However, map data can be out-of-date, include loca on errors and does not correspond exactly to the defini ons of NFI land classes. Errors can also arise during the post-processing of map data. Two methods have been developed to reduce the effect of map errors on small-area mul -source forest resource es mates: a sta s cal calibra on method (Ka la et al., Ka la a) and a stra fied k-nn method (Ka la and Tomppo ). The calibra on method is based on the confusion matrix between land use classes of the field sample plots and corresponding map informa on. The bias in the land class or other cover es mates, obtained, e.g., from remote sensing or map data, can be corrected by means of the error probabili es expressed as a confusion matrix (Czaplewski and Ca s, Walsh and Burk ), assuming that the employed field sample are based on a sta s cal sampling design (Card ). The employed map strata are defined in such a way that each stratum is reasonably homogeneous with respect to the map errors and the NFI land class distribu on. This enables the use of the synthe c small-area es ma on method when correc ng map errors (Rao ). The method u lises the error and land class propor ons that have been es mated from a larger region. The large regions of municipali es were formed in such a way that the map errors would be as homogeneous as possible within the regions and within each stratum (Tomppo et al. ). Seventeen regions were used for map correc on (Fig.. ). In the MS-NFI-, NFI field plots from years were used to compute the confusion matrix. The method given in (Ka la et al. ) was used to calculate the calibrated field plot weights. The calibra on typically increases the mean volume es mates and decreases the FRYL area es mates for small areas, if FRYL is overrepresented on maps. Calibra on was carried out by groups of municipali es. Despite the rather simple idea of the calibra on, it is quite laborious when implemented in the MS-NFI.
33 The MS-NFI employs a topographic database for municipality boundaries, while the field inventory employs land and water areas from official sta s cs of the Finnish Land Survey (Suomen pinta-ala kunni ain ). The area informa on from the la er data source is more accurate and there are slight differences between the and land areas of municipali es from these two data sources. Hence, a er the correc on of map errors, the MS-NFI municipality land areas are calibrated to the official land areas. The calibra on coefficient is straigh orward, /, and this ra o is assumed to also hold for forestry land and the (calibrated or stra fied) weights, are mul plied by this coefficient. For the calibrated MS-NFI, the calibrated land area, must be first es mated (see Tomppo et al. b,, ). The calibra on to the official land areas is valid only for (random) devia ons between the two data sets and not for the case where real and significant boundary changes between municipali es have taken place in either of the two data sources Assessing the errors Deriving an error es mator for an arbitrary group of pixels has proven to be a challenging task. The problem can be divided into the deriva on of i) an error es mator for a pixel level predic on and ii) an error es mator for a parameter for an area of interest. Difficul es arise because:. errors depend on the actual value of the variable to be predicted and so pixel-level errors are spa ally dependent,. the variables measured or observed on the field plots are also spa ally dependent,. the spectral values of adjacent pixels of a satellite image are dependent due to the atmospheric proper es (sca ering) and imaging technique. Furthermore, several error sources make the error es ma on complex. Examples of such error sources are given in (Tomppo et al. b,, ). During the data processing phase in the Finnish MS-NFI, the pixel-level root mean square error (RMSE) and the pixel level average bias are calculated using leave-one-out cross-valida on using the available field plots. This is also a part of the employed gene c algorithm and the selec on of the es ma on parameters of k-nn and ik-nn. For a sufficiently large area consis ng of a group of pixels, e.g., for areas of ha, the MS-NFI es mates are compared to the es mates and error es mates based solely on field data. Some empirical error es mates are also available for reliability assessments (Ka la b, Tomppo et al. a,b,, ). Standard error es mates for groups of pixels are calculated as described in Tomppo et al. ( b,, ). Some recent developments in error es ma on, par cularly in model-based error es ma on are also presented in that publica on, see also (Kim and Tomppo, McRoberts and Tomppo, McRoberts et al., McRoberts et el., Magnussen et al. ). 4 Results 4.1 Forest resources by municipalities The primary results of MS-NFI are the forest resource es mates for municipali es. With the MS-NFI method, it is possible, at least in theory, to es mate for municipali es all the parameters that are usually es mated for the regions of the Forest Centre using field data only. The es mates are presented in Appendix Tables for the parameters whose es mates are considered to be sufficiently precise. These tables include the same parameters as the ones published for MS-NFI- (Tomppo et al. ) and MS-NFI- (Tomppo et al. ). In the result calcula on phase, the MS-NFI es mates for the groups of the municipali es and at region level of the Forest Centre were compared for the es mates and error es mates based on field data only in order to control possible significant errors, including biases. The
34 es ma on parameters were changed un l sa sfactory es mates were obtained. That is, the MS-NFI es mates of the key parameters, such as areas and volumes by tree, were within two standard errors of es mates based on the field data only. The es mates can be divided into area and volume es mates. Some tables present only area es mates, some only volume es mates and some volume es mates for sub-area categories of forest land or poorly produc ve forest land, together with area es mates of the sub-area categories. The es mates of the areas of forest land, poorly produc ve forest land and unproduc ve forest land (three forestry land categories) are given in Appendix Table a for the en re forestry land and in Appendix Table b for forestry land available for wood supply. A na onal classifica on is used for land classes, for defini ons of these classes and comparison to FAO land classes see Tomppo et al. ( a). The areas and propor ons of forestry land of mineral soils and peatland soils are given in Appendix Tables a separately for three forestry land categories, and the similar es mates for forestry land available for wood supply are given in Appendix Tables c. The Appendix Tables b and d show again the areas of forest land and poorly produc ve forest land on mineral soils and peatland soils, as in Appendix Tables a and b, and now also the mean volumes of the growing stock for the land categories of the tables. The dominant tree by municipali es are presented in Appendix Table a for forest land and in Appendix Table b for poorly produc ve forest land. The dominant tree is defined in the NFI for the field assessment as a stand-level variable. In NFI, it is the tree with the highest basal area for the development classes from young thinning stand to mature stand and seed tree and shelterwood stands, and is defined as the tree with highest number of stems capable of development in young and advanced seedling stands. The propor on of pine dominated forests of forest land is usually high in North Finland (Lappi), o en over %, and also in the many municipali es in Etelä-Pohjanmaa and Pohjois-Pohjanmaa. A high propor on of pine mires increases the area and propor on of pine dominated forests in Pohjanmaa region. The propor on is high also in some areas in South Finland in coastal regions and Central Finland in areas where Sub-xeric heath forests are common. Among the areas of the regions of the Forest Centre, the propor on of spruce dominated forests on forest land is highest in South Finland in Häme-Uusimaa, %, and in Pirkanmaa and Etelä-Savo, a li le less than % with the highest municipality level es mates over % in Lempäälä and Vesilah. The stand age and the development class of a stand used in MS-NFI are defined in a same way as in the field inventory (Tomppo et al. a). The area es mates for age classes on forest land by municipali es is presented in Appendix Table a and for development classes in Appendix Table a. The propor on of forest land with a stand age not more than years varies by municipality in South Finland, from about % to about %, the regions level propor ons being around %, The propor onal area of young forests is high in Eastern and South-Eastern Finland, and also in some municipali es in Central Finland. The propor onal area of forest not more than years old is lower in North Finland than in South Finland. One should note that the same age in South Finland and North Finland corresponds to different development class of stand due to slower growth in the North than in the South. The mean volume and volume es mates are given in many different ways: mean volumes by tree and by mber assortments for combined forest land and poorly produc ve forest land ( a) likewise with volumes ( b). The similar es mates are given for forest land and poorly produc ve forest land available for wood supply in Appendix Tables c and d. Appendix Tables a d present the similar es mates for forest land as Appendix Tables a d for forest land and poorly produc ve forest land. Note that poorly produc ve forest land consists either of rocky soils, eld forests or less fer le peatland soils, such as oligo-ombrotrophic or ombrotrophic peatland, e.g., Sphagnum fuscum dominated peatland. Note that the water balance of peatland soil also affects the wood produc on capacity and land class of peatland. The mean volumes of the growing stock in the municipali es vary significantly by the regions of the Forest Centre and also within the regions. The mean volume es mates on forest land and forest and poorly produc ve forest land are given also separately for mineral soils and peatland soils in Appendix Table b, and for forest land and forest and poorly produc ve forest land available for wood supply in Appendix Table d. The mean volume es mates by age classes on forest land are given in Appendix Table b and the
35 MS-NFI-2013, mean volume, m³/ha Figure. : The mean volume of growing stock on forest and poorly produc ve forest land by municipali es. Digital map data: Na onal Land Survey of Finland, licence No. MML/VIR/MYY//. similar es mates for the forest land available for wood supply in Appendix Table d. The corresponding mean volume es mates by development classes on forest land are given in Appendix Tables b and d. The mean volume of the growing stock on combined forest land and poorly produc ve forest land by municipali es varies in Southernmost Finland is typically over or cubic metres per hectare (m 3 /ha) except in the municipali es in South coast and Åland region. In South Finland (Regions of the Forestry Centre, Fig.. ), the mean volume of growing stock by municipali es (Appendix Table a and Fig.. ) ranged from m³/ha in Kökar to m³/ha in Pälkäne and those for pine from m³/ha in Siilinjärvi to m³/ha in Naantali and those for spruce from m³/ha in Halsua and m³/ha in Vesilah and those for birch from m³/ha in Kökar to m³/ha in Vantaa. In North Finland (Regions of the Forestry Centre, Fig.. ), the respec ve ranges were from m³/ha in Utsjoki to m³/ha Nivala and those for pine from m³/ha in Utsjoki to m³/ha in Kalajoki and those for spruce from m³/ha in Utsjoki to m³/ha in Kemi and those for birch from m³/ha in Savukoski to m³/ha in Tornio. The mean volume of spruce saw log on combined forest land and poorly produc ve forest land and also on that available for wood supply by municipali es is naturally highest in the region in which spruce volume is highest, that is, in southern part of Central Finland, in regions of Häme-Uusimaa, and the southern regions of Keski-Suomi and Pohjois-Savo. The volume of pine saw log is rela vely high, near or over m 3 /ha, in some municipali es in South-West (Lounais-Suomi) and South-East (Kaakkois- Suomi) and Etelä-Savo, while the birch saw log, m 3 /ha in some municipali es in Häme-Uusimaa and Rannikko/Etelä-Rannikko (Appendix Tables a and c).
36 saw log Spruce saw log ha Total volume Municipality mill. m 3 Municipality mill. m 3 Municipality mill. m 3 Lieksa. Kuopio. Rovaniemi. Kuhmo. Mikkeli. Kuhmo. Mikkeli. Savonlinna. Lieksa. Rovaniemi. Kouvola. Suomussalmi. Ilomantsi. Hämeenlinna. Mikkeli. Savonlinna. Joensuu. Sodankylä. Suomussalmi. Jämsä. Inari. Joensuu. Leppävirta. Pudasjärvi. Kouvola. Sastamala. Kuusamo. Sodankylä. Pieksämäki. Kouvola. Table. : The TOP -municipali es of volume and volumes of pine and spruce saw log on forest and poorly produc ve forest land available for wood supply. The volumes of spruce, pine and birch saw log on forest and poorly produc ve forest land available for wood supply are presented in Fig... The largest spruce sawlog resources are in the eastern and southern Finland municipali es, while largest volumes of pine sawlog can be found in the eastern and northern Finland. One explana ons is that the area of the municipali es simply is larger in East and North Finland. However, most of these top -municipali es are also located in the regions in which mean volume of and the volume of sawlog are high, and where the propor on of forest land is high of all the land classes as well as propor on of forests available for wood supply. An interes ng phenomen is that many of these municipali es of the largest forest resources are regional centres or ci es with substan al popula on (Table. ) Biomass estimates and available energy wood Biomass es mates had been calculated for each field plot and plot part on forest land and poorly produc ve forest land in the NFI data for biomass and energy wood es ma on as follows. The biomass es mates in the field data by tree compartments (Table. ) were predicted first for sample trees on forest land and poorly produc ve forest land of NFI and then predicted for tally trees in a similar manner as the volumes. The biomass of the stem (including bark) was calculated from the volume of a stem using stem wood density models by (Repola et al. ). The biomass es mates of the other tree compartments were calculated using the models by Repola (, ) (Table. ). Note that the stem residual biomass is included to the stem biomass in the table. Tree level biomass predic ons were converted to kilograms per hectare (kg/ha), taking into account angle count sampling (Bi erlich sampling) basal area factor and the maximum radius of the plot. The biomass es mates by tree groups in young thinning stands (development class) are presented in Appendix Table a with a unit of Gg ( 9 g). The biomasses of stem and bark, branches and foliage were calculated using those field plots on which first commercial thinning was proposed for the first -year period or on which pre-commercial thinning was proposed and the treatment was already considered to be delayed in the corresponding stand. The propor on of the field plot biomass capable to be removed was es mated employing the field plot data and the basal area thresholds from the thinning regimes for mineral soils (Hyvän metsänhoidon suositukset ) and peatlands (Hyvän metsänhoidon suositukset turv le ), varying according to region (degree days), dominant tree and site class. First the dominant height of the field plot stand was es mated from stand mean height. The basal area removed was the the stand basal area minus basal area threshold value a er cu ng from the par cular thinning regime. The basal area removal percentage was converted to volume removal percentage using the rela ons of these two removals obtained from Mo stand simulator for corresponding regions, dominant tree and site classes (Hynynen et al. ). This percentage was used to es mate the biomass components removal for the selected field plots. Appendix Table c presents similar es mates to those in Appendix Table a
37 Table. : The compartments for tree biomass (Repola et al., Repola, ). Stem Bark Living branches Foliage Dead branches Stump Stem residual (from NFI mber assortment class propor ons and stem, and bark biomass) for land available for wood supply. The biomass es mates of mature forests are presented separately for branches, foliage and stem residuals, and stumps and large roots by tree groups in Appendix Table b and for land available for wood supply in Table d. In prac ce, only spruce stumps, branches and stem residuals are harvested from regenera on cu ng areas The biomass models employed here and in (Tomppo et al. ) were different from those used in MS-NFI- (Tomppo et al. a). The effect of the two sets of the models on the biomass es mates and differences is discussed in (Tomppo et al. ). The energy wood es mates represent energy wood poten al rather than the energy wood available in prac ce. The prac cal constraints in use and harves ng of energy wood, like minimum removal and other cu ng opera ons were not taken into account. For more details of deriving the biomass es mates and the reliability of the es mates, see (Tomppo et al. b). 4.2 Digital thematic output maps Thema c forest maps in raster format were produced for the most important forest variables: land class, main site class, site fer lity class, stand age, mean diameter and height of stands, stand basal area, canopy cover of trees, canopy cover of broad leaved trees and volumes by tree and mber assortments, for four tree or groups (pine, spruce, two birch combined, and other broad leaved tree ). Twelve volume maps were produced for volumes of saw mber, pulp wood and volume by tree groups and one for all together, without breaking down to saw mber and pulp wood. Twentyone thema c maps show the biomass es mates for three tree groups (pine, spruce, broad-leaved trees) and for seven tree compartments. Note that the biomass component stem residual is a part of biomass component stem and bark. The maps produced are georeferenced raster layers in ETRS-TM FIN coordinate system with a spa al resolu on of m by m (Table. ), and cover Finland as shown in Fig... The non-forestry land use cover was obtained from the digital land use map data and overlaid on the satellite image data during the es ma on phase. The ik-nn pixel-level predic ons were made for the rest of the area. An example of the volume thema c map is given in Fig.. c. The raster layers can be combined to produce new thema c maps, e.g., dominant tree and mean volume classes by tree dominance. More examples of digital thema c maps are given in Tomppo et al. ( b). Two kinds of map were made for the open access product: the viewable maps and the complete maps. The background map data has been replaced by a no-data value in both products. The viewable maps are -bit images where the forest variables have been classified into a small number of classes and colours have been assigned to the classes. These maps are available in viewing services like the Paikka etoikkuna of the Na onal Land Survey of Finland ( (Paikka etoikkuna a, b). The complete maps retain the full precision of the results in -bit raster data. These are available at (Metla ). Note that the sum and mean values calculated from raster layers could deviate, and also do deviate in most cases, from the area and volume es mates in the Appendix Tables, due to the correc ons for map errors. The forestry land area calculated from the maps is greater, and the mean volume es mates smaller, than those in the Appendix Tables in most cases (cf. Subsect... ). Par cularly, if the es mates are calculated for a specific stratum, e.g., the mean or volume for forests older than years, the
38 Table. : The es mated raster themes. Theme Biomass, spruce, living branches ( kg/ha) Biomass, spruce, stem residual ( kg/ha) Biomass, spruce, roots, d > cm ( kg/ha) Biomass, spruce, stump ( kg/ha) Biomass, spruce, dead branches ( kg/ha) Biomass, spruce, stem and bark ( kg/ha) Biomass, spruce, foliage ( kg/ha) Biomass, broad-leaved trees, living branches ( kg/ha) Biomass, broad-leaved trees, stem residual ( kg/ha) Biomass, broad-leaved trees, roots, d > cm ( kg/ha) Biomass, broad-leaved trees, stump ( kg/ha) Biomass, broad-leaved trees, dead branches ( kg/ha) Biomass, broad-leaved trees, stem and bark ( kg/ha) Biomass, broad-leaved trees, foliage ( kg/ha) Biomass, pine, living branches ( kg/ha) Biomass, pine, stem residual ( kg/ha) Biomass, pine, roots, d > cm ( kg/ha) Biomass, pine, stump ( kg/ha) Biomass, pine, dead branches ( kg/ha) Biomass, pine, stem and bark ( kg/ha) Biomass, pine, foliage ( kg/ha) Site main class ( ) Site fer lity class ( ) Land class ( ) Stand age (year) Stand mean diameter of (cm) Stand mean height (dm) Canopy cover (%) Canopy cover of broad-leaved trees (%) Stand basal area (m 2 /ha) Data source index, MSNFI Volume, birch (m 3 /ha) Volume, birch pulpwood (m 3 /ha) Volume, birch saw mber (m 3 /ha) Volume, spruce (m 3 /ha) Volume, spruce pulpwood (m 3 /ha) Volume, spruce saw mber (m 3 /ha) Volume, other broad-leaved trees (m 3 /ha) Volume, other broad-leaved trees pulpwood (m 3 /ha) Volume, other broad-leaved trees saw mber (m 3 /ha) Volume, pine (m 3 /ha) Volume, pine pulpwood (m 3 /ha) Volume, pine saw mber (m 3 /ha) Volume, the growing stock (m 3 /ha) small area es mates calculated using the weights (Eq.. ) may deviate significantly from the es mates calculated from the map layers. The reason is that there is a tendency towards the mean in the map form es mates while original field data are used in the small area es mates. For these reasons, it is recommended to use the small area approach in es ma on when es ma ng strata far from the mean of the variable. The open access product MS-NFI-OA- includes, besides the latest es mates, es mates from earlier mul source inventories. The propor on of pixels and area included from the different es mates is shown in Table.. The table shows that coverage of the latest year inventory is very good. Note that the here the area is the area under the forest mask derived from the topograhic database (see Sec on.. ) and it differs slightly from the area of forestry land computed from the field plot data in NFI ( ha from Finnish Sta s cal Yearbook of Forestry ( )). The forest resource maps produced in MS-NFI- are of slightly be er quality compared with
39 Source pixels ha % MSNFI-.. MSNFI-.. MSNFI-.. / Lapland.. / Enontekiö.... No data.. Total.. Table. : The propor ons of forest area from the different es mates in MS-NFI-OA-. the earlier versions. This is mainly due to the be er satellite images coming from the Landsat OLI instrument. The nominal spa al resolu on of the Landsat OLI data is the same as the Landsat TM and Landsat ETM+ data used in the earlier MS-NFI products. However, the new instrument is based on a detector matrix (pushbroom scanner) whereas the earlier instruments were rota ng (whiskbroom) scanners. The on-ground pixel footprint of the OLI scanner is the same in center of the swath and the edges of the swath (excluding the slight change due to the earth curvature). In the whiskbroom scanner, the footprint is larger near the edges of the swath. This is visualized in Fig.., where a sample of image data from both instruments is shown together with the es ma ons results from the same data. The radiometric resolu on of the OLI imager is be er than that of the TM imager. No clear improvement in the es ma on accuracy in the cross-valida on tests was not seen. The differences between the image composi on in MS-NFI- and MS-NFI- may have covered the possible changes in es mate quality.
40 MS-NFI-2013, pine log volume, 1000 m³ land available for wood supply MS-NFI-2013, spruce log volume, 1000 m³ land available for wood supply a) b) MS-NFI-2013, birch log volume, 1000 m³ land available for wood supply MS-NFI-2013, other deciduous tree log volume, 1000 m³ land available for wood supply c) d) Figure. : The saw log volume of pine (a), spruce (b), birch (c) and other deciduous (d) on forest and poorly produc ve forest land available for wood supply. Digital map data: Na onal Land Survey of Finland, licence No. MML/VIR/MYY//.


")

41 Figure. : Comparison of the Landsat TM and Landsat OLI data and results. The image patch is near the west edge of WRS frame / in Pohjanmaa. The image date is July,. The upper row shows a patch of image data from the TM (le ) and OLI (right) sensors. The displayed channels are red=nir, green=red, and blue=green. The lower row shows es ma on results, respec vely. The red channel shows the mean volume of birch, the green channel the mean volume of pine, and the blue channel the mean volume of spruce.
42 5 Discussion The development of the Finnish mul -source inventory (MS-NFI) method began in in the connec- on of the th Na onal Forest Inventory of Finland (NFI ). The method u lises satellite images, field data of the Na onal Forest Inventory (NFI) and digital map data. The methods and results of the first country-level MS-NFI, MS-NFI, are presented in (Tomppo et al. ). The revised methods and results, MS-NFI methods and results, corresponding to the ninth Na onal Forest Inventory ( ), were published in (Tomppo et al. b). The main purpose of the MS-NFI method is to obtain forest resource informa on for areas smaller than would be possible using only field data. The adopted k-nearest Neighbour es ma on method (k- NN) meets the requirements set to the method and the results. In addi on to the small area es mates, the MS-NFI provides predic ons of forest variables in map form. The method has been improved con nuously and new features have been added since its first implementa on. Similar development work is being carried out in several other countries. For MS-NFI- the NFI field plot data from years were used. Most of the images were from year (Table. ). The variables of field data were projected (updated) to a certain me point, in this case to July,. An approach based on stand level models were selected a er exploring different alterna ves (Subsect.., Tomppo et al. ). Exis ng models were used for volume increments. Models and their parameters for the increments of the other updated quan es were es mated for the MS-NFI purposes. The permanent sample plots of the NFI from years were used. Big changes on the NFI plots compared to the image data were interpreted. Some of them are difficult to detect. Thus some open ques ons s ll remain, in addi on to the precisions of the increment models. Examples, in addi on to the detec on of some big changes, such as regenera on cu ngs and heavy storm damages, the detec on of light storm damages and thinning cu ngs (not tried for this product). Furthermore, some one frames were from, some from due to the lack of the images from. Es mates corresponding exactly to July, are quite a challenging task. The pixel level predic on error is generally rather high in MS-NFI. The several error sources are listed in (Tomppo et al. b). For this ar cle, the es mates and pixel level predic ons were validated when selec ng the es ma on parameters comparing MS-NFI es mates and error es mates with those based on NFI field data using groups of municipali es. The most serious poten al risk in the applica on of MS-NFI method is the availability of relevant satellite images. An individual satellite image scene should be large enough to cover high enough number of field plots, preferably several thousands, to get sa sfactory ground truth data. On the other hand, the pixel size should not be larger than about metres. In addi on to the problems caused by clouds, the number of the natural resource satellites with suitable specifica ons for forest applica ons has not been large. ESA s Sen nel- A, launched in June, will improve the situa on and the launch of Sen nel- B (launch planned for Mid- ) will further improve coverage. However, Sen nel- A data is not available for Summer, which will probably be the target year for the next MS-NFI products. This ar cle is one in the series in which the MS-NFI es mates are calculated every second year for the greater part of the country and every fourth year for northernmost Finland. The future method development work will focus, in addi on to the decrease of all kinds of es ma on errors, to improve the consistency between the subsequent products. Now that there are three openly available products, users are increasingly interested in the trends observed by comparing the products. Up to now, the MS- NFI products have been independent but possibili es to use previous es mates to increase the reliability of current es mates will be inves gated. Acknowledgements The results presented in this ar cle presume the availability of forest inventory field data, amoun ng about to field plots on forestry land in NFI from, as well as func oning comput-
43 ing and data management facili es, all provided by Metla (currently Luke). The manuscript has been read and valuable improvements suggested by Dr Kari T. Korhonen. We thank all the individuals whose support has made this ar cle possible.
44 References Card, D.H Using known map category marginal frequencies to improve estimates of thematic map accuracy. Photogrammetric Engineering and Remote Sensing 48: Cochran, W.G Sampling techniques. Wiley. New York, 428 p. Czaplewski, R.L. & Catts, G.P Calibration of remotely sensed proportion or area estimates for misclassification error. Remote Sensing of Environment 39: Diemer, C., Lucaschewski, I., Spelsberg, G., Tomppo, E. & Pekkarinen, A Integration of terrestrial forest sample plot data, map information and satellite data, An operational multisource-inventory concept. In: Ranchin T, Wald L (ed.). Proceedings of the Third Conference Fusion of Earth Data: Merging Point Measurements, Raster Maps and Remotely Sensed Images. Sophia Antipolis, France, January 26 28, 2000, SEE /URISCA, Nice. p Finley, A.O. & McRoberts, R.E Efficient k-nearest neighbor searches for multi-source forest attribute mapping. Remote Sensing of Environment 112: Finley, A.O., McRoberts, R.E., & Ek, A.R Applying an efficient k nearest neighbor search to forest attribute imputation. Forest Science 52: Finnish Statistical Yearbook of Forestry Finnish Forest Research Institute, Vantaa, Finland, 428 p. Franco-Lopez, H., Ek, A.R. & Bauer, M.E Estimation and mapping of forest stand density, volume, and cover type using the k-nearest neighbors method. Remote Sensing of Environment 77: Gjertsen, A Accuracy of forest mapping based on Landsat TM data and a knn method. In: H. Olsson (ed.). Proceedings of ForestSat Borås, Sweden, 31 May 3 June p Available at: [Cited 17 Sep 2014]. Hagner, O. & Olsson, H Normalisation of Within-Scene Op-tical Depth Levels in Multispectral Satellite Imagery Using National Forest Inventory Plot Data. In: Proceedings from the 24th EARSeL Symposium, Workshop on Remote sensing of land use and land cover, Dubrovnik, Croatia, May 28 29, p Available at: symposium-Dubrovnik/pdf/335.pdf. [Cited 17 Sep 2014]. Henttonen, H VMI8:n Pohjois-Suomen otanta-asetelmien vertailu satelliittikuvatulkinnan avulla. Comparing of sampling designs through simulation. Finnish Forest Research Institute, 10 p. (In Finnish). Hynynen, J., Ojansuu R., Hökkä H., Siipilehto J., Salminen H., and Haapala P Models for predicting stand development in MELA system. Metsäntutkimuslaitoksen tiedonantoja 835. Vantaa, Finland. (In Finnish). Hyvän metsänhoidon suositukset Forestry Development Centre Tapio, Helsinki (In Finnish). Hyvän metsänhoidon suositukset turv le Forestry Development Centre Tapio, Helsinki (In Finnish). JHS 180: Content services for geographic information JHS-Public Administration Recommendation 180. Available at: abstracts#180 [cited 26 October 2015]. Katila, M. 2006a. Correcting map errors in forest inventory estimates for small areas. In: Kangas, A. & Maltamo, M, (ed.). Forest Inventory Methodology and Applications, Managing Forest Ecosystems Vol. 10. Springer, Dodrecht, The Netherlands p Katila, M. 2006b. Empirical errors of small area estimates from the multi-source National Forest Inventory in Eastern Finland. Silva Fennica 40(4): Katila, M. & Tomppo, E Selecting estimation parameters for the Finnish multi-source national forest inventory. Remote Sensing of Environment 76: Katila, M. & Tomppo E Stratification by ancillary data in multisource forest inventories employing k-nearest neighbour estimation. Canadian Journal of Forest Research 32(9): Katila, M., Heikkinen, J. & Tomppo, E Calibration of small-area estimates for map errors in multisource forest inventory. Cana-dian Journal of Forest Research 30: Kim, H.-J. & Tomppo, E Model-based prediction error uncertainty estimation for k-nn method. Remote Sensing of Environment 104: Korkeusmalli 25 m National Land Survey of Finland. Available at:
45 maanmittauslaitos.fi/digituotteet/korkeusmalli-25-m. [Cited 17 Sep 2014]. (In Finnish). Korhonen, L., Korhonen, K.T., Stenberg, P., Maltamo, M. & Rautiainen, M Local models for forest canopy cover with beta regression. Silva Fennica 41(4): Available at: fi/silvafennica/full/sf41/sf pdf [Cited 10 Dec 2015]. Korhonen, K.T., Ihalainen, A., Viiri, H., Heikkinen, J., Henttonen, H., Hotanen, J.-P., Mäkelä, H., Nevalainen, S. & Pitkänen, J Suomen metsät ja niiden kehitys Metsätieteen aikakauskirja 2013(3): Available at: fa13/fa htm. [Cited 8 Mar 2016]. (In Finnish). Koukal, T., Suppan, F. & Schneider, W The impact of radiometric calibration on knn predictions of forest attributes. In: Olsson, H. (ed.). Proceedings of ForestSat Borås, Sweden, 31 May 3 June p Available at: ff pdf. [Cited 17 Sep 2014]. Landsat Missions. USGS web site. [Cited 2 Nov 2015]. Lehto, J. & Leikola, M Käytännön metsätyypit. Kirjayhtymä, Helsinki (In Finnish), 96 p. Maanmittauslaitoksen maastotietokohteet (Feature catalog of the topographic database). National Land Survey of Finland, Helsinki, Finland. Available at: default/files/maastotietokohteet_2013.pdf. [Cited 17 Sep 2014].(In Finnish). Magnussen, S., McRoberts, R. & Tomppo, E.O Model-based mean square error estimators for k-nearest neighbour predictions and applications using remotely sensed data for forest inventories. Remote Sensing of Environment 113: Magnussen, S., McRoberts, R.E. & Tomppo, E.O A resampling variance estimator for the k nearest neighbours techniques. Canadian Journal of Forest Research 40: Maselli, F., Chirici, G., Bottai, L., Corona, P. & Marchetti, M Estimation of Mediterranean forest attributes by the application of k-nn procedures to multitemporal Landsat ETM+ images. International Journal of Remote Sensing 26: McRoberts, R.E A model-based approach to estimating forest area. Remote Sensing of Environment 103: McRoberts, R.E. & Tomppo, E.O Remote sensing support for national forest inventories. Remote Sensing of Environment 110: McRoberts, R.E., Nelson, M.D. & Wendt, D.G. 2002a. Stratified estimation of forest area using satellite imagery, inventory data, and the k-nearest Neighbors technique. Remote Sensing of Environment 82: McRoberts, R.E., Wendt, D.G., Nelson, M.D. & Hansen, M.H. 2002b. Using a land cover classification based on satellite imagery to improve the precision of forest inventory area estimates. Remote Sensing of Environment 81: McRoberts, R.E., Tomppo, E.O., Finley, A.O. & Heikkinen, J Estimating areal means and variances of forest attributes using the k-nearest Neighbors technique and satellite imagery. Remote Sensing of Environment 111: McRoberts, R.E., Cohen, W.B., Naesset, E., Stehman, S.V. & Tomppo, E.O Using remotely sensed data to construct and assess forest attribute maps and related special products. Scandinavian Journal of Forest Research 25: McRoberts, R.E., Tomppo, E.O.& Naesset, E Advances and emerging issues in national forest inventories. Scandinavian Journal of Forest Research 25: McRoberts, R.E., Magnussen, S., Tomppo, E.O. & Chirici, G Parametric, bootstrap, and jackknife variance estimators for the k-nearest Neighbors technique with illustrations using forest inventory and satellite image data. Remote Sensing of Environment 115: Metinfo Metinfo-forest information services, Finnish Forest Research Institute. Available at: http: // [Cited 17 Sep 2014]. Metla File service for publicly available data. [Cited 2 Nov 2015]. Nilsson, M Estimation of Forest Variables Using Satellite Image Data and Airborne Lidar. Ph.D. thesis, Swedish University of Agricultural Sciences, The Department of Forest Resorce Management and Geomatics, Acta Universitatis Agriculturae Sueciae. Silvestria 17, 84 p. Nyyssönen, A. & Mielikäinen, K Metsikön kasvun arviointi. Summary: Estimation of stand increment. Acta Forestalia Fennica p.
46 Paikkatietoikkuna. 2013a. [Cited 17 Sep 2014]. Paikkatietoikkuna. 2013b. [Cited 17 Sep 2014]. Rao, J.N.K Small Area Estimation. Wiley, New York. 313 p. Reese, H., Nilsson, M., Sandström, P. & Olsson, H Applictions using estimates of forest parameters derived from satellite and forest inventory data. Computers and Electronics in Agriculture 37: Reese, H., Nilsson M., Granqvist, Pahlén, T., Hagner, O., Joyce, S., Tingelöf, U., Egberth, M. & Olsson, H. (2003) Countrywide estimates of forest variables using satellite data and field data from the National Forest Inventory. Ambio 32: Repola, J Biomass equations for birch in Finland. Silva Fennica 42(4): Repola, J Biomass equations for Scots pine and Norway spruce in Finland. Silva Fennica 43(4): Repola, J., Ojansuu, R. & Kukkola, M Biomass functions forscots pine, Norway spruce and birch in Finland. Metlan työraportteja/working Papers of the Finnish Forest Research Institute p. Available at: [Cited 17 Sep 2014]. Suomen pinta-ala kunnittain (The area of Finland by municipalities) National Land Survey of Finland, Helsinki. Available at: pinta-alatkunnittain_2011.pdf. [Cited 17 Sep 2014]. (In Finnish). Tomppo, E Satellite Image-Based National Forest Inventory of Finland. The Photogrammetric Journal of Finland 12: Tomppo, E Satellite Image-Based National Forest Inventory of Finland. In: Proceedings of the symposium on Global and Environmental Monitoring, Techniques and Impacts, September 17-21, 1990 Victoria, British Columbia Canada. International Archives of Photogrammetry and Remote Sensing 28: Tomppo, E Satellite image aided forest site fertility estimation for forest income taxation. Acta Forestalia Fennica 229, 70 p. Tomppo, E Multi-source National Forest Inventory of Finland. In: Päivinen, R., Vanclay, J. & Miina, S. (ed.). New Thrusts in Forest Inventory. Proceedings of the subject group S Forest Resource Inventory and Monitoring and subject group S Remote Sensing Technology, vol. 1. IUFRO XX World Congress, 6 12 Aug. 1995, Tampere, Finland. European Forest Institute, Joensuu, Finland. p Tomppo, E. 2006a. The Finnish National Forest Inventory. In: Kangas, A. & Maltamo, M. (ed.). Forest inventory. Methodology and applications. Managing Forest Ecosystems Vol 10. Springer, Dordrecht, The Netherlands. p Tomppo, E. 2006b. The Finnish multi-source national forest inventory - small area estimation and map production. In: Kangas A., Maltamo M (ed.). Forest inventory. Methodology and applications, Managing Forest Ecosystems Vol 10. Springer, Dordrecht, The Netherlands p Tomppo, E. 2009a. The Finnish National Forest Inventory. In: McRoberts, R.E., Reams, G.A., Van Deusen, P.A. & McWilliams, W.H. (ed.). Proceedings of the Eighth Annual Forest Inventory and Analysis Symposium, Monterey, California, October 16 19, USDA Forest Service General Technical Report WO-79. p Tomppo, E. & Halme, M Using coarse scale forest variables as ancillary information and weighting of variables in k-nn estimation: a genetic algorithm approach. Remote Sensing of Environment 92: Tomppo, E., Katila, M., Moilanen, J., Mäkelä, H. & Peräsaari, J. 1998b. Kunnittaiset metsävaratiedot Folia Forestalia 4B/1998: (In Finnish). Tomppo, E., Goulding, C. & Katila, M Adapting Finnish multi-source forest inventory techniques to the New Zealand preharvest inventory. Scandinavian Journal of Forest Research 14: Tomppo, E., Korhonen, K.T., Heikkinen, J. & Yli-Kojola, H Multi-source inventory of the forests of the Hebei Forestry Bureau, Heilongjiang, China. Silva Fennica 35(3): Tomppo, E., Olsson, H., Ståhl, G., Nilsson, M., Hagner, O. & Katila, M. 2008a. Combining National Forest Inventory Field Plots and Remote Sensing Data for Forest Databases. Remote Sensing of Environment 112: Tomppo, E., Haakana, M., Katila, M. & Peräsaari J. 2008b. Multi-Source National Forest Inventory Meth-
47 ods and Applications. Springer. Series: Managing Forest Ecosystems, Vol , XIV. 374 p. Tomppo, E., Haakana, M., Katila, M., Mäkisara, K. & Peräsaari, J. 2009a. The multi-source National Forest Inventory of Finland - methods and results Metlan työraportteja/working Papers of the Finnish Forest Research Institute p. Available at: workingpapers/2009/mwp111-en.htm. [Cited 17 Sep 2014]. Tomppo, E., Gagliano, C., De Natale, F., Katila, M. & McRoberts, R.E. 2009b. Predicting categorical forest variables using an improved k-nearest Neighbour esimation and Landsat imagery. Remote Sensing of Environment 113: Tomppo, E., Heikkinen, J., Henttonen, H.M., Ihalainen, A., Katila, M., Mäkelä, H., Tuomainen, T. & Vainikainen, N. 2011a. Designing and conducting a forest inventory - case: 9th National Forest Inventory of Finland. Springer, Managing Forest Ecosystems p. Tomppo, E., Katila, M., Mäkisara, K. & Peräsaari, J The Multi-source National Forest Inventory of Finland methods and results Metlan työraportteja / Working Papers of the Finnish Forest Research Institute p. Tomppo, E., Katila, M., Mäkisara, K. & Peräsaari, J The Multi-source National Forest Inventory of Finland methods and results Metlan työraportteja / Working Papers of the Finnish Forest Research Institute p. Tomppo, E., Katila, M., Mäkisara, K. & Peräsaari, J The Multi-source National Forest Inventory of Finland methods and results Metlan työraportteja / Working Papers of the Finnish Forest Research Institute p. Walsh, T.A. & Burk, T.E Calibration of satellite classifications of land area. Remote Sensing of Environment 46: Valtakunnan metsien 11. inventointi. Maastotyön ohjeet Metsäntutkimuslaitos. Vantaa. (in Finnish). Ympäristöhallinnon paikkatietoaineistot, Koko Suomen kattavat aineistopaketit (The environmental GIS data of Finnish Environment Institute (SYKE) SYKE, Helsinki. Available at: ymparisto.fi/d3/aineistolataus.htm. [Cited 17 Sep 2014]. (In Finnish).
48 Appendix Table a. Area and propor on of land classes on forestry land by s Table b. Area and propor on of land classes on forest land available for wood supply by Forest Centre regions Table a. Area and propor on of mineral soils and peatlands by land classes and s Table b. Area and mean volume of growing stock on mineral soils and peatlands on forest land and forest and poorly produc ve forest land by s Table c. Area and propor on of forest available for wood supply on mineral soil and peatland by land classes and s Table d. Area and mean volume of forest available for wood supply on mineral soil and peatland on forest land and forest and poorly produc ve forest land by s Table a. Dominant tree on forest land by s Table b. Dominant tree on poorly produc ve forest land by s Table a. Age class distribu on on forest land by s Table b. The mean volume of growing stock in age classes on forest land by s Table c. Age class distribu on on forest land available for wood supply by s Table d. The mean volume of growing stock in age classes on forest land available for wood supply by s Table a. Development class distribu on on forest land by s Table b. The mean volume of growing stock in development classes on forest land by Forest Centre regions Table c. Development class distribu on on forest land available for wood supply by s Table d. The mean volume of growing stock in development classes on forest land available for wood supply by s Table a. The mean volume of growing stock by tree and roundwood assortment on forest and poorly produc ve forest land by s Table b. The growing stock volume by tree and roundwood assortment on forest land and poorly produc ve forest land by s Table c. The mean volume of growing stock by tree and roundwood assortment on forest and poorly produc ve forest land available for wood supply by s Table d. The growing stock volume by tree and roundwood assortment on forest land and poorly produc ve forest land available for wood supply by s Table a. The mean volume of growing stock by tree and roundwood assortment on forest land by s Table b. The growing stock volume by tree and roundwood assortment on forest land by Forest Centre regions Table c. The mean volume of growing stock by tree and roundwood assortment on forest land available for wood supply by s Table d. The growing stock volume by tree and roundwood assortment on forest land available for wood supply by s Table a. The biomass of the tree compartments available for energy wood by tree in young thinning stands on forest land by s. Stands with proposed cu ng for the first -year period selected. The assessed removal by plot stand based on regional thinning regimes Table b. The biomass of the tree compartments available for energy wood by tree in mature stands on forest land by s Table c. The biomass of the tree compartments available for energy wood by tree in young thinning stands on forest land available for wood supply by s. Stands with proposed cu ng for the first -year period selected. The assessed removal by plot stand based on regional thinning regimes Table d. The biomass of the tree compartments available for energy wood by tree in mature stands on forest land available for wood supply by s Table. The biomass of tree compartments by tree on forest and poorly produc ve forest land by s
49 Table 1a. Area and proportion of land classes on forestry land by s. Poorly productive Unproductive Forest land forest land land Total Municipality ha % ha % ha % ha % Åland 035 Brändö Eckerö Finström Föglö Geta Hammarland Jomala Kumlinge Kökar Lemland Lumparland Mariehamn-Maarianhamina Saltvik Sottunga Sund Vårdö Total Rannikko/Etelärannikko 049 Espoo-Esbo Hanko-Hangö Helsinki-Helsingfors Vantaa-Vanda Ingå-Inkoo Kauniainen-Grankulla Kirkkonummi-Kyrkslätt Kemiönsaari Lapinjärvi-Lappträsk Loviisa-Lovisa Länsi-Turunmaa Porvoo-Borgå Raasepori Sipoo-Sibbo Siuntio-Sjundeå Total Rannikko/Pohjanmaan rannikko 231 Kaskinen-Kaskö Kokkola-Karleby Rannikko Korsnäs Kristinestad Kronoby-Kruunupyy Larsmo-Luoto Malax-Maalahti Korsholm-Mustasaari Närpes-Närpiö Jakobstad-Pietarsaari Pedersöre-Pedersören kunta Nykarleby-Uusikaarlepyy Vaasa-Vasa Vörå-Vöyri Total Lounais-Suomi 019 Aura Eura Eurajoki Harjavalta Honkajoki Huittinen Jämijärvi Kaarina Kankaanpää Karvia Kokemäki Koski T.l Kustavi Köyliö Laitila Lavia Lieto Loimaa Luvia Marttila Masku
50 Table 1a. Area and proportion of land classes on forestry land by s. Poorly productive Unproductive Forest land forest land land Total Municipality ha % ha % ha % ha % 484 Merikarvia Mynämäki Naantali Nakkila Nousiainen Oripää Paimio Pomarkku Pori Pyhäranta Pöytyä Raisio Rauma Rusko Salo Sauvo Siikainen Somero Säkylä Taivassalo Tarvasjoki Turku-Åbo Ulvila Uusikaupunki Vehmaa Total Häme-Uusimaa 016 Asikkala Askola Forssa Hartola Hattula Hausjärvi Hollola Humppila Hyvinkää Hämeenlinna Heinola Janakkala Jokioinen Järvenpää Karkkila Kerava Hämeenkoski Kärkölä Lahti Loppi Lohja Myrskylä-Mörskom Mäntsälä Nastola Nurmijärvi Orimattila Padasjoki Pornainen Pukkila Riihimäki Sysmä Tammela Tuusula Vihti Ypäjä Total Kaakkois-Suomi 075 Hamina Iitti Imatra Kotka Kouvola Lappeenranta Lemi Luumäki Miehikkälä
51 Table 1a. Area and proportion of land classes on forestry land by s. Poorly productive Unproductive Forest land forest land land Total Municipality ha % ha % ha % ha % 580 Parikkala Pyhtää-Pyttis Rautjärvi Ruokolahti Savitaipale Taipalsaari Virolahti Total Pirkanmaa 020 Akaa Hämeenkyrö Ikaalinen Juupajoki Kangasala Kihniö Lempäälä Mänttä-Vilppula Nokia Orivesi Parkano Pirkkala Punkalaidun Pälkäne Ruovesi Sastamala Tampere Urjala Valkeakoski Vesilahti Virrat Ylöjärvi Total Etelä-Savo 046 Enonkoski Heinävesi Hirvensalmi Joroinen Juva Kangasniemi Mikkeli Mäntyharju Pertunmaa Pieksämäki Puumala Rantasalmi Savonlinna Sulkava Total Etelä-Pohjanmaa 005 Alajärvi Alavus Evijärvi Halsua Ilmajoki Isojoki Isokyrö Jalasjärvi Kannus Karijoki Kauhajoki Kauhava Kaustinen Kokkola-Karleby E Kuortane Kurikka Laihia Lappajärvi Lapua Lestijärvi Perho Seinäjoki Soini Teuva
52 Table 1a. Area and proportion of land classes on forestry land by s. Poorly productive Unproductive Forest land forest land land Total Municipality ha % ha % ha % ha % 849 Toholampi Veteli Vimpeli Ähtäri Total Keski-Suomi 077 Hankasalmi Joutsa Jyväskylä Jämsä Kannonkoski Karstula Keuruu Kinnula Kivijärvi Konnevesi Kuhmoinen Kyyjärvi Laukaa Luhanka Multia Muurame Petäjävesi Pihtipudas Saarijärvi Toivakka Uurainen Viitasaari Äänekoski Total Pohjois-Savo 140 Iisalmi Juankoski Kaavi Keitele Kiuruvesi Kuopio Lapinlahti Leppävirta Maaninka Pielavesi Rautalampi Rautavaara Siilinjärvi Sonkajärvi Suonenjoki Tervo Tuusniemi Varkaus Vesanto Vieremä Total Pohjois-Karjala 146 Ilomantsi Joensuu Juuka Kitee Kontiolahti Outokumpu Lieksa Liperi Nurmes Polvijärvi Rääkkylä Tohmajärvi Valtimo Total Kainuu 105 Hyrynsalmi Kajaani Kuhmo Paltamo Puolanka
53 Table 1a. Area and proportion of land classes on forestry land by s. Poorly productive Unproductive Forest land forest land land Total Municipality ha % ha % ha % ha % 697 Ristijärvi Sotkamo Suomussalmi Vaala Total Pohjois-Pohjanmaa 009 Alavieska Haapajärvi Haapavesi Hailuoto Kalajoki Ii Kempele Kuusamo Kärsämäki Liminka Lumijoki Merijärvi Muhos Nivala Oulainen Oulu Pudasjärvi Pyhäjoki Pyhäsalmi Pyhäntä Raahe Reisjärvi Sievi Siikajoki Siikalatva Taivalkoski Tyrnävä Utajärvi Ylivieska Total Lapland 047 Enontekiö Inari Kemi Keminmaa Kittilä Kolari Kemijärvi Muonio Pelkosenniemi Posio Ranua Rovaniemi Salla Savukoski Simo Sodankylä Tervola Tornio Pello Utsjoki Ylitornio Total
54 Table 1b. Area and proportion of land classes on forest land available for wood supply by Forest Centre regions. Poorly productive Unproductive Forest land forest land land Total Municipality ha % ha % ha % ha % Åland 035 Brändö Eckerö Finström Föglö Geta Hammarland Jomala Kumlinge Kökar Lemland Lumparland Mariehamn-Maarianhamina Saltvik Sottunga Sund Vårdö Total Rannikko/Etelärannikko 049 Espoo-Esbo Hanko-Hangö Helsinki-Helsingfors Vantaa-Vanda Ingå-Inkoo Kauniainen-Grankulla Kirkkonummi-Kyrkslätt Kemiönsaari Lapinjärvi-Lappträsk Loviisa-Lovisa Länsi-Turunmaa Porvoo-Borgå Raasepori Sipoo-Sibbo Siuntio-Sjundeå Total Rannikko/Pohjanmaan rannikko 231 Kaskinen-Kaskö Kokkola-Karleby Rannikko Korsnäs Kristinestad Kronoby-Kruunupyy Larsmo-Luoto Malax-Maalahti Korsholm-Mustasaari Närpes-Närpiö Jakobstad-Pietarsaari Pedersöre-Pedersören kunta Nykarleby-Uusikaarlepyy Vaasa-Vasa Vörå-Vöyri Total Lounais-Suomi 019 Aura Eura Eurajoki Harjavalta Honkajoki Huittinen Jämijärvi Kaarina Kankaanpää Karvia Kokemäki Koski T.l Kustavi Köyliö Laitila Lavia Lieto Loimaa Luvia Marttila
55 Table 1b. Area and proportion of land classes on forest land available for wood supply by Forest Centre regions. Poorly productive Unproductive Forest land forest land land Total Municipality ha % ha % ha % ha % 481 Masku Merikarvia Mynämäki Naantali Nakkila Nousiainen Oripää Paimio Pomarkku Pori Pyhäranta Pöytyä Raisio Rauma Rusko Salo Sauvo Siikainen Somero Säkylä Taivassalo Tarvasjoki Turku-Åbo Ulvila Uusikaupunki Vehmaa Total Häme-Uusimaa 016 Asikkala Askola Forssa Hartola Hattula Hausjärvi Hollola Humppila Hyvinkää Hämeenlinna Heinola Janakkala Jokioinen Järvenpää Karkkila Kerava Hämeenkoski Kärkölä Lahti Loppi Lohja Myrskylä-Mörskom Mäntsälä Nastola Nurmijärvi Orimattila Padasjoki Pornainen Pukkila Riihimäki Sysmä Tammela Tuusula Vihti Ypäjä Total Kaakkois-Suomi 075 Hamina Iitti Imatra Kotka Kouvola Lappeenranta Lemi
56 Table 1b. Area and proportion of land classes on forest land available for wood supply by Forest Centre regions. Poorly productive Unproductive Forest land forest land land Total Municipality ha % ha % ha % ha % 441 Luumäki Miehikkälä Parikkala Pyhtää-Pyttis Rautjärvi Ruokolahti Savitaipale Taipalsaari Virolahti Total Pirkanmaa 020 Akaa Hämeenkyrö Ikaalinen Juupajoki Kangasala Kihniö Lempäälä Mänttä-Vilppula Nokia Orivesi Parkano Pirkkala Punkalaidun Pälkäne Ruovesi Sastamala Tampere Urjala Valkeakoski Vesilahti Virrat Ylöjärvi Total Etelä-Savo 046 Enonkoski Heinävesi Hirvensalmi Joroinen Juva Kangasniemi Mikkeli Mäntyharju Pertunmaa Pieksämäki Puumala Rantasalmi Savonlinna Sulkava Total Etelä-Pohjanmaa 005 Alajärvi Alavus Evijärvi Halsua Ilmajoki Isojoki Isokyrö Jalasjärvi Kannus Karijoki Kauhajoki Kauhava Kaustinen Kokkola-Karleby E Kuortane Kurikka Laihia Lappajärvi Lapua Lestijärvi Perho
57 Table 1b. Area and proportion of land classes on forest land available for wood supply by Forest Centre regions. Poorly productive Unproductive Forest land forest land land Total Municipality ha % ha % ha % ha % 743 Seinäjoki Soini Teuva Toholampi Veteli Vimpeli Ähtäri Total Keski-Suomi 077 Hankasalmi Joutsa Jyväskylä Jämsä Kannonkoski Karstula Keuruu Kinnula Kivijärvi Konnevesi Kuhmoinen Kyyjärvi Laukaa Luhanka Multia Muurame Petäjävesi Pihtipudas Saarijärvi Toivakka Uurainen Viitasaari Äänekoski Total Pohjois-Savo 140 Iisalmi Juankoski Kaavi Keitele Kiuruvesi Kuopio Lapinlahti Leppävirta Maaninka Pielavesi Rautalampi Rautavaara Siilinjärvi Sonkajärvi Suonenjoki Tervo Tuusniemi Varkaus Vesanto Vieremä Total Pohjois-Karjala 146 Ilomantsi Joensuu Juuka Kitee Kontiolahti Outokumpu Lieksa Liperi Nurmes Polvijärvi Rääkkylä Tohmajärvi Valtimo Total Kainuu 105 Hyrynsalmi
58 Table 1b. Area and proportion of land classes on forest land available for wood supply by Forest Centre regions. Poorly productive Unproductive Forest land forest land land Total Municipality ha % ha % ha % ha % 205 Kajaani Kuhmo Paltamo Puolanka Ristijärvi Sotkamo Suomussalmi Vaala Total Pohjois-Pohjanmaa 009 Alavieska Haapajärvi Haapavesi Hailuoto Kalajoki Ii Kempele Kuusamo Kärsämäki Liminka Lumijoki Merijärvi Muhos Nivala Oulainen Oulu Pudasjärvi Pyhäjoki Pyhäsalmi Pyhäntä Raahe Reisjärvi Sievi Siikajoki Siikalatva Taivalkoski Tyrnävä Utajärvi Ylivieska Total Lapland 047 Enontekiö Inari Kemi Keminmaa Kittilä Kolari Kemijärvi Muonio Pelkosenniemi Posio Ranua Rovaniemi Salla Savukoski Simo Sodankylä Tervola Tornio Pello Utsjoki Ylitornio Total
59 Table 2a. Area and proportion of mineral soils and peatlands by land classes and s. Forest land Poorly productive forest land Unproductive land Total Mineral soil Peatland Mineral soil Peatland Mineral soil Peatland Mineral soil Peatland Municipality ha % ha % ha % ha % ha % ha % ha % ha % Åland 035 Brändö Eckerö Finström Föglö Geta Hammarland Jomala Kumlinge Kökar Lemland Lumparland Mariehamn-Maarianhamina Saltvik Sottunga Sund Vårdö Total Rannikko/Etelärannikko 049 Espoo-Esbo Hanko-Hangö Helsinki-Helsingfors Vantaa-Vanda Ingå-Inkoo Kauniainen-Grankulla Kirkkonummi-Kyrkslätt Kemiönsaari Lapinjärvi-Lappträsk Loviisa-Lovisa Länsi-Turunmaa Porvoo-Borgå Raasepori Sipoo-Sibbo Siuntio-Sjundeå Total Rannikko/Pohjanmaan rannikko 231 Kaskinen-Kaskö Kokkola-Karleby Rannikko Korsnäs Kristinestad Kronoby-Kruunupyy Larsmo-Luoto Malax-Maalahti Korsholm-Mustasaari
60 Table 2a. Area and proportion of mineral soils and peatlands by land classes and s. Forest land Poorly productive forest land Unproductive land Total Mineral soil Peatland Mineral soil Peatland Mineral soil Peatland Mineral soil Peatland Municipality ha % ha % ha % ha % ha % ha % ha % ha % 545 Närpes-Närpiö Jakobstad-Pietarsaari Pedersöre-Pedersören kunta Nykarleby-Uusikaarlepyy Vaasa-Vasa Vörå-Vöyri Total Lounais-Suomi 019 Aura Eura Eurajoki Harjavalta Honkajoki Huittinen Jämijärvi Kaarina Kankaanpää Karvia Kokemäki Koski T.l Kustavi Köyliö Laitila Lavia Lieto Loimaa Luvia Marttila Masku Merikarvia Mynämäki Naantali Nakkila Nousiainen Oripää Paimio Pomarkku Pori Pyhäranta Pöytyä Raisio Rauma Rusko Salo
61 Table 2a. Area and proportion of mineral soils and peatlands by land classes and s. Forest land Poorly productive forest land Unproductive land Total Mineral soil Peatland Mineral soil Peatland Mineral soil Peatland Mineral soil Peatland Municipality ha % ha % ha % ha % ha % ha % ha % ha % 738 Sauvo Siikainen Somero Säkylä Taivassalo Tarvasjoki Turku-Åbo Ulvila Uusikaupunki Vehmaa Total Häme-Uusimaa 016 Asikkala Askola Forssa Hartola Hattula Hausjärvi Hollola Humppila Hyvinkää Hämeenlinna Heinola Janakkala Jokioinen Järvenpää Karkkila Kerava Hämeenkoski Kärkölä Lahti Loppi Lohja Myrskylä-Mörskom Mäntsälä Nastola Nurmijärvi Orimattila Padasjoki Pornainen Pukkila Riihimäki Sysmä Tammela
62 Table 2a. Area and proportion of mineral soils and peatlands by land classes and s. Forest land Poorly productive forest land Unproductive land Total Mineral soil Peatland Mineral soil Peatland Mineral soil Peatland Mineral soil Peatland Municipality ha % ha % ha % ha % ha % ha % ha % ha % 858 Tuusula Vihti Ypäjä Total Kaakkois-Suomi 075 Hamina Iitti Imatra Kotka Kouvola Lappeenranta Lemi Luumäki Miehikkälä Parikkala Pyhtää-Pyttis Rautjärvi Ruokolahti Savitaipale Taipalsaari Virolahti Total Pirkanmaa 020 Akaa Hämeenkyrö Ikaalinen Juupajoki Kangasala Kihniö Lempäälä Mänttä-Vilppula Nokia Orivesi Parkano Pirkkala Punkalaidun Pälkäne Ruovesi Sastamala Tampere Urjala Valkeakoski Vesilahti Virrat
63 Table 2a. Area and proportion of mineral soils and peatlands by land classes and s. Forest land Poorly productive forest land Unproductive land Total Mineral soil Peatland Mineral soil Peatland Mineral soil Peatland Mineral soil Peatland Municipality ha % ha % ha % ha % ha % ha % ha % ha % 980 Ylöjärvi Total Etelä-Savo 046 Enonkoski Heinävesi Hirvensalmi Joroinen Juva Kangasniemi Mikkeli Mäntyharju Pertunmaa Pieksämäki Puumala Rantasalmi Savonlinna Sulkava Total Etelä-Pohjanmaa 005 Alajärvi Alavus Evijärvi Halsua Ilmajoki Isojoki Isokyrö Jalasjärvi Kannus Karijoki Kauhajoki Kauhava Kaustinen Kokkola-Karleby E Kuortane Kurikka Laihia Lappajärvi Lapua Lestijärvi Perho Seinäjoki Soini Teuva Toholampi
64 Table 2a. Area and proportion of mineral soils and peatlands by land classes and s. Forest land Poorly productive forest land Unproductive land Total Mineral soil Peatland Mineral soil Peatland Mineral soil Peatland Mineral soil Peatland Municipality ha % ha % ha % ha % ha % ha % ha % ha % 924 Veteli Vimpeli Ähtäri Total Keski-Suomi 077 Hankasalmi Joutsa Jyväskylä Jämsä Kannonkoski Karstula Keuruu Kinnula Kivijärvi Konnevesi Kuhmoinen Kyyjärvi Laukaa Luhanka Multia Muurame Petäjävesi Pihtipudas Saarijärvi Toivakka Uurainen Viitasaari Äänekoski Total Pohjois-Savo 140 Iisalmi Juankoski Kaavi Keitele Kiuruvesi Kuopio Lapinlahti Leppävirta Maaninka Pielavesi Rautalampi Rautavaara Siilinjärvi Sonkajärvi
65 Table 2a. Area and proportion of mineral soils and peatlands by land classes and s. Forest land Poorly productive forest land Unproductive land Total Mineral soil Peatland Mineral soil Peatland Mineral soil Peatland Mineral soil Peatland Municipality ha % ha % ha % ha % ha % ha % ha % ha % 778 Suonenjoki Tervo Tuusniemi Varkaus Vesanto Vieremä Total Pohjois-Karjala 146 Ilomantsi Joensuu Juuka Kitee Kontiolahti Outokumpu Lieksa Liperi Nurmes Polvijärvi Rääkkylä Tohmajärvi Valtimo Total Kainuu 105 Hyrynsalmi Kajaani Kuhmo Paltamo Puolanka Ristijärvi Sotkamo Suomussalmi Vaala Total Pohjois-Pohjanmaa 009 Alavieska Haapajärvi Haapavesi Hailuoto Kalajoki Ii Kempele Kuusamo Kärsämäki Liminka
66 Table 2a. Area and proportion of mineral soils and peatlands by land classes and s. Forest land Poorly productive forest land Unproductive land Total Mineral soil Peatland Mineral soil Peatland Mineral soil Peatland Mineral soil Peatland Municipality ha % ha % ha % ha % ha % ha % ha % ha % 436 Lumijoki Merijärvi Muhos Nivala Oulainen Oulu Pudasjärvi Pyhäjoki Pyhäsalmi Pyhäntä Raahe Reisjärvi Sievi Siikajoki Siikalatva Taivalkoski Tyrnävä Utajärvi Ylivieska Total Lapland 047 Enontekiö Inari Kemi Keminmaa Kittilä Kolari Kemijärvi Muonio Pelkosenniemi Posio Ranua Rovaniemi Salla Savukoski Simo Sodankylä Tervola Tornio Pello Utsjoki Ylitornio Total
67 Table 2b. Area and mean volume of growing stock on mineral soils and peatlands on forest land and forest and poorly productive forest land by s. Forest land Forest and poorly productive forest land Mineral soil Peatland Total Mineral soil Peatland Total Municipality ha m 3 /ha ha m 3 /ha ha m 3 /ha ha m 3 /ha ha m 3 /ha ha m 3 /ha Åland 035 Brändö Eckerö Finström Föglö Geta Hammarland Jomala Kumlinge Kökar Lemland Lumparland Mariehamn-Maarianhamina Saltvik Sottunga Sund Vårdö Total Rannikko/Etelärannikko 049 Espoo-Esbo Hanko-Hangö Helsinki-Helsingfors Vantaa-Vanda Ingå-Inkoo Kauniainen-Grankulla Kirkkonummi-Kyrkslätt Kemiönsaari Lapinjärvi-Lappträsk Loviisa-Lovisa Länsi-Turunmaa Porvoo-Borgå Raasepori Sipoo-Sibbo Siuntio-Sjundeå Total Rannikko/Pohjanmaan rannikko 231 Kaskinen-Kaskö Kokkola-Karleby Rannikko Korsnäs Kristinestad Kronoby-Kruunupyy Larsmo-Luoto Malax-Maalahti Korsholm-Mustasaari Närpes-Närpiö Jakobstad-Pietarsaari Pedersöre-Pedersören kunta Nykarleby-Uusikaarlepyy Vaasa-Vasa Vörå-Vöyri Total Lounais-Suomi 019 Aura Eura Eurajoki Harjavalta Honkajoki Huittinen Jämijärvi Kaarina Kankaanpää Karvia Kokemäki Koski T.l Kustavi Köyliö Laitila Lavia Lieto Loimaa Luvia Marttila Masku Merikarvia Mynämäki Naantali Nakkila Nousiainen Oripää Paimio Pomarkku
68 Table 2b. Area and mean volume of growing stock on mineral soils and peatlands on forest land and forest and poorly productive forest land by s. Forest land Forest and poorly productive forest land Mineral soil Peatland Total Mineral soil Peatland Total Municipality ha m 3 /ha ha m 3 /ha ha m 3 /ha ha m 3 /ha ha m 3 /ha ha m 3 /ha 609 Pori Pyhäranta Pöytyä Raisio Rauma Rusko Salo Sauvo Siikainen Somero Säkylä Taivassalo Tarvasjoki Turku-Åbo Ulvila Uusikaupunki Vehmaa Total Häme-Uusimaa 016 Asikkala Askola Forssa Hartola Hattula Hausjärvi Hollola Humppila Hyvinkää Hämeenlinna Heinola Janakkala Jokioinen Järvenpää Karkkila Kerava Hämeenkoski Kärkölä Lahti Loppi Lohja Myrskylä-Mörskom Mäntsälä Nastola Nurmijärvi Orimattila Padasjoki Pornainen Pukkila Riihimäki Sysmä Tammela Tuusula Vihti Ypäjä Total Kaakkois-Suomi 075 Hamina Iitti Imatra Kotka Kouvola Lappeenranta Lemi Luumäki Miehikkälä Parikkala Pyhtää-Pyttis Rautjärvi Ruokolahti Savitaipale Taipalsaari Virolahti Total Pirkanmaa 020 Akaa Hämeenkyrö Ikaalinen Juupajoki Kangasala Kihniö Lempäälä
69 Table 2b. Area and mean volume of growing stock on mineral soils and peatlands on forest land and forest and poorly productive forest land by s. Forest land Forest and poorly productive forest land Mineral soil Peatland Total Mineral soil Peatland Total Municipality ha m 3 /ha ha m 3 /ha ha m 3 /ha ha m 3 /ha ha m 3 /ha ha m 3 /ha 508 Mänttä-Vilppula Nokia Orivesi Parkano Pirkkala Punkalaidun Pälkäne Ruovesi Sastamala Tampere Urjala Valkeakoski Vesilahti Virrat Ylöjärvi Total Etelä-Savo 046 Enonkoski Heinävesi Hirvensalmi Joroinen Juva Kangasniemi Mikkeli Mäntyharju Pertunmaa Pieksämäki Puumala Rantasalmi Savonlinna Sulkava Total Etelä-Pohjanmaa 005 Alajärvi Alavus Evijärvi Halsua Ilmajoki Isojoki Isokyrö Jalasjärvi Kannus Karijoki Kauhajoki Kauhava Kaustinen Kokkola-Karleby E-Pohjanmaa Kuortane Kurikka Laihia Lappajärvi Lapua Lestijärvi Perho Seinäjoki Soini Teuva Toholampi Veteli Vimpeli Ähtäri Total Keski-Suomi 077 Hankasalmi Joutsa Jyväskylä Jämsä Kannonkoski Karstula Keuruu Kinnula Kivijärvi Konnevesi Kuhmoinen Kyyjärvi Laukaa Luhanka Multia Muurame Petäjävesi Pihtipudas
70 Table 2b. Area and mean volume of growing stock on mineral soils and peatlands on forest land and forest and poorly productive forest land by s. Forest land Forest and poorly productive forest land Mineral soil Peatland Total Mineral soil Peatland Total Municipality ha m 3 /ha ha m 3 /ha ha m 3 /ha ha m 3 /ha ha m 3 /ha ha m 3 /ha 729 Saarijärvi Toivakka Uurainen Viitasaari Äänekoski Total Pohjois-Savo 140 Iisalmi Juankoski Kaavi Keitele Kiuruvesi Kuopio Lapinlahti Leppävirta Maaninka Pielavesi Rautalampi Rautavaara Siilinjärvi Sonkajärvi Suonenjoki Tervo Tuusniemi Varkaus Vesanto Vieremä Total Pohjois-Karjala 146 Ilomantsi Joensuu Juuka Kitee Kontiolahti Outokumpu Lieksa Liperi Nurmes Polvijärvi Rääkkylä Tohmajärvi Valtimo Total Kainuu 105 Hyrynsalmi Kajaani Kuhmo Paltamo Puolanka Ristijärvi Sotkamo Suomussalmi Vaala Total Pohjois-Pohjanmaa 009 Alavieska Haapajärvi Haapavesi Hailuoto Kalajoki Ii Kempele Kuusamo Kärsämäki Liminka Lumijoki Merijärvi Muhos Nivala Oulainen Oulu Pudasjärvi Pyhäjoki Pyhäsalmi Pyhäntä Raahe Reisjärvi Sievi Siikajoki Siikalatva Taivalkoski
71 Table 2b. Area and mean volume of growing stock on mineral soils and peatlands on forest land and forest and poorly productive forest land by s. Forest land Forest and poorly productive forest land Mineral soil Peatland Total Mineral soil Peatland Total Municipality ha m 3 /ha ha m 3 /ha ha m 3 /ha ha m 3 /ha ha m 3 /ha ha m 3 /ha 859 Tyrnävä Utajärvi Ylivieska Total Lapland 047 Enontekiö Inari Kemi Keminmaa Kittilä Kolari Kemijärvi Muonio Pelkosenniemi Posio Ranua Rovaniemi Salla Savukoski Simo Sodankylä Tervola Tornio Pello Utsjoki Ylitornio Total
72 Table 2c. Area and proportion of forest available for wood supply on mineral soil and peatland by land classes and s. Forest land Poorly productive forest land Unproductive land Total Mineral soil Peatland Mineral soil Peatland Mineral soil Peatland Mineral soil Peatland Municipality ha % ha % ha % ha % ha % ha % ha % ha % Åland 035 Brändö Eckerö Finström Föglö Geta Hammarland Jomala Kumlinge Kökar Lemland Lumparland Mariehamn-Maarianhamina Saltvik Sottunga Sund Vårdö Total Rannikko/Etelärannikko 049 Espoo-Esbo Hanko-Hangö Helsinki-Helsingfors Vantaa-Vanda Ingå-Inkoo Kauniainen-Grankulla Kirkkonummi-Kyrkslätt Kemiönsaari Lapinjärvi-Lappträsk Loviisa-Lovisa Länsi-Turunmaa Porvoo-Borgå Raasepori Sipoo-Sibbo Siuntio-Sjundeå Total Rannikko/Pohjanmaan rannikko 231 Kaskinen-Kaskö Kokkola-Karleby Rannikko Korsnäs Kristinestad Kronoby-Kruunupyy Larsmo-Luoto Malax-Maalahti Korsholm-Mustasaari
73 Table 2c. Area and proportion of forest available for wood supply on mineral soil and peatland by land classes and s. Forest land Poorly productive forest land Unproductive land Total Mineral soil Peatland Mineral soil Peatland Mineral soil Peatland Mineral soil Peatland Municipality ha % ha % ha % ha % ha % ha % ha % ha % 545 Närpes-Närpiö Jakobstad-Pietarsaari Pedersöre-Pedersören kunta Nykarleby-Uusikaarlepyy Vaasa-Vasa Vörå-Vöyri Total Lounais-Suomi 019 Aura Eura Eurajoki Harjavalta Honkajoki Huittinen Jämijärvi Kaarina Kankaanpää Karvia Kokemäki Koski T.l Kustavi Köyliö Laitila Lavia Lieto Loimaa Luvia Marttila Masku Merikarvia Mynämäki Naantali Nakkila Nousiainen Oripää Paimio Pomarkku Pori Pyhäranta Pöytyä Raisio Rauma Rusko Salo
74 Table 2c. Area and proportion of forest available for wood supply on mineral soil and peatland by land classes and s. Forest land Poorly productive forest land Unproductive land Total Mineral soil Peatland Mineral soil Peatland Mineral soil Peatland Mineral soil Peatland Municipality ha % ha % ha % ha % ha % ha % ha % ha % 738 Sauvo Siikainen Somero Säkylä Taivassalo Tarvasjoki Turku-Åbo Ulvila Uusikaupunki Vehmaa Total Häme-Uusimaa 016 Asikkala Askola Forssa Hartola Hattula Hausjärvi Hollola Humppila Hyvinkää Hämeenlinna Heinola Janakkala Jokioinen Järvenpää Karkkila Kerava Hämeenkoski Kärkölä Lahti Loppi Lohja Myrskylä-Mörskom Mäntsälä Nastola Nurmijärvi Orimattila Padasjoki Pornainen Pukkila Riihimäki Sysmä Tammela
75 Table 2c. Area and proportion of forest available for wood supply on mineral soil and peatland by land classes and s. Forest land Poorly productive forest land Unproductive land Total Mineral soil Peatland Mineral soil Peatland Mineral soil Peatland Mineral soil Peatland Municipality ha % ha % ha % ha % ha % ha % ha % ha % 858 Tuusula Vihti Ypäjä Total Kaakkois-Suomi 075 Hamina Iitti Imatra Kotka Kouvola Lappeenranta Lemi Luumäki Miehikkälä Parikkala Pyhtää-Pyttis Rautjärvi Ruokolahti Savitaipale Taipalsaari Virolahti Total Pirkanmaa 020 Akaa Hämeenkyrö Ikaalinen Juupajoki Kangasala Kihniö Lempäälä Mänttä-Vilppula Nokia Orivesi Parkano Pirkkala Punkalaidun Pälkäne Ruovesi Sastamala Tampere Urjala Valkeakoski Vesilahti Virrat
76 Table 2c. Area and proportion of forest available for wood supply on mineral soil and peatland by land classes and s. Forest land Poorly productive forest land Unproductive land Total Mineral soil Peatland Mineral soil Peatland Mineral soil Peatland Mineral soil Peatland Municipality ha % ha % ha % ha % ha % ha % ha % ha % 980 Ylöjärvi Total Etelä-Savo 046 Enonkoski Heinävesi Hirvensalmi Joroinen Juva Kangasniemi Mikkeli Mäntyharju Pertunmaa Pieksämäki Puumala Rantasalmi Savonlinna Sulkava Total Etelä-Pohjanmaa 005 Alajärvi Alavus Evijärvi Halsua Ilmajoki Isojoki Isokyrö Jalasjärvi Kannus Karijoki Kauhajoki Kauhava Kaustinen Kokkola-Karleby E Kuortane Kurikka Laihia Lappajärvi Lapua Lestijärvi Perho Seinäjoki Soini Teuva Toholampi
77 Table 2c. Area and proportion of forest available for wood supply on mineral soil and peatland by land classes and s. Forest land Poorly productive forest land Unproductive land Total Mineral soil Peatland Mineral soil Peatland Mineral soil Peatland Mineral soil Peatland Municipality ha % ha % ha % ha % ha % ha % ha % ha % 924 Veteli Vimpeli Ähtäri Total Keski-Suomi 077 Hankasalmi Joutsa Jyväskylä Jämsä Kannonkoski Karstula Keuruu Kinnula Kivijärvi Konnevesi Kuhmoinen Kyyjärvi Laukaa Luhanka Multia Muurame Petäjävesi Pihtipudas Saarijärvi Toivakka Uurainen Viitasaari Äänekoski Total Pohjois-Savo 140 Iisalmi Juankoski Kaavi Keitele Kiuruvesi Kuopio Lapinlahti Leppävirta Maaninka Pielavesi Rautalampi Rautavaara Siilinjärvi Sonkajärvi
78 Table 2c. Area and proportion of forest available for wood supply on mineral soil and peatland by land classes and s. Forest land Poorly productive forest land Unproductive land Total Mineral soil Peatland Mineral soil Peatland Mineral soil Peatland Mineral soil Peatland Municipality ha % ha % ha % ha % ha % ha % ha % ha % 778 Suonenjoki Tervo Tuusniemi Varkaus Vesanto Vieremä Total Pohjois-Karjala 146 Ilomantsi Joensuu Juuka Kitee Kontiolahti Outokumpu Lieksa Liperi Nurmes Polvijärvi Rääkkylä Tohmajärvi Valtimo Total Kainuu 105 Hyrynsalmi Kajaani Kuhmo Paltamo Puolanka Ristijärvi Sotkamo Suomussalmi Vaala Total Pohjois-Pohjanmaa 009 Alavieska Haapajärvi Haapavesi Hailuoto Kalajoki Ii Kempele Kuusamo Kärsämäki Liminka
79 Table 2c. Area and proportion of forest available for wood supply on mineral soil and peatland by land classes and s. Forest land Poorly productive forest land Unproductive land Total Mineral soil Peatland Mineral soil Peatland Mineral soil Peatland Mineral soil Peatland Municipality ha % ha % ha % ha % ha % ha % ha % ha % 436 Lumijoki Merijärvi Muhos Nivala Oulainen Oulu Pudasjärvi Pyhäjoki Pyhäsalmi Pyhäntä Raahe Reisjärvi Sievi Siikajoki Siikalatva Taivalkoski Tyrnävä Utajärvi Ylivieska Total Lapland 047 Enontekiö Inari Kemi Keminmaa Kittilä Kolari Kemijärvi Muonio Pelkosenniemi Posio Ranua Rovaniemi Salla Savukoski Simo Sodankylä Tervola Tornio Pello Utsjoki Ylitornio Total
80 Table 2d. Area and mean volume of forest available for wood supply on mineral soil and peatland on forest land and forest and poorly productive forest land by s. Forest land Forest and poorly productive forest land Mineral soil Peatland Total Mineral soil Peatland Total Municipality ha m 3 /ha ha m 3 /ha ha m 3 /ha ha m 3 /ha ha m 3 /ha ha m 3 /ha Åland 035 Brändö Eckerö Finström Föglö Geta Hammarland Jomala Kumlinge Kökar Lemland Lumparland Mariehamn-Maarianhamina Saltvik Sottunga Sund Vårdö Total Rannikko/Etelärannikko 049 Espoo-Esbo Hanko-Hangö Helsinki-Helsingfors Vantaa-Vanda Ingå-Inkoo Kauniainen-Grankulla Kirkkonummi-Kyrkslätt Kemiönsaari Lapinjärvi-Lappträsk Loviisa-Lovisa Länsi-Turunmaa Porvoo-Borgå Raasepori Sipoo-Sibbo Siuntio-Sjundeå Total Rannikko/Pohjanmaan rannikko 231 Kaskinen-Kaskö Kokkola-Karleby Rannikko Korsnäs Kristinestad Kronoby-Kruunupyy Larsmo-Luoto Malax-Maalahti Korsholm-Mustasaari Närpes-Närpiö Jakobstad-Pietarsaari Pedersöre-Pedersören kunta Nykarleby-Uusikaarlepyy Vaasa-Vasa Vörå-Vöyri Total Lounais-Suomi 019 Aura Eura Eurajoki Harjavalta Honkajoki Huittinen Jämijärvi Kaarina Kankaanpää Karvia Kokemäki Koski T.l Kustavi Köyliö Laitila Lavia Lieto Loimaa Luvia Marttila Masku Merikarvia Mynämäki Naantali Nakkila Nousiainen Oripää Paimio Pomarkku
81 Table 2d. Area and mean volume of forest available for wood supply on mineral soil and peatland on forest land and forest and poorly productive forest land by s. Forest land Forest and poorly productive forest land Mineral soil Peatland Total Mineral soil Peatland Total Municipality ha m 3 /ha ha m 3 /ha ha m 3 /ha ha m 3 /ha ha m 3 /ha ha m 3 /ha 609 Pori Pyhäranta Pöytyä Raisio Rauma Rusko Salo Sauvo Siikainen Somero Säkylä Taivassalo Tarvasjoki Turku-Åbo Ulvila Uusikaupunki Vehmaa Total Häme-Uusimaa 016 Asikkala Askola Forssa Hartola Hattula Hausjärvi Hollola Humppila Hyvinkää Hämeenlinna Heinola Janakkala Jokioinen Järvenpää Karkkila Kerava Hämeenkoski Kärkölä Lahti Loppi Lohja Myrskylä-Mörskom Mäntsälä Nastola Nurmijärvi Orimattila Padasjoki Pornainen Pukkila Riihimäki Sysmä Tammela Tuusula Vihti Ypäjä Total Kaakkois-Suomi 075 Hamina Iitti Imatra Kotka Kouvola Lappeenranta Lemi Luumäki Miehikkälä Parikkala Pyhtää-Pyttis Rautjärvi Ruokolahti Savitaipale Taipalsaari Virolahti Total Pirkanmaa 020 Akaa Hämeenkyrö Ikaalinen Juupajoki Kangasala Kihniö Lempäälä
82 Table 2d. Area and mean volume of forest available for wood supply on mineral soil and peatland on forest land and forest and poorly productive forest land by s. Forest land Forest and poorly productive forest land Mineral soil Peatland Total Mineral soil Peatland Total Municipality ha m 3 /ha ha m 3 /ha ha m 3 /ha ha m 3 /ha ha m 3 /ha ha m 3 /ha 508 Mänttä-Vilppula Nokia Orivesi Parkano Pirkkala Punkalaidun Pälkäne Ruovesi Sastamala Tampere Urjala Valkeakoski Vesilahti Virrat Ylöjärvi Total Etelä-Savo 046 Enonkoski Heinävesi Hirvensalmi Joroinen Juva Kangasniemi Mikkeli Mäntyharju Pertunmaa Pieksämäki Puumala Rantasalmi Savonlinna Sulkava Total Etelä-Pohjanmaa 005 Alajärvi Alavus Evijärvi Halsua Ilmajoki Isojoki Isokyrö Jalasjärvi Kannus Karijoki Kauhajoki Kauhava Kaustinen Kokkola-Karleby E-Pohjanmaa Kuortane Kurikka Laihia Lappajärvi Lapua Lestijärvi Perho Seinäjoki Soini Teuva Toholampi Veteli Vimpeli Ähtäri Total Keski-Suomi 077 Hankasalmi Joutsa Jyväskylä Jämsä Kannonkoski Karstula Keuruu Kinnula Kivijärvi Konnevesi Kuhmoinen Kyyjärvi Laukaa Luhanka Multia Muurame Petäjävesi Pihtipudas
83 Table 2d. Area and mean volume of forest available for wood supply on mineral soil and peatland on forest land and forest and poorly productive forest land by s. Forest land Forest and poorly productive forest land Mineral soil Peatland Total Mineral soil Peatland Total Municipality ha m 3 /ha ha m 3 /ha ha m 3 /ha ha m 3 /ha ha m 3 /ha ha m 3 /ha 729 Saarijärvi Toivakka Uurainen Viitasaari Äänekoski Total Pohjois-Savo 140 Iisalmi Juankoski Kaavi Keitele Kiuruvesi Kuopio Lapinlahti Leppävirta Maaninka Pielavesi Rautalampi Rautavaara Siilinjärvi Sonkajärvi Suonenjoki Tervo Tuusniemi Varkaus Vesanto Vieremä Total Pohjois-Karjala 146 Ilomantsi Joensuu Juuka Kitee Kontiolahti Outokumpu Lieksa Liperi Nurmes Polvijärvi Rääkkylä Tohmajärvi Valtimo Total Kainuu 105 Hyrynsalmi Kajaani Kuhmo Paltamo Puolanka Ristijärvi Sotkamo Suomussalmi Vaala Total Pohjois-Pohjanmaa 009 Alavieska Haapajärvi Haapavesi Hailuoto Kalajoki Ii Kempele Kuusamo Kärsämäki Liminka Lumijoki Merijärvi Muhos Nivala Oulainen Oulu Pudasjärvi Pyhäjoki Pyhäsalmi Pyhäntä Raahe Reisjärvi Sievi Siikajoki Siikalatva Taivalkoski
84 Table 2d. Area and mean volume of forest available for wood supply on mineral soil and peatland on forest land and forest and poorly productive forest land by s. Forest land Forest and poorly productive forest land Mineral soil Peatland Total Mineral soil Peatland Total Municipality ha m 3 /ha ha m 3 /ha ha m 3 /ha ha m 3 /ha ha m 3 /ha ha m 3 /ha 859 Tyrnävä Utajärvi Ylivieska Total Lapland 047 Enontekiö Inari Kemi Keminmaa Kittilä Kolari Kemijärvi Muonio Pelkosenniemi Posio Ranua Rovaniemi Salla Savukoski Simo Sodankylä Tervola Tornio Pello Utsjoki Ylitornio Total
85 Table 3a. Dominant tree on forest land by s. broadleaved tree Treeless Spruce Total Municipality ha % ha % ha % ha % ha % ha % Åland 035 Brändö Eckerö Finström Föglö Geta Hammarland Jomala Kumlinge Kökar Lemland Lumparland Mariehamn-Maarianhamina Saltvik Sottunga Sund Vårdö Total Rannikko/Etelärannikko 049 Espoo-Esbo Hanko-Hangö Helsinki-Helsingfors Vantaa-Vanda Ingå-Inkoo Kauniainen-Grankulla Kirkkonummi-Kyrkslätt Kemiönsaari Lapinjärvi-Lappträsk Loviisa-Lovisa Länsi-Turunmaa Porvoo-Borgå Raasepori Sipoo-Sibbo Siuntio-Sjundeå Total Rannikko/Pohjanmaan rannikko 231 Kaskinen-Kaskö Kokkola-Karleby Rannikko Korsnäs Kristinestad Kronoby-Kruunupyy Larsmo-Luoto Malax-Maalahti Korsholm-Mustasaari Närpes-Närpiö Jakobstad-Pietarsaari Pedersöre-Pedersören kunta Nykarleby-Uusikaarlepyy Vaasa-Vasa Vörå-Vöyri Total Lounais-Suomi 019 Aura Eura Eurajoki Harjavalta Honkajoki Huittinen Jämijärvi Kaarina Kankaanpää Karvia Kokemäki Koski T.l Kustavi Köyliö Laitila Lavia Lieto Loimaa Luvia Marttila Masku Merikarvia Mynämäki Naantali Nakkila Nousiainen Oripää Paimio Pomarkku
86 Table 3a. Dominant tree on forest land by s. broadleaved tree Treeless Spruce Total Municipality ha % ha % ha % ha % ha % ha % 609 Pori Pyhäranta Pöytyä Raisio Rauma Rusko Salo Sauvo Siikainen Somero Säkylä Taivassalo Tarvasjoki Turku-Åbo Ulvila Uusikaupunki Vehmaa Total Häme-Uusimaa 016 Asikkala Askola Forssa Hartola Hattula Hausjärvi Hollola Humppila Hyvinkää Hämeenlinna Heinola Janakkala Jokioinen Järvenpää Karkkila Kerava Hämeenkoski Kärkölä Lahti Loppi Lohja Myrskylä-Mörskom Mäntsälä Nastola Nurmijärvi Orimattila Padasjoki Pornainen Pukkila Riihimäki Sysmä Tammela Tuusula Vihti Ypäjä Total Kaakkois-Suomi 075 Hamina Iitti Imatra Kotka Kouvola Lappeenranta Lemi Luumäki Miehikkälä Parikkala Pyhtää-Pyttis Rautjärvi Ruokolahti Savitaipale Taipalsaari Virolahti Total Pirkanmaa 020 Akaa Hämeenkyrö Ikaalinen Juupajoki Kangasala Kihniö Lempäälä
87 Table 3a. Dominant tree on forest land by s. broadleaved tree Treeless Spruce Total Municipality ha % ha % ha % ha % ha % ha % 508 Mänttä-Vilppula Nokia Orivesi Parkano Pirkkala Punkalaidun Pälkäne Ruovesi Sastamala Tampere Urjala Valkeakoski Vesilahti Virrat Ylöjärvi Total Etelä-Savo 046 Enonkoski Heinävesi Hirvensalmi Joroinen Juva Kangasniemi Mikkeli Mäntyharju Pertunmaa Pieksämäki Puumala Rantasalmi Savonlinna Sulkava Total Etelä-Pohjanmaa 005 Alajärvi Alavus Evijärvi Halsua Ilmajoki Isojoki Isokyrö Jalasjärvi Kannus Karijoki Kauhajoki Kauhava Kaustinen Kokkola-Karleby E-Pohjanmaa Kuortane Kurikka Laihia Lappajärvi Lapua Lestijärvi Perho Seinäjoki Soini Teuva Toholampi Veteli Vimpeli Ähtäri Total Keski-Suomi 077 Hankasalmi Joutsa Jyväskylä Jämsä Kannonkoski Karstula Keuruu Kinnula Kivijärvi Konnevesi Kuhmoinen Kyyjärvi Laukaa Luhanka Multia Muurame Petäjävesi Pihtipudas
88 Table 3a. Dominant tree on forest land by s. broadleaved tree Treeless Spruce Total Municipality ha % ha % ha % ha % ha % ha % 729 Saarijärvi Toivakka Uurainen Viitasaari Äänekoski Total Pohjois-Savo 140 Iisalmi Juankoski Kaavi Keitele Kiuruvesi Kuopio Lapinlahti Leppävirta Maaninka Pielavesi Rautalampi Rautavaara Siilinjärvi Sonkajärvi Suonenjoki Tervo Tuusniemi Varkaus Vesanto Vieremä Total Pohjois-Karjala 146 Ilomantsi Joensuu Juuka Kitee Kontiolahti Outokumpu Lieksa Liperi Nurmes Polvijärvi Rääkkylä Tohmajärvi Valtimo Total Kainuu 105 Hyrynsalmi Kajaani Kuhmo Paltamo Puolanka Ristijärvi Sotkamo Suomussalmi Vaala Total Pohjois-Pohjanmaa 009 Alavieska Haapajärvi Haapavesi Hailuoto Kalajoki Ii Kempele Kuusamo Kärsämäki Liminka Lumijoki Merijärvi Muhos Nivala Oulainen Oulu Pudasjärvi Pyhäjoki Pyhäsalmi Pyhäntä Raahe Reisjärvi Sievi Siikajoki Siikalatva Taivalkoski
89 Table 3a. Dominant tree on forest land by s. broadleaved tree Treeless Spruce Total Municipality ha % ha % ha % ha % ha % ha % 859 Tyrnävä Utajärvi Ylivieska Total Lapland 047 Enontekiö Inari Kemi Keminmaa Kittilä Kolari Kemijärvi Muonio Pelkosenniemi Posio Ranua Rovaniemi Salla Savukoski Simo Sodankylä Tervola Tornio Pello Utsjoki Ylitornio Total
90 Table 3b. Dominant tree on poorly productive forest land by s. broadleaved tree Treeless Spruce Total Municipality ha % ha % ha % ha % ha % ha % Åland 035 Brändö Eckerö Finström Föglö Geta Hammarland Jomala Kumlinge Kökar Lemland Lumparland Mariehamn-Maarianhamina Saltvik Sottunga Sund Vårdö Total Rannikko/Etelärannikko 049 Espoo-Esbo Hanko-Hangö Helsinki-Helsingfors Vantaa-Vanda Ingå-Inkoo Kauniainen-Grankulla Kirkkonummi-Kyrkslätt Kemiönsaari Lapinjärvi-Lappträsk Loviisa-Lovisa Länsi-Turunmaa Porvoo-Borgå Raasepori Sipoo-Sibbo Siuntio-Sjundeå Total Rannikko/Pohjanmaan rannikko 231 Kaskinen-Kaskö Kokkola-Karleby Rannikko Korsnäs Kristinestad Kronoby-Kruunupyy Larsmo-Luoto Malax-Maalahti Korsholm-Mustasaari Närpes-Närpiö Jakobstad-Pietarsaari Pedersöre-Pedersören kunta Nykarleby-Uusikaarlepyy Vaasa-Vasa Vörå-Vöyri Total Lounais-Suomi 019 Aura Eura Eurajoki Harjavalta Honkajoki Huittinen Jämijärvi Kaarina Kankaanpää Karvia Kokemäki Koski T.l Kustavi Köyliö Laitila Lavia Lieto Loimaa Luvia Marttila Masku Merikarvia Mynämäki Naantali Nakkila Nousiainen Oripää Paimio Pomarkku
91 Table 3b. Dominant tree on poorly productive forest land by s. broadleaved tree Treeless Spruce Total Municipality ha % ha % ha % ha % ha % ha % 609 Pori Pyhäranta Pöytyä Raisio Rauma Rusko Salo Sauvo Siikainen Somero Säkylä Taivassalo Tarvasjoki Turku-Åbo Ulvila Uusikaupunki Vehmaa Total Häme-Uusimaa 016 Asikkala Askola Forssa Hartola Hattula Hausjärvi Hollola Humppila Hyvinkää Hämeenlinna Heinola Janakkala Jokioinen Järvenpää Karkkila Kerava Hämeenkoski Kärkölä Lahti Loppi Lohja Myrskylä-Mörskom Mäntsälä Nastola Nurmijärvi Orimattila Padasjoki Pornainen Pukkila Riihimäki Sysmä Tammela Tuusula Vihti Ypäjä Total Kaakkois-Suomi 075 Hamina Iitti Imatra Kotka Kouvola Lappeenranta Lemi Luumäki Miehikkälä Parikkala Pyhtää-Pyttis Rautjärvi Ruokolahti Savitaipale Taipalsaari Virolahti Total Pirkanmaa 020 Akaa Hämeenkyrö Ikaalinen Juupajoki Kangasala Kihniö Lempäälä
92 Table 3b. Dominant tree on poorly productive forest land by s. broadleaved tree Treeless Spruce Total Municipality ha % ha % ha % ha % ha % ha % 508 Mänttä-Vilppula Nokia Orivesi Parkano Pirkkala Punkalaidun Pälkäne Ruovesi Sastamala Tampere Urjala Valkeakoski Vesilahti Virrat Ylöjärvi Total Etelä-Savo 046 Enonkoski Heinävesi Hirvensalmi Joroinen Juva Kangasniemi Mikkeli Mäntyharju Pertunmaa Pieksämäki Puumala Rantasalmi Savonlinna Sulkava Total Etelä-Pohjanmaa 005 Alajärvi Alavus Evijärvi Halsua Ilmajoki Isojoki Isokyrö Jalasjärvi Kannus Karijoki Kauhajoki Kauhava Kaustinen Kokkola-Karleby E-Pohjanmaa Kuortane Kurikka Laihia Lappajärvi Lapua Lestijärvi Perho Seinäjoki Soini Teuva Toholampi Veteli Vimpeli Ähtäri Total Keski-Suomi 077 Hankasalmi Joutsa Jyväskylä Jämsä Kannonkoski Karstula Keuruu Kinnula Kivijärvi Konnevesi Kuhmoinen Kyyjärvi Laukaa Luhanka Multia Muurame Petäjävesi Pihtipudas
93 Table 3b. Dominant tree on poorly productive forest land by s. broadleaved tree Treeless Spruce Total Municipality ha % ha % ha % ha % ha % ha % 729 Saarijärvi Toivakka Uurainen Viitasaari Äänekoski Total Pohjois-Savo 140 Iisalmi Juankoski Kaavi Keitele Kiuruvesi Kuopio Lapinlahti Leppävirta Maaninka Pielavesi Rautalampi Rautavaara Siilinjärvi Sonkajärvi Suonenjoki Tervo Tuusniemi Varkaus Vesanto Vieremä Total Pohjois-Karjala 146 Ilomantsi Joensuu Juuka Kitee Kontiolahti Outokumpu Lieksa Liperi Nurmes Polvijärvi Rääkkylä Tohmajärvi Valtimo Total Kainuu 105 Hyrynsalmi Kajaani Kuhmo Paltamo Puolanka Ristijärvi Sotkamo Suomussalmi Vaala Total Pohjois-Pohjanmaa 009 Alavieska Haapajärvi Haapavesi Hailuoto Kalajoki Ii Kempele Kuusamo Kärsämäki Liminka Lumijoki Merijärvi Muhos Nivala Oulainen Oulu Pudasjärvi Pyhäjoki Pyhäsalmi Pyhäntä Raahe Reisjärvi Sievi Siikajoki Siikalatva Taivalkoski
94 Table 3b. Dominant tree on poorly productive forest land by s. broadleaved tree Treeless Spruce Total Municipality ha % ha % ha % ha % ha % ha % 859 Tyrnävä Utajärvi Ylivieska Total Lapland 047 Enontekiö Inari Kemi Keminmaa Kittilä Kolari Kemijärvi Muonio Pelkosenniemi Posio Ranua Rovaniemi Salla Savukoski Simo Sodankylä Tervola Tornio Pello Utsjoki Ylitornio Total
95 Table 4a. Age class distribution on forest land by s. Open regeneration site 1-20 yrs yrs yrs yrs yrs yrs Forest land yrs 141+ yrs Municipality ha % ha % ha % ha % ha % ha % ha % ha % ha % ha % Åland 035 Brändö Eckerö Finström Föglö Geta Hammarland Jomala Kumlinge Kökar Lemland Lumparland Mariehamn-Maarianhamina Saltvik Sottunga Sund Vårdö Total Rannikko/Etelärannikko 049 Espoo-Esbo Hanko-Hangö Helsinki-Helsingfors Vantaa-Vanda Ingå-Inkoo Kauniainen-Grankulla Kirkkonummi-Kyrkslätt Kemiönsaari Lapinjärvi-Lappträsk Loviisa-Lovisa Länsi-Turunmaa Porvoo-Borgå Raasepori Sipoo-Sibbo Siuntio-Sjundeå Total Rannikko/Pohjanmaan rannikko 231 Kaskinen-Kaskö Kokkola-Karleby Rannikko Korsnäs Kristinestad Kronoby-Kruunupyy Larsmo-Luoto Malax-Maalahti Korsholm-Mustasaari
96 Table 4a. Age class distribution on forest land by s. Open regeneration site 1-20 yrs yrs yrs yrs yrs yrs Forest land yrs 141+ yrs Municipality ha % ha % ha % ha % ha % ha % ha % ha % ha % ha % 545 Närpes-Närpiö Jakobstad-Pietarsaari Pedersöre-Pedersören kunta Nykarleby-Uusikaarlepyy Vaasa-Vasa Vörå-Vöyri Total Lounais-Suomi 019 Aura Eura Eurajoki Harjavalta Honkajoki Huittinen Jämijärvi Kaarina Kankaanpää Karvia Kokemäki Koski T.l Kustavi Köyliö Laitila Lavia Lieto Loimaa Luvia Marttila Masku Merikarvia Mynämäki Naantali Nakkila Nousiainen Oripää Paimio Pomarkku Pori Pyhäranta Pöytyä Raisio Rauma Rusko Salo
97 Table 4a. Age class distribution on forest land by s. Open regeneration site 1-20 yrs yrs yrs yrs yrs yrs Forest land yrs 141+ yrs Municipality ha % ha % ha % ha % ha % ha % ha % ha % ha % ha % 738 Sauvo Siikainen Somero Säkylä Taivassalo Tarvasjoki Turku-Åbo Ulvila Uusikaupunki Vehmaa Total Häme-Uusimaa 016 Asikkala Askola Forssa Hartola Hattula Hausjärvi Hollola Humppila Hyvinkää Hämeenlinna Heinola Janakkala Jokioinen Järvenpää Karkkila Kerava Hämeenkoski Kärkölä Lahti Loppi Lohja Myrskylä-Mörskom Mäntsälä Nastola Nurmijärvi Orimattila Padasjoki Pornainen Pukkila Riihimäki Sysmä Tammela
98 Table 4a. Age class distribution on forest land by s. Open regeneration site 1-20 yrs yrs yrs yrs yrs yrs Forest land yrs 141+ yrs Municipality ha % ha % ha % ha % ha % ha % ha % ha % ha % ha % 858 Tuusula Vihti Ypäjä Total Kaakkois-Suomi 075 Hamina Iitti Imatra Kotka Kouvola Lappeenranta Lemi Luumäki Miehikkälä Parikkala Pyhtää-Pyttis Rautjärvi Ruokolahti Savitaipale Taipalsaari Virolahti Total Pirkanmaa 020 Akaa Hämeenkyrö Ikaalinen Juupajoki Kangasala Kihniö Lempäälä Mänttä-Vilppula Nokia Orivesi Parkano Pirkkala Punkalaidun Pälkäne Ruovesi Sastamala Tampere Urjala Valkeakoski Vesilahti Virrat
99 Table 4a. Age class distribution on forest land by s. Open regeneration site 1-20 yrs yrs yrs yrs yrs yrs Forest land yrs 141+ yrs Municipality ha % ha % ha % ha % ha % ha % ha % ha % ha % ha % 980 Ylöjärvi Total Etelä-Savo 046 Enonkoski Heinävesi Hirvensalmi Joroinen Juva Kangasniemi Mikkeli Mäntyharju Pertunmaa Pieksämäki Puumala Rantasalmi Savonlinna Sulkava Total Etelä-Pohjanmaa 005 Alajärvi Alavus Evijärvi Halsua Ilmajoki Isojoki Isokyrö Jalasjärvi Kannus Karijoki Kauhajoki Kauhava Kaustinen Kokkola-Karleby E Kuortane Kurikka Laihia Lappajärvi Lapua Lestijärvi Perho Seinäjoki Soini Teuva Toholampi
100 Table 4a. Age class distribution on forest land by s. Open regeneration site 1-20 yrs yrs yrs yrs yrs yrs Forest land yrs 141+ yrs Municipality ha % ha % ha % ha % ha % ha % ha % ha % ha % ha % 924 Veteli Vimpeli Ähtäri Total Keski-Suomi 077 Hankasalmi Joutsa Jyväskylä Jämsä Kannonkoski Karstula Keuruu Kinnula Kivijärvi Konnevesi Kuhmoinen Kyyjärvi Laukaa Luhanka Multia Muurame Petäjävesi Pihtipudas Saarijärvi Toivakka Uurainen Viitasaari Äänekoski Total Pohjois-Savo 140 Iisalmi Juankoski Kaavi Keitele Kiuruvesi Kuopio Lapinlahti Leppävirta Maaninka Pielavesi Rautalampi Rautavaara Siilinjärvi Sonkajärvi
101 Table 4a. Age class distribution on forest land by s. Open regeneration site 1-20 yrs yrs yrs yrs yrs yrs Forest land yrs 141+ yrs Municipality ha % ha % ha % ha % ha % ha % ha % ha % ha % ha % 778 Suonenjoki Tervo Tuusniemi Varkaus Vesanto Vieremä Total Pohjois-Karjala 146 Ilomantsi Joensuu Juuka Kitee Kontiolahti Outokumpu Lieksa Liperi Nurmes Polvijärvi Rääkkylä Tohmajärvi Valtimo Total Kainuu 105 Hyrynsalmi Kajaani Kuhmo Paltamo Puolanka Ristijärvi Sotkamo Suomussalmi Vaala Total Pohjois-Pohjanmaa 009 Alavieska Haapajärvi Haapavesi Hailuoto Kalajoki Ii Kempele Kuusamo Kärsämäki Liminka
102 Table 4a. Age class distribution on forest land by s. Open regeneration site 1-20 yrs yrs yrs yrs yrs yrs Forest land yrs 141+ yrs Municipality ha % ha % ha % ha % ha % ha % ha % ha % ha % ha % 436 Lumijoki Merijärvi Muhos Nivala Oulainen Oulu Pudasjärvi Pyhäjoki Pyhäsalmi Pyhäntä Raahe Reisjärvi Sievi Siikajoki Siikalatva Taivalkoski Tyrnävä Utajärvi Ylivieska Total Lapland 047 Enontekiö Inari Kemi Keminmaa Kittilä Kolari Kemijärvi Muonio Pelkosenniemi Posio Ranua Rovaniemi Salla Savukoski Simo Sodankylä Tervola Tornio Pello Utsjoki Ylitornio Total
103 Table 4b. The mean volume of growing stock in age classes on forest land by s. Municipality Open regeneration site 1-20 yrs yrs yrs yrs yrs yrs yrs 141+ yrs Forest land Åland 035 Brändö Eckerö Finström Föglö Geta Hammarland Jomala Kumlinge Kökar Lemland Lumparland Mariehamn-Maarianhamina Saltvik Sottunga Sund Vårdö Total Rannikko/Etelärannikko 049 Espoo-Esbo Hanko-Hangö Helsinki-Helsingfors Vantaa-Vanda Ingå-Inkoo Kauniainen-Grankulla Kirkkonummi-Kyrkslätt Kemiönsaari Lapinjärvi-Lappträsk Loviisa-Lovisa Länsi-Turunmaa Porvoo-Borgå Raasepori Sipoo-Sibbo Siuntio-Sjundeå Total Rannikko/Pohjanmaan rannikko 231 Kaskinen-Kaskö Kokkola-Karleby Rannikko Korsnäs Kristinestad Kronoby-Kruunupyy Larsmo-Luoto Malax-Maalahti Korsholm-Mustasaari Närpes-Närpiö Jakobstad-Pietarsaari Pedersöre-Pedersören kunta Nykarleby-Uusikaarlepyy Vaasa-Vasa Vörå-Vöyri Total Lounais-Suomi 019 Aura Eura Eurajoki Harjavalta Honkajoki Huittinen Jämijärvi Kaarina Kankaanpää Karvia Kokemäki Koski T.l Kustavi Köyliö Laitila Lavia Lieto Loimaa Luvia Marttila Masku Merikarvia Mynämäki Naantali Nakkila Nousiainen Oripää Paimio Pomarkku Pori m 3 /ha
104 Table 4b. The mean volume of growing stock in age classes on forest land by s. Municipality Open regeneration site 1-20 yrs yrs yrs yrs m 3 /ha yrs yrs yrs 141+ yrs Forest land 631 Pyhäranta Pöytyä Raisio Rauma Rusko Salo Sauvo Siikainen Somero Säkylä Taivassalo Tarvasjoki Turku-Åbo Ulvila Uusikaupunki Vehmaa Total Häme-Uusimaa 016 Asikkala Askola Forssa Hartola Hattula Hausjärvi Hollola Humppila Hyvinkää Hämeenlinna Heinola Janakkala Jokioinen Järvenpää Karkkila Kerava Hämeenkoski Kärkölä Lahti Loppi Lohja Myrskylä-Mörskom Mäntsälä Nastola Nurmijärvi Orimattila Padasjoki Pornainen Pukkila Riihimäki Sysmä Tammela Tuusula Vihti Ypäjä Total Kaakkois-Suomi 075 Hamina Iitti Imatra Kotka Kouvola Lappeenranta Lemi Luumäki Miehikkälä Parikkala Pyhtää-Pyttis Rautjärvi Ruokolahti Savitaipale Taipalsaari Virolahti Total Pirkanmaa 020 Akaa Hämeenkyrö Ikaalinen Juupajoki Kangasala Kihniö Lempäälä Mänttä-Vilppula Nokia
105 Table 4b. The mean volume of growing stock in age classes on forest land by s. Municipality Open regeneration site 1-20 yrs yrs yrs yrs m 3 /ha yrs yrs yrs 141+ yrs Forest land 562 Orivesi Parkano Pirkkala Punkalaidun Pälkäne Ruovesi Sastamala Tampere Urjala Valkeakoski Vesilahti Virrat Ylöjärvi Total Etelä-Savo 046 Enonkoski Heinävesi Hirvensalmi Joroinen Juva Kangasniemi Mikkeli Mäntyharju Pertunmaa Pieksämäki Puumala Rantasalmi Savonlinna Sulkava Total Etelä-Pohjanmaa 005 Alajärvi Alavus Evijärvi Halsua Ilmajoki Isojoki Isokyrö Jalasjärvi Kannus Karijoki Kauhajoki Kauhava Kaustinen Kokkola-Karleby E-Pohjanmaa Kuortane Kurikka Laihia Lappajärvi Lapua Lestijärvi Perho Seinäjoki Soini Teuva Toholampi Veteli Vimpeli Ähtäri Total Keski-Suomi 077 Hankasalmi Joutsa Jyväskylä Jämsä Kannonkoski Karstula Keuruu Kinnula Kivijärvi Konnevesi Kuhmoinen Kyyjärvi Laukaa Luhanka Multia Muurame Petäjävesi Pihtipudas Saarijärvi Toivakka Uurainen
106 Table 4b. The mean volume of growing stock in age classes on forest land by s. Municipality Open regeneration site 1-20 yrs yrs yrs yrs m 3 /ha yrs yrs yrs 141+ yrs Forest land 931 Viitasaari Äänekoski Total Pohjois-Savo 140 Iisalmi Juankoski Kaavi Keitele Kiuruvesi Kuopio Lapinlahti Leppävirta Maaninka Pielavesi Rautalampi Rautavaara Siilinjärvi Sonkajärvi Suonenjoki Tervo Tuusniemi Varkaus Vesanto Vieremä Total Pohjois-Karjala 146 Ilomantsi Joensuu Juuka Kitee Kontiolahti Outokumpu Lieksa Liperi Nurmes Polvijärvi Rääkkylä Tohmajärvi Valtimo Total Kainuu 105 Hyrynsalmi Kajaani Kuhmo Paltamo Puolanka Ristijärvi Sotkamo Suomussalmi Vaala Total Pohjois-Pohjanmaa 009 Alavieska Haapajärvi Haapavesi Hailuoto Kalajoki Ii Kempele Kuusamo Kärsämäki Liminka Lumijoki Merijärvi Muhos Nivala Oulainen Oulu Pudasjärvi Pyhäjoki Pyhäsalmi Pyhäntä Raahe Reisjärvi Sievi Siikajoki Siikalatva Taivalkoski Tyrnävä Utajärvi Ylivieska Total
107 Table 4b. The mean volume of growing stock in age classes on forest land by s. Municipality Open regeneration site 1-20 yrs yrs yrs yrs m 3 /ha yrs yrs yrs 141+ yrs Forest land Lapland 047 Enontekiö Inari Kemi Keminmaa Kittilä Kolari Kemijärvi Muonio Pelkosenniemi Posio Ranua Rovaniemi Salla Savukoski Simo Sodankylä Tervola Tornio Pello Utsjoki Ylitornio Total
108 Table 4c. Age class distribution on forest land available for wood supply by s. Open regeneration site 1-20 yrs yrs yrs yrs yrs yrs Forest land yrs 141+ yrs Municipality ha % ha % ha % ha % ha % ha % ha % ha % ha % ha % Åland 035 Brändö Eckerö Finström Föglö Geta Hammarland Jomala Kumlinge Kökar Lemland Lumparland Mariehamn-Maarianhamina Saltvik Sottunga Sund Vårdö Total Rannikko/Etelärannikko 049 Espoo-Esbo Hanko-Hangö Helsinki-Helsingfors Vantaa-Vanda Ingå-Inkoo Kauniainen-Grankulla Kirkkonummi-Kyrkslätt Kemiönsaari Lapinjärvi-Lappträsk Loviisa-Lovisa Länsi-Turunmaa Porvoo-Borgå Raasepori Sipoo-Sibbo Siuntio-Sjundeå Total Rannikko/Pohjanmaan rannikko 231 Kaskinen-Kaskö Kokkola-Karleby Rannikko Korsnäs Kristinestad Kronoby-Kruunupyy Larsmo-Luoto Malax-Maalahti Korsholm-Mustasaari
109 Table 4c. Age class distribution on forest land available for wood supply by s. Open regeneration site 1-20 yrs yrs yrs yrs yrs yrs Forest land yrs 141+ yrs Municipality ha % ha % ha % ha % ha % ha % ha % ha % ha % ha % 545 Närpes-Närpiö Jakobstad-Pietarsaari Pedersöre-Pedersören kunta Nykarleby-Uusikaarlepyy Vaasa-Vasa Vörå-Vöyri Total Lounais-Suomi 019 Aura Eura Eurajoki Harjavalta Honkajoki Huittinen Jämijärvi Kaarina Kankaanpää Karvia Kokemäki Koski T.l Kustavi Köyliö Laitila Lavia Lieto Loimaa Luvia Marttila Masku Merikarvia Mynämäki Naantali Nakkila Nousiainen Oripää Paimio Pomarkku Pori Pyhäranta Pöytyä Raisio Rauma Rusko Salo
110 Table 4c. Age class distribution on forest land available for wood supply by s. Open regeneration site 1-20 yrs yrs yrs yrs yrs yrs Forest land yrs 141+ yrs Municipality ha % ha % ha % ha % ha % ha % ha % ha % ha % ha % 738 Sauvo Siikainen Somero Säkylä Taivassalo Tarvasjoki Turku-Åbo Ulvila Uusikaupunki Vehmaa Total Häme-Uusimaa 016 Asikkala Askola Forssa Hartola Hattula Hausjärvi Hollola Humppila Hyvinkää Hämeenlinna Heinola Janakkala Jokioinen Järvenpää Karkkila Kerava Hämeenkoski Kärkölä Lahti Loppi Lohja Myrskylä-Mörskom Mäntsälä Nastola Nurmijärvi Orimattila Padasjoki Pornainen Pukkila Riihimäki Sysmä Tammela
111 Table 4c. Age class distribution on forest land available for wood supply by s. Open regeneration site 1-20 yrs yrs yrs yrs yrs yrs Forest land yrs 141+ yrs Municipality ha % ha % ha % ha % ha % ha % ha % ha % ha % ha % 858 Tuusula Vihti Ypäjä Total Kaakkois-Suomi 075 Hamina Iitti Imatra Kotka Kouvola Lappeenranta Lemi Luumäki Miehikkälä Parikkala Pyhtää-Pyttis Rautjärvi Ruokolahti Savitaipale Taipalsaari Virolahti Total Pirkanmaa 020 Akaa Hämeenkyrö Ikaalinen Juupajoki Kangasala Kihniö Lempäälä Mänttä-Vilppula Nokia Orivesi Parkano Pirkkala Punkalaidun Pälkäne Ruovesi Sastamala Tampere Urjala Valkeakoski Vesilahti Virrat
112 Table 4c. Age class distribution on forest land available for wood supply by s. Open regeneration site 1-20 yrs yrs yrs yrs yrs yrs Forest land yrs 141+ yrs Municipality ha % ha % ha % ha % ha % ha % ha % ha % ha % ha % 980 Ylöjärvi Total Etelä-Savo 046 Enonkoski Heinävesi Hirvensalmi Joroinen Juva Kangasniemi Mikkeli Mäntyharju Pertunmaa Pieksämäki Puumala Rantasalmi Savonlinna Sulkava Total Etelä-Pohjanmaa 005 Alajärvi Alavus Evijärvi Halsua Ilmajoki Isojoki Isokyrö Jalasjärvi Kannus Karijoki Kauhajoki Kauhava Kaustinen Kokkola-Karleby E Kuortane Kurikka Laihia Lappajärvi Lapua Lestijärvi Perho Seinäjoki Soini Teuva Toholampi
113 Table 4c. Age class distribution on forest land available for wood supply by s. Open regeneration site 1-20 yrs yrs yrs yrs yrs yrs Forest land yrs 141+ yrs Municipality ha % ha % ha % ha % ha % ha % ha % ha % ha % ha % 924 Veteli Vimpeli Ähtäri Total Keski-Suomi 077 Hankasalmi Joutsa Jyväskylä Jämsä Kannonkoski Karstula Keuruu Kinnula Kivijärvi Konnevesi Kuhmoinen Kyyjärvi Laukaa Luhanka Multia Muurame Petäjävesi Pihtipudas Saarijärvi Toivakka Uurainen Viitasaari Äänekoski Total Pohjois-Savo 140 Iisalmi Juankoski Kaavi Keitele Kiuruvesi Kuopio Lapinlahti Leppävirta Maaninka Pielavesi Rautalampi Rautavaara Siilinjärvi Sonkajärvi
114 Table 4c. Age class distribution on forest land available for wood supply by s. Open regeneration site 1-20 yrs yrs yrs yrs yrs yrs Forest land yrs 141+ yrs Municipality ha % ha % ha % ha % ha % ha % ha % ha % ha % ha % 778 Suonenjoki Tervo Tuusniemi Varkaus Vesanto Vieremä Total Pohjois-Karjala 146 Ilomantsi Joensuu Juuka Kitee Kontiolahti Outokumpu Lieksa Liperi Nurmes Polvijärvi Rääkkylä Tohmajärvi Valtimo Total Kainuu 105 Hyrynsalmi Kajaani Kuhmo Paltamo Puolanka Ristijärvi Sotkamo Suomussalmi Vaala Total Pohjois-Pohjanmaa 009 Alavieska Haapajärvi Haapavesi Hailuoto Kalajoki Ii Kempele Kuusamo Kärsämäki Liminka
115 Table 4c. Age class distribution on forest land available for wood supply by s. Open regeneration site 1-20 yrs yrs yrs yrs yrs yrs Forest land yrs 141+ yrs Municipality ha % ha % ha % ha % ha % ha % ha % ha % ha % ha % 436 Lumijoki Merijärvi Muhos Nivala Oulainen Oulu Pudasjärvi Pyhäjoki Pyhäsalmi Pyhäntä Raahe Reisjärvi Sievi Siikajoki Siikalatva Taivalkoski Tyrnävä Utajärvi Ylivieska Total Lapland 047 Enontekiö Inari Kemi Keminmaa Kittilä Kolari Kemijärvi Muonio Pelkosenniemi Posio Ranua Rovaniemi Salla Savukoski Simo Sodankylä Tervola Tornio Pello Utsjoki Ylitornio Total
116 Table 4d. The mean volume of growing stock in age classes on forest land available for wood supply by s. Municipality Open regeneration site 1-20 yrs yrs yrs yrs yrs yrs yrs 141+ yrs Forest land Åland 035 Brändö Eckerö Finström Föglö Geta Hammarland Jomala Kumlinge Kökar Lemland Lumparland Mariehamn-Maarianhamina Saltvik Sottunga Sund Vårdö Total Rannikko/Etelärannikko 049 Espoo-Esbo Hanko-Hangö Helsinki-Helsingfors Vantaa-Vanda Ingå-Inkoo Kauniainen-Grankulla Kirkkonummi-Kyrkslätt Kemiönsaari Lapinjärvi-Lappträsk Loviisa-Lovisa Länsi-Turunmaa Porvoo-Borgå Raasepori Sipoo-Sibbo Siuntio-Sjundeå Total Rannikko/Pohjanmaan rannikko 231 Kaskinen-Kaskö Kokkola-Karleby Rannikko Korsnäs Kristinestad Kronoby-Kruunupyy Larsmo-Luoto Malax-Maalahti Korsholm-Mustasaari Närpes-Närpiö Jakobstad-Pietarsaari Pedersöre-Pedersören kunta Nykarleby-Uusikaarlepyy Vaasa-Vasa Vörå-Vöyri Total Lounais-Suomi 019 Aura Eura Eurajoki Harjavalta Honkajoki Huittinen Jämijärvi Kaarina Kankaanpää Karvia Kokemäki Koski T.l Kustavi Köyliö Laitila Lavia Lieto Loimaa Luvia Marttila Masku Merikarvia Mynämäki Naantali Nakkila Nousiainen Oripää Paimio Pomarkku Pori m 3 /ha
117 Table 4d. The mean volume of growing stock in age classes on forest land available for wood supply by s. Municipality Open regeneration site 1-20 yrs yrs yrs yrs m 3 /ha yrs yrs yrs 141+ yrs Forest land 631 Pyhäranta Pöytyä Raisio Rauma Rusko Salo Sauvo Siikainen Somero Säkylä Taivassalo Tarvasjoki Turku-Åbo Ulvila Uusikaupunki Vehmaa Total Häme-Uusimaa 016 Asikkala Askola Forssa Hartola Hattula Hausjärvi Hollola Humppila Hyvinkää Hämeenlinna Heinola Janakkala Jokioinen Järvenpää Karkkila Kerava Hämeenkoski Kärkölä Lahti Loppi Lohja Myrskylä-Mörskom Mäntsälä Nastola Nurmijärvi Orimattila Padasjoki Pornainen Pukkila Riihimäki Sysmä Tammela Tuusula Vihti Ypäjä Total Kaakkois-Suomi 075 Hamina Iitti Imatra Kotka Kouvola Lappeenranta Lemi Luumäki Miehikkälä Parikkala Pyhtää-Pyttis Rautjärvi Ruokolahti Savitaipale Taipalsaari Virolahti Total Pirkanmaa 020 Akaa Hämeenkyrö Ikaalinen Juupajoki Kangasala Kihniö Lempäälä Mänttä-Vilppula Nokia
118 Table 4d. The mean volume of growing stock in age classes on forest land available for wood supply by s. Municipality Open regeneration site 1-20 yrs yrs yrs yrs m 3 /ha yrs yrs yrs 141+ yrs Forest land 562 Orivesi Parkano Pirkkala Punkalaidun Pälkäne Ruovesi Sastamala Tampere Urjala Valkeakoski Vesilahti Virrat Ylöjärvi Total Etelä-Savo 046 Enonkoski Heinävesi Hirvensalmi Joroinen Juva Kangasniemi Mikkeli Mäntyharju Pertunmaa Pieksämäki Puumala Rantasalmi Savonlinna Sulkava Total Etelä-Pohjanmaa 005 Alajärvi Alavus Evijärvi Halsua Ilmajoki Isojoki Isokyrö Jalasjärvi Kannus Karijoki Kauhajoki Kauhava Kaustinen Kokkola-Karleby E-Pohjanmaa Kuortane Kurikka Laihia Lappajärvi Lapua Lestijärvi Perho Seinäjoki Soini Teuva Toholampi Veteli Vimpeli Ähtäri Total Keski-Suomi 077 Hankasalmi Joutsa Jyväskylä Jämsä Kannonkoski Karstula Keuruu Kinnula Kivijärvi Konnevesi Kuhmoinen Kyyjärvi Laukaa Luhanka Multia Muurame Petäjävesi Pihtipudas Saarijärvi Toivakka Uurainen
119 Table 4d. The mean volume of growing stock in age classes on forest land available for wood supply by s. Municipality Open regeneration site 1-20 yrs yrs yrs yrs m 3 /ha yrs yrs yrs 141+ yrs Forest land 931 Viitasaari Äänekoski Total Pohjois-Savo 140 Iisalmi Juankoski Kaavi Keitele Kiuruvesi Kuopio Lapinlahti Leppävirta Maaninka Pielavesi Rautalampi Rautavaara Siilinjärvi Sonkajärvi Suonenjoki Tervo Tuusniemi Varkaus Vesanto Vieremä Total Pohjois-Karjala 146 Ilomantsi Joensuu Juuka Kitee Kontiolahti Outokumpu Lieksa Liperi Nurmes Polvijärvi Rääkkylä Tohmajärvi Valtimo Total Kainuu 105 Hyrynsalmi Kajaani Kuhmo Paltamo Puolanka Ristijärvi Sotkamo Suomussalmi Vaala Total Pohjois-Pohjanmaa 009 Alavieska Haapajärvi Haapavesi Hailuoto Kalajoki Ii Kempele Kuusamo Kärsämäki Liminka Lumijoki Merijärvi Muhos Nivala Oulainen Oulu Pudasjärvi Pyhäjoki Pyhäsalmi Pyhäntä Raahe Reisjärvi Sievi Siikajoki Siikalatva Taivalkoski Tyrnävä Utajärvi Ylivieska Total
120 Table 4d. The mean volume of growing stock in age classes on forest land available for wood supply by s. Municipality Open regeneration site 1-20 yrs yrs yrs yrs m 3 /ha yrs yrs yrs 141+ yrs Forest land Lapland 047 Enontekiö Inari Kemi Keminmaa Kittilä Kolari Kemijärvi Muonio Pelkosenniemi Posio Ranua Rovaniemi Salla Savukoski Simo Sodankylä Tervola Tornio Pello Utsjoki Ylitornio Total
121 Table 5a. Development class distribution on forest land by s. Open regeneration site Young seedling stand Advanced seedling stand Young thinning stand Advanced thinning stand Mature stand Shelterwood stand Seed tree stand Forest land Municipality ha % ha % ha % ha % ha % ha % ha % ha % ha % Åland 035 Brändö Eckerö Finström Föglö Geta Hammarland Jomala Kumlinge Kökar Lemland Lumparland Mariehamn-Maarianhamina Saltvik Sottunga Sund Vårdö Total Rannikko/Etelärannikko 049 Espoo-Esbo Hanko-Hangö Helsinki-Helsingfors Vantaa-Vanda Ingå-Inkoo Kauniainen-Grankulla Kirkkonummi-Kyrkslätt Kemiönsaari Lapinjärvi-Lappträsk Loviisa-Lovisa Länsi-Turunmaa Porvoo-Borgå Raasepori Sipoo-Sibbo Siuntio-Sjundeå Total Rannikko/Pohjanmaan rannikko 231 Kaskinen-Kaskö Kokkola-Karleby Rannikko Korsnäs Kristinestad-Kristiinankaupunki Kronoby-Kruunupyy Larsmo-Luoto Malax-Maalahti Korsholm-Mustasaari
122 Table 5a. Development class distribution on forest land by s. Open regeneration site Young seedling stand Advanced seedling stand Young thinning stand Advanced thinning stand Mature stand Shelterwood stand Seed tree stand Forest land Municipality ha % ha % ha % ha % ha % ha % ha % ha % ha % 545 Närpes-Närpiö Jakobstad-Pietarsaari Pedersöre-Pedersören kunta Nykarleby-Uusikaarlepyy Vaasa-Vasa Vörå-Vöyri Total Lounais-Suomi 019 Aura Eura Eurajoki Harjavalta Honkajoki Huittinen Jämijärvi Kaarina Kankaanpää Karvia Kokemäki Koski T.l Kustavi Köyliö Laitila Lavia Lieto Loimaa Luvia Marttila Masku Merikarvia Mynämäki Naantali Nakkila Nousiainen Oripää Paimio Pomarkku Pori Pyhäranta Pöytyä Raisio Rauma Rusko Salo
123 Table 5a. Development class distribution on forest land by s. Open regeneration site Young seedling stand Advanced seedling stand Young thinning stand Advanced thinning stand Mature stand Shelterwood stand Seed tree stand Forest land Municipality ha % ha % ha % ha % ha % ha % ha % ha % ha % 738 Sauvo Siikainen Somero Säkylä Taivassalo Tarvasjoki Turku-Åbo Ulvila Uusikaupunki Vehmaa Total Häme-Uusimaa 016 Asikkala Askola Forssa Hartola Hattula Hausjärvi Hollola Humppila Hyvinkää Hämeenlinna Heinola Janakkala Jokioinen Järvenpää Karkkila Kerava Hämeenkoski Kärkölä Lahti Loppi Lohja Myrskylä-Mörskom Mäntsälä Nastola Nurmijärvi Orimattila Padasjoki Pornainen Pukkila Riihimäki Sysmä Tammela
124 Table 5a. Development class distribution on forest land by s. Open regeneration site Young seedling stand Advanced seedling stand Young thinning stand Advanced thinning stand Mature stand Shelterwood stand Seed tree stand Forest land Municipality ha % ha % ha % ha % ha % ha % ha % ha % ha % 858 Tuusula Vihti Ypäjä Total Kaakkois-Suomi 075 Hamina Iitti Imatra Kotka Kouvola Lappeenranta Lemi Luumäki Miehikkälä Parikkala Pyhtää-Pyttis Rautjärvi Ruokolahti Savitaipale Taipalsaari Virolahti Total Pirkanmaa 020 Akaa Hämeenkyrö Ikaalinen Juupajoki Kangasala Kihniö Lempäälä Mänttä-Vilppula Nokia Orivesi Parkano Pirkkala Punkalaidun Pälkäne Ruovesi Sastamala Tampere Urjala Valkeakoski Vesilahti Virrat
125 Table 5a. Development class distribution on forest land by s. Open regeneration site Young seedling stand Advanced seedling stand Young thinning stand Advanced thinning stand Mature stand Shelterwood stand Seed tree stand Forest land Municipality ha % ha % ha % ha % ha % ha % ha % ha % ha % 980 Ylöjärvi Total Etelä-Savo 046 Enonkoski Heinävesi Hirvensalmi Joroinen Juva Kangasniemi Mikkeli Mäntyharju Pertunmaa Pieksämäki Puumala Rantasalmi Savonlinna Sulkava Total Etelä-Pohjanmaa 005 Alajärvi Alavus Evijärvi Halsua Ilmajoki Isojoki Isokyrö Jalasjärvi Kannus Karijoki Kauhajoki Kauhava Kaustinen Kokkola-Karleby E-Pohjanmaa Kuortane Kurikka Laihia Lappajärvi Lapua Lestijärvi Perho Seinäjoki Soini Teuva Toholampi
126 Table 5a. Development class distribution on forest land by s. Open regeneration site Young seedling stand Advanced seedling stand Young thinning stand Advanced thinning stand Mature stand Shelterwood stand Seed tree stand Forest land Municipality ha % ha % ha % ha % ha % ha % ha % ha % ha % 924 Veteli Vimpeli Ähtäri Total Keski-Suomi 077 Hankasalmi Joutsa Jyväskylä Jämsä Kannonkoski Karstula Keuruu Kinnula Kivijärvi Konnevesi Kuhmoinen Kyyjärvi Laukaa Luhanka Multia Muurame Petäjävesi Pihtipudas Saarijärvi Toivakka Uurainen Viitasaari Äänekoski Total Pohjois-Savo 140 Iisalmi Juankoski Kaavi Keitele Kiuruvesi Kuopio Lapinlahti Leppävirta Maaninka Pielavesi Rautalampi Rautavaara Siilinjärvi Sonkajärvi
127 Table 5a. Development class distribution on forest land by s. Open regeneration site Young seedling stand Advanced seedling stand Young thinning stand Advanced thinning stand Mature stand Shelterwood stand Seed tree stand Forest land Municipality ha % ha % ha % ha % ha % ha % ha % ha % ha % 778 Suonenjoki Tervo Tuusniemi Varkaus Vesanto Vieremä Total Pohjois-Karjala 146 Ilomantsi Joensuu Juuka Kitee Kontiolahti Outokumpu Lieksa Liperi Nurmes Polvijärvi Rääkkylä Tohmajärvi Valtimo Total Kainuu 105 Hyrynsalmi Kajaani Kuhmo Paltamo Puolanka Ristijärvi Sotkamo Suomussalmi Vaala Total Pohjois-Pohjanmaa 009 Alavieska Haapajärvi Haapavesi Hailuoto Kalajoki Ii Kempele Kuusamo Kärsämäki Liminka
128 Table 5a. Development class distribution on forest land by s. Open regeneration site Young seedling stand Advanced seedling stand Young thinning stand Advanced thinning stand Mature stand Shelterwood stand Seed tree stand Forest land Municipality ha % ha % ha % ha % ha % ha % ha % ha % ha % 436 Lumijoki Merijärvi Muhos Nivala Oulainen Oulu Pudasjärvi Pyhäjoki Pyhäsalmi Pyhäntä Raahe Reisjärvi Sievi Siikajoki Siikalatva Taivalkoski Tyrnävä Utajärvi Ylivieska Total Lapland 047 Enontekiö Inari Kemi Keminmaa Kittilä Kolari Kemijärvi Muonio Pelkosenniemi Posio Ranua Rovaniemi Salla Savukoski Simo Sodankylä Tervola Tornio Pello Utsjoki Ylitornio Total
129 Table 5b. The mean volume of growing stock in development classes on forest land by s. Municipality Open regeneration site Young seedling stand Advanced seedling stand Young thinning stand Advanced thinning stand Mature stand Shelterwood stand Seed tree stand Forest land Åland 035 Brändö Eckerö Finström Föglö Geta Hammarland Jomala Kumlinge Kökar Lemland Lumparland Mariehamn-Maarianhamina Saltvik Sottunga Sund Vårdö Total Rannikko/Etelärannikko 049 Espoo-Esbo Hanko-Hangö Helsinki-Helsingfors Vantaa-Vanda Ingå-Inkoo Kauniainen-Grankulla Kirkkonummi-Kyrkslätt Kemiönsaari Lapinjärvi-Lappträsk Loviisa-Lovisa Länsi-Turunmaa Porvoo-Borgå Raasepori Sipoo-Sibbo Siuntio-Sjundeå Total Rannikko/Pohjanmaan rannikko 231 Kaskinen-Kaskö Kokkola-Karleby Rannikko Korsnäs Kristinestad-Kristiinankaupunki Kronoby-Kruunupyy Larsmo-Luoto Malax-Maalahti Korsholm-Mustasaari Närpes-Närpiö Jakobstad-Pietarsaari Pedersöre-Pedersören kunta Nykarleby-Uusikaarlepyy Vaasa-Vasa Vörå-Vöyri Total Lounais-Suomi 019 Aura Eura Eurajoki Harjavalta Honkajoki Huittinen Jämijärvi Kaarina Kankaanpää Karvia Kokemäki Koski T.l Kustavi Köyliö Laitila Lavia Lieto Loimaa Luvia Marttila Masku Merikarvia Mynämäki Naantali Nakkila Nousiainen Oripää Paimio Pomarkku Pori m 3 /ha
130 Table 5b. The mean volume of growing stock in development classes on forest land by s. Municipality Open regeneration site Young seedling stand Advanced seedling stand Young thinning stand Advanced thinning stand m 3 /ha Mature stand Shelterwood stand Seed tree stand Forest land 631 Pyhäranta Pöytyä Raisio Rauma Rusko Salo Sauvo Siikainen Somero Säkylä Taivassalo Tarvasjoki Turku-Åbo Ulvila Uusikaupunki Vehmaa Total Häme-Uusimaa 016 Asikkala Askola Forssa Hartola Hattula Hausjärvi Hollola Humppila Hyvinkää Hämeenlinna Heinola Janakkala Jokioinen Järvenpää Karkkila Kerava Hämeenkoski Kärkölä Lahti Loppi Lohja Myrskylä-Mörskom Mäntsälä Nastola Nurmijärvi Orimattila Padasjoki Pornainen Pukkila Riihimäki Sysmä Tammela Tuusula Vihti Ypäjä Total Kaakkois-Suomi 075 Hamina Iitti Imatra Kotka Kouvola Lappeenranta Lemi Luumäki Miehikkälä Parikkala Pyhtää-Pyttis Rautjärvi Ruokolahti Savitaipale Taipalsaari Virolahti Total Pirkanmaa 020 Akaa Hämeenkyrö Ikaalinen Juupajoki Kangasala Kihniö Lempäälä Mänttä-Vilppula Nokia
131 Table 5b. The mean volume of growing stock in development classes on forest land by s. Municipality Open regeneration site Young seedling stand Advanced seedling stand Young thinning stand Advanced thinning stand m 3 /ha Mature stand Shelterwood stand Seed tree stand Forest land 562 Orivesi Parkano Pirkkala Punkalaidun Pälkäne Ruovesi Sastamala Tampere Urjala Valkeakoski Vesilahti Virrat Ylöjärvi Total Etelä-Savo 046 Enonkoski Heinävesi Hirvensalmi Joroinen Juva Kangasniemi Mikkeli Mäntyharju Pertunmaa Pieksämäki Puumala Rantasalmi Savonlinna Sulkava Total Etelä-Pohjanmaa 005 Alajärvi Alavus Evijärvi Halsua Ilmajoki Isojoki Isokyrö Jalasjärvi Kannus Karijoki Kauhajoki Kauhava Kaustinen Kokkola-Karleby E-Pohjanmaa Kuortane Kurikka Laihia Lappajärvi Lapua Lestijärvi Perho Seinäjoki Soini Teuva Toholampi Veteli Vimpeli Ähtäri Total Keski-Suomi 077 Hankasalmi Joutsa Jyväskylä Jämsä Kannonkoski Karstula Keuruu Kinnula Kivijärvi Konnevesi Kuhmoinen Kyyjärvi Laukaa Luhanka Multia Muurame Petäjävesi Pihtipudas Saarijärvi Toivakka Uurainen
132 Table 5b. The mean volume of growing stock in development classes on forest land by s. Municipality Open regeneration site Young seedling stand Advanced seedling stand Young thinning stand Advanced thinning stand m 3 /ha Mature stand Shelterwood stand Seed tree stand Forest land 931 Viitasaari Äänekoski Total Pohjois-Savo 140 Iisalmi Juankoski Kaavi Keitele Kiuruvesi Kuopio Lapinlahti Leppävirta Maaninka Pielavesi Rautalampi Rautavaara Siilinjärvi Sonkajärvi Suonenjoki Tervo Tuusniemi Varkaus Vesanto Vieremä Total Pohjois-Karjala 146 Ilomantsi Joensuu Juuka Kitee Kontiolahti Outokumpu Lieksa Liperi Nurmes Polvijärvi Rääkkylä Tohmajärvi Valtimo Total Kainuu 105 Hyrynsalmi Kajaani Kuhmo Paltamo Puolanka Ristijärvi Sotkamo Suomussalmi Vaala Total Pohjois-Pohjanmaa 009 Alavieska Haapajärvi Haapavesi Hailuoto Kalajoki Ii Kempele Kuusamo Kärsämäki Liminka Lumijoki Merijärvi Muhos Nivala Oulainen Oulu Pudasjärvi Pyhäjoki Pyhäsalmi Pyhäntä Raahe Reisjärvi Sievi Siikajoki Siikalatva Taivalkoski Tyrnävä Utajärvi Ylivieska Total
133 Table 5b. The mean volume of growing stock in development classes on forest land by s. Municipality Open regeneration site Young seedling stand Advanced seedling stand Young thinning stand Advanced thinning stand m 3 /ha Mature stand Shelterwood stand Seed tree stand Forest land Lapland 047 Enontekiö Inari Kemi Keminmaa Kittilä Kolari Kemijärvi Muonio Pelkosenniemi Posio Ranua Rovaniemi Salla Savukoski Simo Sodankylä Tervola Tornio Pello Utsjoki Ylitornio Total
134 Table 5c. Development class distribution on forest land available for wood supply by s. Open regeneration site Young seedling stand Advanced seedling stand Young thinning stand Advanced thinning stand Mature stand Shelterwood stand Seed tree stand Forest land Municipality ha % ha % ha % ha % ha % ha % ha % ha % ha % Åland 035 Brändö Eckerö Finström Föglö Geta Hammarland Jomala Kumlinge Kökar Lemland Lumparland Mariehamn-Maarianhamina Saltvik Sottunga Sund Vårdö Total Rannikko/Etelärannikko 049 Espoo-Esbo Hanko-Hangö Helsinki-Helsingfors Vantaa-Vanda Ingå-Inkoo Kauniainen-Grankulla Kirkkonummi-Kyrkslätt Kemiönsaari Lapinjärvi-Lappträsk Loviisa-Lovisa Länsi-Turunmaa Porvoo-Borgå Raasepori Sipoo-Sibbo Siuntio-Sjundeå Total Rannikko/Pohjanmaan rannikko 231 Kaskinen-Kaskö Kokkola-Karleby Rannikko Korsnäs Kristinestad-Kristiinankaupunki Kronoby-Kruunupyy Larsmo-Luoto Malax-Maalahti Korsholm-Mustasaari
135 Table 5c. Development class distribution on forest land available for wood supply by s. Open regeneration site Young seedling stand Advanced seedling stand Young thinning stand Advanced thinning stand Mature stand Shelterwood stand Seed tree stand Forest land Municipality ha % ha % ha % ha % ha % ha % ha % ha % ha % 545 Närpes-Närpiö Jakobstad-Pietarsaari Pedersöre-Pedersören kunta Nykarleby-Uusikaarlepyy Vaasa-Vasa Vörå-Vöyri Total Lounais-Suomi 019 Aura Eura Eurajoki Harjavalta Honkajoki Huittinen Jämijärvi Kaarina Kankaanpää Karvia Kokemäki Koski T.l Kustavi Köyliö Laitila Lavia Lieto Loimaa Luvia Marttila Masku Merikarvia Mynämäki Naantali Nakkila Nousiainen Oripää Paimio Pomarkku Pori Pyhäranta Pöytyä Raisio Rauma Rusko Salo
136 Table 5c. Development class distribution on forest land available for wood supply by s. Open regeneration site Young seedling stand Advanced seedling stand Young thinning stand Advanced thinning stand Mature stand Shelterwood stand Seed tree stand Forest land Municipality ha % ha % ha % ha % ha % ha % ha % ha % ha % 738 Sauvo Siikainen Somero Säkylä Taivassalo Tarvasjoki Turku-Åbo Ulvila Uusikaupunki Vehmaa Total Häme-Uusimaa 016 Asikkala Askola Forssa Hartola Hattula Hausjärvi Hollola Humppila Hyvinkää Hämeenlinna Heinola Janakkala Jokioinen Järvenpää Karkkila Kerava Hämeenkoski Kärkölä Lahti Loppi Lohja Myrskylä-Mörskom Mäntsälä Nastola Nurmijärvi Orimattila Padasjoki Pornainen Pukkila Riihimäki Sysmä Tammela
137 Table 5c. Development class distribution on forest land available for wood supply by s. Open regeneration site Young seedling stand Advanced seedling stand Young thinning stand Advanced thinning stand Mature stand Shelterwood stand Seed tree stand Forest land Municipality ha % ha % ha % ha % ha % ha % ha % ha % ha % 858 Tuusula Vihti Ypäjä Total Kaakkois-Suomi 075 Hamina Iitti Imatra Kotka Kouvola Lappeenranta Lemi Luumäki Miehikkälä Parikkala Pyhtää-Pyttis Rautjärvi Ruokolahti Savitaipale Taipalsaari Virolahti Total Pirkanmaa 020 Akaa Hämeenkyrö Ikaalinen Juupajoki Kangasala Kihniö Lempäälä Mänttä-Vilppula Nokia Orivesi Parkano Pirkkala Punkalaidun Pälkäne Ruovesi Sastamala Tampere Urjala Valkeakoski Vesilahti Virrat
138 Table 5c. Development class distribution on forest land available for wood supply by s. Open regeneration site Young seedling stand Advanced seedling stand Young thinning stand Advanced thinning stand Mature stand Shelterwood stand Seed tree stand Forest land Municipality ha % ha % ha % ha % ha % ha % ha % ha % ha % 980 Ylöjärvi Total Etelä-Savo 046 Enonkoski Heinävesi Hirvensalmi Joroinen Juva Kangasniemi Mikkeli Mäntyharju Pertunmaa Pieksämäki Puumala Rantasalmi Savonlinna Sulkava Total Etelä-Pohjanmaa 005 Alajärvi Alavus Evijärvi Halsua Ilmajoki Isojoki Isokyrö Jalasjärvi Kannus Karijoki Kauhajoki Kauhava Kaustinen Kokkola-Karleby E-Pohjanmaa Kuortane Kurikka Laihia Lappajärvi Lapua Lestijärvi Perho Seinäjoki Soini Teuva Toholampi
139 Table 5c. Development class distribution on forest land available for wood supply by s. Open regeneration site Young seedling stand Advanced seedling stand Young thinning stand Advanced thinning stand Mature stand Shelterwood stand Seed tree stand Forest land Municipality ha % ha % ha % ha % ha % ha % ha % ha % ha % 924 Veteli Vimpeli Ähtäri Total Keski-Suomi 077 Hankasalmi Joutsa Jyväskylä Jämsä Kannonkoski Karstula Keuruu Kinnula Kivijärvi Konnevesi Kuhmoinen Kyyjärvi Laukaa Luhanka Multia Muurame Petäjävesi Pihtipudas Saarijärvi Toivakka Uurainen Viitasaari Äänekoski Total Pohjois-Savo 140 Iisalmi Juankoski Kaavi Keitele Kiuruvesi Kuopio Lapinlahti Leppävirta Maaninka Pielavesi Rautalampi Rautavaara Siilinjärvi Sonkajärvi
140 Table 5c. Development class distribution on forest land available for wood supply by s. Open regeneration site Young seedling stand Advanced seedling stand Young thinning stand Advanced thinning stand Mature stand Shelterwood stand Seed tree stand Forest land Municipality ha % ha % ha % ha % ha % ha % ha % ha % ha % 778 Suonenjoki Tervo Tuusniemi Varkaus Vesanto Vieremä Total Pohjois-Karjala 146 Ilomantsi Joensuu Juuka Kitee Kontiolahti Outokumpu Lieksa Liperi Nurmes Polvijärvi Rääkkylä Tohmajärvi Valtimo Total Kainuu 105 Hyrynsalmi Kajaani Kuhmo Paltamo Puolanka Ristijärvi Sotkamo Suomussalmi Vaala Total Pohjois-Pohjanmaa 009 Alavieska Haapajärvi Haapavesi Hailuoto Kalajoki Ii Kempele Kuusamo Kärsämäki Liminka
141 Table 5c. Development class distribution on forest land available for wood supply by s. Open regeneration site Young seedling stand Advanced seedling stand Young thinning stand Advanced thinning stand Mature stand Shelterwood stand Seed tree stand Forest land Municipality ha % ha % ha % ha % ha % ha % ha % ha % ha % 436 Lumijoki Merijärvi Muhos Nivala Oulainen Oulu Pudasjärvi Pyhäjoki Pyhäsalmi Pyhäntä Raahe Reisjärvi Sievi Siikajoki Siikalatva Taivalkoski Tyrnävä Utajärvi Ylivieska Total Lapland 047 Enontekiö Inari Kemi Keminmaa Kittilä Kolari Kemijärvi Muonio Pelkosenniemi Posio Ranua Rovaniemi Salla Savukoski Simo Sodankylä Tervola Tornio Pello Utsjoki Ylitornio Total
142 Table 5d. The mean volume of growing stock in development classes on forest land available for wood supply by Forest Centre regions. Municipality Open regeneration site Young seedling stand Advanced seedling stand Young thinning stand Advanced thinning stand Mature stand Shelterwood stand Seed tree stand Forest land Åland 035 Brändö Eckerö Finström Föglö Geta Hammarland Jomala Kumlinge Kökar Lemland Lumparland Mariehamn-Maarianhamina Saltvik Sottunga Sund Vårdö Total Rannikko/Etelärannikko 049 Espoo-Esbo Hanko-Hangö Helsinki-Helsingfors Vantaa-Vanda Ingå-Inkoo Kauniainen-Grankulla Kirkkonummi-Kyrkslätt Kemiönsaari Lapinjärvi-Lappträsk Loviisa-Lovisa Länsi-Turunmaa Porvoo-Borgå Raasepori Sipoo-Sibbo Siuntio-Sjundeå Total Rannikko/Pohjanmaan rannikko 231 Kaskinen-Kaskö Kokkola-Karleby Rannikko Korsnäs Kristinestad-Kristiinankaupunki Kronoby-Kruunupyy Larsmo-Luoto Malax-Maalahti Korsholm-Mustasaari Närpes-Närpiö Jakobstad-Pietarsaari Pedersöre-Pedersören kunta Nykarleby-Uusikaarlepyy Vaasa-Vasa Vörå-Vöyri Total Lounais-Suomi 019 Aura Eura Eurajoki Harjavalta Honkajoki Huittinen Jämijärvi Kaarina Kankaanpää Karvia Kokemäki Koski T.l Kustavi Köyliö Laitila Lavia Lieto Loimaa Luvia Marttila Masku Merikarvia Mynämäki Naantali Nakkila Nousiainen Oripää Paimio m 3 /ha
143 Table 5d. The mean volume of growing stock in development classes on forest land available for wood supply by Forest Centre regions. Municipality Open regeneration site Young seedling stand Advanced seedling stand Young thinning stand Advanced thinning stand m 3 /ha Mature stand Shelterwood stand Seed tree stand Forest land 608 Pomarkku Pori Pyhäranta Pöytyä Raisio Rauma Rusko Salo Sauvo Siikainen Somero Säkylä Taivassalo Tarvasjoki Turku-Åbo Ulvila Uusikaupunki Vehmaa Total Häme-Uusimaa 016 Asikkala Askola Forssa Hartola Hattula Hausjärvi Hollola Humppila Hyvinkää Hämeenlinna Heinola Janakkala Jokioinen Järvenpää Karkkila Kerava Hämeenkoski Kärkölä Lahti Loppi Lohja Myrskylä-Mörskom Mäntsälä Nastola Nurmijärvi Orimattila Padasjoki Pornainen Pukkila Riihimäki Sysmä Tammela Tuusula Vihti Ypäjä Total Kaakkois-Suomi 075 Hamina Iitti Imatra Kotka Kouvola Lappeenranta Lemi Luumäki Miehikkälä Parikkala Pyhtää-Pyttis Rautjärvi Ruokolahti Savitaipale Taipalsaari Virolahti Total Pirkanmaa 020 Akaa Hämeenkyrö Ikaalinen Juupajoki Kangasala Kihniö
144 Table 5d. The mean volume of growing stock in development classes on forest land available for wood supply by Forest Centre regions. Municipality Open regeneration site Young seedling stand Advanced seedling stand Young thinning stand Advanced thinning stand m 3 /ha Mature stand Shelterwood stand Seed tree stand Forest land 418 Lempäälä Mänttä-Vilppula Nokia Orivesi Parkano Pirkkala Punkalaidun Pälkäne Ruovesi Sastamala Tampere Urjala Valkeakoski Vesilahti Virrat Ylöjärvi Total Etelä-Savo 046 Enonkoski Heinävesi Hirvensalmi Joroinen Juva Kangasniemi Mikkeli Mäntyharju Pertunmaa Pieksämäki Puumala Rantasalmi Savonlinna Sulkava Total Etelä-Pohjanmaa 005 Alajärvi Alavus Evijärvi Halsua Ilmajoki Isojoki Isokyrö Jalasjärvi Kannus Karijoki Kauhajoki Kauhava Kaustinen Kokkola-Karleby E-Pohjanmaa Kuortane Kurikka Laihia Lappajärvi Lapua Lestijärvi Perho Seinäjoki Soini Teuva Toholampi Veteli Vimpeli Ähtäri Total Keski-Suomi 077 Hankasalmi Joutsa Jyväskylä Jämsä Kannonkoski Karstula Keuruu Kinnula Kivijärvi Konnevesi Kuhmoinen Kyyjärvi Laukaa Luhanka Multia Muurame Petäjävesi
145 Table 5d. The mean volume of growing stock in development classes on forest land available for wood supply by Forest Centre regions. Municipality Open regeneration site Young seedling stand Advanced seedling stand Young thinning stand Advanced thinning stand m 3 /ha Mature stand Shelterwood stand Seed tree stand Forest land 601 Pihtipudas Saarijärvi Toivakka Uurainen Viitasaari Äänekoski Total Pohjois-Savo 140 Iisalmi Juankoski Kaavi Keitele Kiuruvesi Kuopio Lapinlahti Leppävirta Maaninka Pielavesi Rautalampi Rautavaara Siilinjärvi Sonkajärvi Suonenjoki Tervo Tuusniemi Varkaus Vesanto Vieremä Total Pohjois-Karjala 146 Ilomantsi Joensuu Juuka Kitee Kontiolahti Outokumpu Lieksa Liperi Nurmes Polvijärvi Rääkkylä Tohmajärvi Valtimo Total Kainuu 105 Hyrynsalmi Kajaani Kuhmo Paltamo Puolanka Ristijärvi Sotkamo Suomussalmi Vaala Total Pohjois-Pohjanmaa 009 Alavieska Haapajärvi Haapavesi Hailuoto Kalajoki Ii Kempele Kuusamo Kärsämäki Liminka Lumijoki Merijärvi Muhos Nivala Oulainen Oulu Pudasjärvi Pyhäjoki Pyhäsalmi Pyhäntä Raahe Reisjärvi Sievi Siikajoki Siikalatva
146 Table 5d. The mean volume of growing stock in development classes on forest land available for wood supply by Forest Centre regions. Municipality Open regeneration site Young seedling stand Advanced seedling stand Young thinning stand Advanced thinning stand m 3 /ha Mature stand Shelterwood stand Seed tree stand Forest land 832 Taivalkoski Tyrnävä Utajärvi Ylivieska Total Lapland 047 Enontekiö Inari Kemi Keminmaa Kittilä Kolari Kemijärvi Muonio Pelkosenniemi Posio Ranua Rovaniemi Salla Savukoski Simo Sodankylä Tervola Tornio Pello Utsjoki Ylitornio Total
147 Table 6a. The mean volume of growing stock by tree and roundwood assortment on forest and poorly productive forest land by s. Municipality pulpw. Spruce Spruce Spruce pulpw. pulpw. decid. tree decid. tree decid. tree All tree pulpw. Åland 035 Brändö Eckerö Finström Föglö Geta Hammarland Jomala Kumlinge Kökar Lemland Lumparland Mariehamn-Maarianhamina Saltvik Sottunga Sund Vårdö Total Rannikko/Etelärannikko 049 Espoo-Esbo Hanko-Hangö Helsinki-Helsingfors Vantaa-Vanda Ingå-Inkoo Kauniainen-Grankulla Kirkkonummi-Kyrkslätt Kemiönsaari Lapinjärvi-Lappträsk Loviisa-Lovisa Länsi-Turunmaa Porvoo-Borgå Raasepori Sipoo-Sibbo Siuntio-Sjundeå Total Rannikko/Pohjanmaan rannikko 231 Kaskinen-Kaskö Kokkola-Karleby Rannikko Korsnäs Kristinestad Kronoby-Kruunupyy Larsmo-Luoto Malax-Maalahti Korsholm-Mustasaari Närpes-Närpiö Jakobstad-Pietarsaari Pedersöre-Pedersören kunta Nykarleby-Uusikaarlepyy Vaasa-Vasa Vörå-Vöyri Total Lounais-Suomi 019 Aura Eura Eurajoki Harjavalta Honkajoki Huittinen Jämijärvi Kaarina Kankaanpää Karvia Kokemäki Koski T.l Kustavi Köyliö Laitila Lavia Lieto Loimaa Luvia Marttila Masku Merikarvia Mynämäki Naantali Nakkila Nousiainen m 3 /ha
148 Table 6a. The mean volume of growing stock by tree and roundwood assortment on forest and poorly productive forest land by s. Municipality pulpw. Spruce Spruce Spruce pulpw. m 3 /ha pulpw. decid. tree decid. tree decid. tree All tree pulpw. 561 Oripää Paimio Pomarkku Pori Pyhäranta Pöytyä Raisio Rauma Rusko Salo Sauvo Siikainen Somero Säkylä Taivassalo Tarvasjoki Turku-Åbo Ulvila Uusikaupunki Vehmaa Total Häme-Uusimaa 016 Asikkala Askola Forssa Hartola Hattula Hausjärvi Hollola Humppila Hyvinkää Hämeenlinna Heinola Janakkala Jokioinen Järvenpää Karkkila Kerava Hämeenkoski Kärkölä Lahti Loppi Lohja Myrskylä-Mörskom Mäntsälä Nastola Nurmijärvi Orimattila Padasjoki Pornainen Pukkila Riihimäki Sysmä Tammela Tuusula Vihti Ypäjä Total Kaakkois-Suomi 075 Hamina Iitti Imatra Kotka Kouvola Lappeenranta Lemi Luumäki Miehikkälä Parikkala Pyhtää-Pyttis Rautjärvi Ruokolahti Savitaipale Taipalsaari Virolahti Total Pirkanmaa 020 Akaa
149 Table 6a. The mean volume of growing stock by tree and roundwood assortment on forest and poorly productive forest land by s. Municipality pulpw. Spruce Spruce Spruce pulpw. m 3 /ha pulpw. decid. tree decid. tree decid. tree All tree pulpw. 108 Hämeenkyrö Ikaalinen Juupajoki Kangasala Kihniö Lempäälä Mänttä-Vilppula Nokia Orivesi Parkano Pirkkala Punkalaidun Pälkäne Ruovesi Sastamala Tampere Urjala Valkeakoski Vesilahti Virrat Ylöjärvi Total Etelä-Savo 046 Enonkoski Heinävesi Hirvensalmi Joroinen Juva Kangasniemi Mikkeli Mäntyharju Pertunmaa Pieksämäki Puumala Rantasalmi Savonlinna Sulkava Total Etelä-Pohjanmaa 005 Alajärvi Alavus Evijärvi Halsua Ilmajoki Isojoki Isokyrö Jalasjärvi Kannus Karijoki Kauhajoki Kauhava Kaustinen Kokkola-Karleby E-Pohjanmaa Kuortane Kurikka Laihia Lappajärvi Lapua Lestijärvi Perho Seinäjoki Soini Teuva Toholampi Veteli Vimpeli Ähtäri Total Keski-Suomi 077 Hankasalmi Joutsa Jyväskylä Jämsä Kannonkoski Karstula Keuruu Kinnula Kivijärvi
150 Table 6a. The mean volume of growing stock by tree and roundwood assortment on forest and poorly productive forest land by s. Municipality pulpw. Spruce Spruce Spruce pulpw. m 3 /ha pulpw. decid. tree decid. tree decid. tree All tree pulpw. 275 Konnevesi Kuhmoinen Kyyjärvi Laukaa Luhanka Multia Muurame Petäjävesi Pihtipudas Saarijärvi Toivakka Uurainen Viitasaari Äänekoski Total Pohjois-Savo 140 Iisalmi Juankoski Kaavi Keitele Kiuruvesi Kuopio Lapinlahti Leppävirta Maaninka Pielavesi Rautalampi Rautavaara Siilinjärvi Sonkajärvi Suonenjoki Tervo Tuusniemi Varkaus Vesanto Vieremä Total Pohjois-Karjala 146 Ilomantsi Joensuu Juuka Kitee Kontiolahti Outokumpu Lieksa Liperi Nurmes Polvijärvi Rääkkylä Tohmajärvi Valtimo Total Kainuu 105 Hyrynsalmi Kajaani Kuhmo Paltamo Puolanka Ristijärvi Sotkamo Suomussalmi Vaala Total Pohjois-Pohjanmaa 009 Alavieska Haapajärvi Haapavesi Hailuoto Kalajoki Ii Kempele Kuusamo Kärsämäki Liminka Lumijoki Merijärvi Muhos Nivala
151 Table 6a. The mean volume of growing stock by tree and roundwood assortment on forest and poorly productive forest land by s. Municipality pulpw. Spruce Spruce Spruce pulpw. m 3 /ha pulpw. decid. tree decid. tree decid. tree All tree pulpw. 563 Oulainen Oulu Pudasjärvi Pyhäjoki Pyhäsalmi Pyhäntä Raahe Reisjärvi Sievi Siikajoki Siikalatva Taivalkoski Tyrnävä Utajärvi Ylivieska Total Lapland 047 Enontekiö Inari Kemi Keminmaa Kittilä Kolari Kemijärvi Muonio Pelkosenniemi Posio Ranua Rovaniemi Salla Savukoski Simo Sodankylä Tervola Tornio Pello Utsjoki Ylitornio Total
152 Table 6b. The growing stock volume by tree and roundwood assortment on forest land and poorly productive forest land by s. Municipality pulpw. Spruce Spruce Spruce pulpw m 3 pulpw. decid. tree decid. tree decid. tree pulpw. All tree Åland 035 Brändö Eckerö Finström Föglö Geta Hammarland Jomala Kumlinge Kökar Lemland Lumparland Mariehamn-Maarianhamina Saltvik Sottunga Sund Vårdö Total Rannikko/Etelärannikko 049 Espoo-Esbo Hanko-Hangö Helsinki-Helsingfors Vantaa-Vanda Ingå-Inkoo Kauniainen-Grankulla Kirkkonummi-Kyrkslätt Kemiönsaari Lapinjärvi-Lappträsk Loviisa-Lovisa Länsi-Turunmaa Porvoo-Borgå Raasepori Sipoo-Sibbo Siuntio-Sjundeå Total Rannikko/Pohjanmaan rannikko 231 Kaskinen-Kaskö Kokkola-Karleby Rannikko Korsnäs Kristinestad Kronoby-Kruunupyy Larsmo-Luoto Malax-Maalahti Korsholm-Mustasaari Närpes-Närpiö Jakobstad-Pietarsaari Pedersöre-Pedersören kunta Nykarleby-Uusikaarlepyy Vaasa-Vasa Vörå-Vöyri Total Lounais-Suomi 019 Aura Eura Eurajoki Harjavalta Honkajoki Huittinen Jämijärvi Kaarina Kankaanpää Karvia Kokemäki Koski T.l Kustavi Köyliö Laitila Lavia Lieto Loimaa Luvia Marttila Masku Merikarvia Mynämäki Naantali Nakkila Nousiainen
153 Table 6b. The growing stock volume by tree and roundwood assortment on forest land and poorly productive forest land by s. Municipality pulpw. Spruce Spruce Spruce pulpw m 3 pulpw. decid. tree decid. tree decid. tree pulpw. All tree 561 Oripää Paimio Pomarkku Pori Pyhäranta Pöytyä Raisio Rauma Rusko Salo Sauvo Siikainen Somero Säkylä Taivassalo Tarvasjoki Turku-Åbo Ulvila Uusikaupunki Vehmaa Total Häme-Uusimaa 016 Asikkala Askola Forssa Hartola Hattula Hausjärvi Hollola Humppila Hyvinkää Hämeenlinna Heinola Janakkala Jokioinen Järvenpää Karkkila Kerava Hämeenkoski Kärkölä Lahti Loppi Lohja Myrskylä-Mörskom Mäntsälä Nastola Nurmijärvi Orimattila Padasjoki Pornainen Pukkila Riihimäki Sysmä Tammela Tuusula Vihti Ypäjä Total Kaakkois-Suomi 075 Hamina Iitti Imatra Kotka Kouvola Lappeenranta Lemi Luumäki Miehikkälä Parikkala Pyhtää-Pyttis Rautjärvi Ruokolahti Savitaipale Taipalsaari Virolahti Total Pirkanmaa 020 Akaa
154 Table 6b. The growing stock volume by tree and roundwood assortment on forest land and poorly productive forest land by s. Municipality pulpw. Spruce Spruce Spruce pulpw m 3 pulpw. decid. tree decid. tree decid. tree pulpw. All tree 108 Hämeenkyrö Ikaalinen Juupajoki Kangasala Kihniö Lempäälä Mänttä-Vilppula Nokia Orivesi Parkano Pirkkala Punkalaidun Pälkäne Ruovesi Sastamala Tampere Urjala Valkeakoski Vesilahti Virrat Ylöjärvi Total Etelä-Savo 046 Enonkoski Heinävesi Hirvensalmi Joroinen Juva Kangasniemi Mikkeli Mäntyharju Pertunmaa Pieksämäki Puumala Rantasalmi Savonlinna Sulkava Total Etelä-Pohjanmaa 005 Alajärvi Alavus Evijärvi Halsua Ilmajoki Isojoki Isokyrö Jalasjärvi Kannus Karijoki Kauhajoki Kauhava Kaustinen Kokkola-Karleby E-Pohjanmaa Kuortane Kurikka Laihia Lappajärvi Lapua Lestijärvi Perho Seinäjoki Soini Teuva Toholampi Veteli Vimpeli Ähtäri Total Keski-Suomi 077 Hankasalmi Joutsa Jyväskylä Jämsä Kannonkoski Karstula Keuruu Kinnula Kivijärvi
155 Table 6b. The growing stock volume by tree and roundwood assortment on forest land and poorly productive forest land by s. Municipality pulpw. Spruce Spruce Spruce pulpw m 3 pulpw. decid. tree decid. tree decid. tree pulpw. All tree 275 Konnevesi Kuhmoinen Kyyjärvi Laukaa Luhanka Multia Muurame Petäjävesi Pihtipudas Saarijärvi Toivakka Uurainen Viitasaari Äänekoski Total Pohjois-Savo 140 Iisalmi Juankoski Kaavi Keitele Kiuruvesi Kuopio Lapinlahti Leppävirta Maaninka Pielavesi Rautalampi Rautavaara Siilinjärvi Sonkajärvi Suonenjoki Tervo Tuusniemi Varkaus Vesanto Vieremä Total Pohjois-Karjala 146 Ilomantsi Joensuu Juuka Kitee Kontiolahti Outokumpu Lieksa Liperi Nurmes Polvijärvi Rääkkylä Tohmajärvi Valtimo Total Kainuu 105 Hyrynsalmi Kajaani Kuhmo Paltamo Puolanka Ristijärvi Sotkamo Suomussalmi Vaala Total Pohjois-Pohjanmaa 009 Alavieska Haapajärvi Haapavesi Hailuoto Kalajoki Ii Kempele Kuusamo Kärsämäki Liminka Lumijoki Merijärvi Muhos Nivala
156 Table 6b. The growing stock volume by tree and roundwood assortment on forest land and poorly productive forest land by s. Municipality pulpw. Spruce Spruce Spruce pulpw m 3 pulpw. decid. tree decid. tree decid. tree pulpw. All tree 563 Oulainen Oulu Pudasjärvi Pyhäjoki Pyhäsalmi Pyhäntä Raahe Reisjärvi Sievi Siikajoki Siikalatva Taivalkoski Tyrnävä Utajärvi Ylivieska Total Lapland 047 Enontekiö Inari Kemi Keminmaa Kittilä Kolari Kemijärvi Muonio Pelkosenniemi Posio Ranua Rovaniemi Salla Savukoski Simo Sodankylä Tervola Tornio Pello Utsjoki Ylitornio Total
157 Table 6c. The mean volume of growing stock by tree and roundwood assortment on forest and poorly productive forest land available for wood supply by s. Municipality pulpw. Spruce Spruce Spruce pulpw. pulpw. decid. tree decid. tree decid. tree All tree pulpw. Åland 035 Brändö Eckerö Finström Föglö Geta Hammarland Jomala Kumlinge Kökar Lemland Lumparland Mariehamn-Maarianhamina Saltvik Sottunga Sund Vårdö Total Rannikko/Etelärannikko 049 Espoo-Esbo Hanko-Hangö Helsinki-Helsingfors Vantaa-Vanda Ingå-Inkoo Kauniainen-Grankulla Kirkkonummi-Kyrkslätt Kemiönsaari Lapinjärvi-Lappträsk Loviisa-Lovisa Länsi-Turunmaa Porvoo-Borgå Raasepori Sipoo-Sibbo Siuntio-Sjundeå Total Rannikko/Pohjanmaan rannikko 231 Kaskinen-Kaskö Kokkola-Karleby Rannikko Korsnäs Kristinestad Kronoby-Kruunupyy Larsmo-Luoto Malax-Maalahti Korsholm-Mustasaari Närpes-Närpiö Jakobstad-Pietarsaari Pedersöre-Pedersören kunta Nykarleby-Uusikaarlepyy Vaasa-Vasa Vörå-Vöyri Total Lounais-Suomi 019 Aura Eura Eurajoki Harjavalta Honkajoki Huittinen Jämijärvi Kaarina Kankaanpää Karvia Kokemäki Koski T.l Kustavi Köyliö Laitila Lavia Lieto Loimaa Luvia Marttila Masku Merikarvia Mynämäki Naantali Nakkila Nousiainen m 3 /ha
158 Table 6c. The mean volume of growing stock by tree and roundwood assortment on forest and poorly productive forest land available for wood supply by s. Municipality pulpw. Spruce Spruce Spruce pulpw. m 3 /ha pulpw. decid. tree decid. tree decid. tree All tree pulpw. 561 Oripää Paimio Pomarkku Pori Pyhäranta Pöytyä Raisio Rauma Rusko Salo Sauvo Siikainen Somero Säkylä Taivassalo Tarvasjoki Turku-Åbo Ulvila Uusikaupunki Vehmaa Total Häme-Uusimaa 016 Asikkala Askola Forssa Hartola Hattula Hausjärvi Hollola Humppila Hyvinkää Hämeenlinna Heinola Janakkala Jokioinen Järvenpää Karkkila Kerava Hämeenkoski Kärkölä Lahti Loppi Lohja Myrskylä-Mörskom Mäntsälä Nastola Nurmijärvi Orimattila Padasjoki Pornainen Pukkila Riihimäki Sysmä Tammela Tuusula Vihti Ypäjä Total Kaakkois-Suomi 075 Hamina Iitti Imatra Kotka Kouvola Lappeenranta Lemi Luumäki Miehikkälä Parikkala Pyhtää-Pyttis Rautjärvi Ruokolahti Savitaipale Taipalsaari Virolahti Total Pirkanmaa 020 Akaa
159 Table 6c. The mean volume of growing stock by tree and roundwood assortment on forest and poorly productive forest land available for wood supply by s. Municipality pulpw. Spruce Spruce Spruce pulpw. m 3 /ha pulpw. decid. tree decid. tree decid. tree All tree pulpw. 108 Hämeenkyrö Ikaalinen Juupajoki Kangasala Kihniö Lempäälä Mänttä-Vilppula Nokia Orivesi Parkano Pirkkala Punkalaidun Pälkäne Ruovesi Sastamala Tampere Urjala Valkeakoski Vesilahti Virrat Ylöjärvi Total Etelä-Savo 046 Enonkoski Heinävesi Hirvensalmi Joroinen Juva Kangasniemi Mikkeli Mäntyharju Pertunmaa Pieksämäki Puumala Rantasalmi Savonlinna Sulkava Total Etelä-Pohjanmaa 005 Alajärvi Alavus Evijärvi Halsua Ilmajoki Isojoki Isokyrö Jalasjärvi Kannus Karijoki Kauhajoki Kauhava Kaustinen Kokkola-Karleby E-Pohjanmaa Kuortane Kurikka Laihia Lappajärvi Lapua Lestijärvi Perho Seinäjoki Soini Teuva Toholampi Veteli Vimpeli Ähtäri Total Keski-Suomi 077 Hankasalmi Joutsa Jyväskylä Jämsä Kannonkoski Karstula Keuruu Kinnula Kivijärvi
160 Table 6c. The mean volume of growing stock by tree and roundwood assortment on forest and poorly productive forest land available for wood supply by s. Municipality pulpw. Spruce Spruce Spruce pulpw. m 3 /ha pulpw. decid. tree decid. tree decid. tree All tree pulpw. 275 Konnevesi Kuhmoinen Kyyjärvi Laukaa Luhanka Multia Muurame Petäjävesi Pihtipudas Saarijärvi Toivakka Uurainen Viitasaari Äänekoski Total Pohjois-Savo 140 Iisalmi Juankoski Kaavi Keitele Kiuruvesi Kuopio Lapinlahti Leppävirta Maaninka Pielavesi Rautalampi Rautavaara Siilinjärvi Sonkajärvi Suonenjoki Tervo Tuusniemi Varkaus Vesanto Vieremä Total Pohjois-Karjala 146 Ilomantsi Joensuu Juuka Kitee Kontiolahti Outokumpu Lieksa Liperi Nurmes Polvijärvi Rääkkylä Tohmajärvi Valtimo Total Kainuu 105 Hyrynsalmi Kajaani Kuhmo Paltamo Puolanka Ristijärvi Sotkamo Suomussalmi Vaala Total Pohjois-Pohjanmaa 009 Alavieska Haapajärvi Haapavesi Hailuoto Kalajoki Ii Kempele Kuusamo Kärsämäki Liminka Lumijoki Merijärvi Muhos Nivala
161 Table 6c. The mean volume of growing stock by tree and roundwood assortment on forest and poorly productive forest land available for wood supply by s. Municipality pulpw. Spruce Spruce Spruce pulpw. m 3 /ha pulpw. decid. tree decid. tree decid. tree All tree pulpw. 563 Oulainen Oulu Pudasjärvi Pyhäjoki Pyhäsalmi Pyhäntä Raahe Reisjärvi Sievi Siikajoki Siikalatva Taivalkoski Tyrnävä Utajärvi Ylivieska Total Lapland 047 Enontekiö Inari Kemi Keminmaa Kittilä Kolari Kemijärvi Muonio Pelkosenniemi Posio Ranua Rovaniemi Salla Savukoski Simo Sodankylä Tervola Tornio Pello Utsjoki Ylitornio Total
162 Table 6d. The growing stock volume by tree and roundwood assortment on forest land and poorly productive forest land available for wood supply by s. Municipality pulpw. Spruce Spruce Spruce pulpw m 3 pulpw. decid. tree decid. tree decid. tree pulpw. All tree Åland 035 Brändö Eckerö Finström Föglö Geta Hammarland Jomala Kumlinge Kökar Lemland Lumparland Mariehamn-Maarianhamina Saltvik Sottunga Sund Vårdö Total Rannikko/Etelärannikko 049 Espoo-Esbo Hanko-Hangö Helsinki-Helsingfors Vantaa-Vanda Ingå-Inkoo Kauniainen-Grankulla Kirkkonummi-Kyrkslätt Kemiönsaari Lapinjärvi-Lappträsk Loviisa-Lovisa Länsi-Turunmaa Porvoo-Borgå Raasepori Sipoo-Sibbo Siuntio-Sjundeå Total Rannikko/Pohjanmaan rannikko 231 Kaskinen-Kaskö Kokkola-Karleby Rannikko Korsnäs Kristinestad Kronoby-Kruunupyy Larsmo-Luoto Malax-Maalahti Korsholm-Mustasaari Närpes-Närpiö Jakobstad-Pietarsaari Pedersöre-Pedersören kunta Nykarleby-Uusikaarlepyy Vaasa-Vasa Vörå-Vöyri Total Lounais-Suomi 019 Aura Eura Eurajoki Harjavalta Honkajoki Huittinen Jämijärvi Kaarina Kankaanpää Karvia Kokemäki Koski T.l Kustavi Köyliö Laitila Lavia Lieto Loimaa Luvia Marttila Masku Merikarvia Mynämäki Naantali Nakkila Nousiainen
163 Table 6d. The growing stock volume by tree and roundwood assortment on forest land and poorly productive forest land available for wood supply by s. Municipality pulpw. Spruce Spruce Spruce pulpw m 3 pulpw. decid. tree decid. tree decid. tree pulpw. All tree 561 Oripää Paimio Pomarkku Pori Pyhäranta Pöytyä Raisio Rauma Rusko Salo Sauvo Siikainen Somero Säkylä Taivassalo Tarvasjoki Turku-Åbo Ulvila Uusikaupunki Vehmaa Total Häme-Uusimaa 016 Asikkala Askola Forssa Hartola Hattula Hausjärvi Hollola Humppila Hyvinkää Hämeenlinna Heinola Janakkala Jokioinen Järvenpää Karkkila Kerava Hämeenkoski Kärkölä Lahti Loppi Lohja Myrskylä-Mörskom Mäntsälä Nastola Nurmijärvi Orimattila Padasjoki Pornainen Pukkila Riihimäki Sysmä Tammela Tuusula Vihti Ypäjä Total Kaakkois-Suomi 075 Hamina Iitti Imatra Kotka Kouvola Lappeenranta Lemi Luumäki Miehikkälä Parikkala Pyhtää-Pyttis Rautjärvi Ruokolahti Savitaipale Taipalsaari Virolahti Total Pirkanmaa 020 Akaa
164 Table 6d. The growing stock volume by tree and roundwood assortment on forest land and poorly productive forest land available for wood supply by s. Municipality pulpw. Spruce Spruce Spruce pulpw m 3 pulpw. decid. tree decid. tree decid. tree pulpw. All tree 108 Hämeenkyrö Ikaalinen Juupajoki Kangasala Kihniö Lempäälä Mänttä-Vilppula Nokia Orivesi Parkano Pirkkala Punkalaidun Pälkäne Ruovesi Sastamala Tampere Urjala Valkeakoski Vesilahti Virrat Ylöjärvi Total Etelä-Savo 046 Enonkoski Heinävesi Hirvensalmi Joroinen Juva Kangasniemi Mikkeli Mäntyharju Pertunmaa Pieksämäki Puumala Rantasalmi Savonlinna Sulkava Total Etelä-Pohjanmaa 005 Alajärvi Alavus Evijärvi Halsua Ilmajoki Isojoki Isokyrö Jalasjärvi Kannus Karijoki Kauhajoki Kauhava Kaustinen Kokkola-Karleby E-Pohjanmaa Kuortane Kurikka Laihia Lappajärvi Lapua Lestijärvi Perho Seinäjoki Soini Teuva Toholampi Veteli Vimpeli Ähtäri Total Keski-Suomi 077 Hankasalmi Joutsa Jyväskylä Jämsä Kannonkoski Karstula Keuruu Kinnula Kivijärvi
165 Table 6d. The growing stock volume by tree and roundwood assortment on forest land and poorly productive forest land available for wood supply by s. Municipality pulpw. Spruce Spruce Spruce pulpw m 3 pulpw. decid. tree decid. tree decid. tree pulpw. All tree 275 Konnevesi Kuhmoinen Kyyjärvi Laukaa Luhanka Multia Muurame Petäjävesi Pihtipudas Saarijärvi Toivakka Uurainen Viitasaari Äänekoski Total Pohjois-Savo 140 Iisalmi Juankoski Kaavi Keitele Kiuruvesi Kuopio Lapinlahti Leppävirta Maaninka Pielavesi Rautalampi Rautavaara Siilinjärvi Sonkajärvi Suonenjoki Tervo Tuusniemi Varkaus Vesanto Vieremä Total Pohjois-Karjala 146 Ilomantsi Joensuu Juuka Kitee Kontiolahti Outokumpu Lieksa Liperi Nurmes Polvijärvi Rääkkylä Tohmajärvi Valtimo Total Kainuu 105 Hyrynsalmi Kajaani Kuhmo Paltamo Puolanka Ristijärvi Sotkamo Suomussalmi Vaala Total Pohjois-Pohjanmaa 009 Alavieska Haapajärvi Haapavesi Hailuoto Kalajoki Ii Kempele Kuusamo Kärsämäki Liminka Lumijoki Merijärvi Muhos Nivala
166 Table 6d. The growing stock volume by tree and roundwood assortment on forest land and poorly productive forest land available for wood supply by s. Municipality pulpw. Spruce Spruce Spruce pulpw m 3 pulpw. decid. tree decid. tree decid. tree pulpw. All tree 563 Oulainen Oulu Pudasjärvi Pyhäjoki Pyhäsalmi Pyhäntä Raahe Reisjärvi Sievi Siikajoki Siikalatva Taivalkoski Tyrnävä Utajärvi Ylivieska Total Lapland 047 Enontekiö Inari Kemi Keminmaa Kittilä Kolari Kemijärvi Muonio Pelkosenniemi Posio Ranua Rovaniemi Salla Savukoski Simo Sodankylä Tervola Tornio Pello Utsjoki Ylitornio Total
167 Table 7a. The mean volume of growing stock by tree and roundwood assortment on forest land by s. Municipality pulpw. Spruce Spruce Spruce pulpw. pulpw. decid. tree decid. tree decid. tree All tree pulpw. Åland 035 Brändö Eckerö Finström Föglö Geta Hammarland Jomala Kumlinge Kökar Lemland Lumparland Mariehamn-Maarianhamina Saltvik Sottunga Sund Vårdö Total Rannikko/Etelärannikko 049 Espoo-Esbo Hanko-Hangö Helsinki-Helsingfors Vantaa-Vanda Ingå-Inkoo Kauniainen-Grankulla Kirkkonummi-Kyrkslätt Kemiönsaari Lapinjärvi-Lappträsk Loviisa-Lovisa Länsi-Turunmaa Porvoo-Borgå Raasepori Sipoo-Sibbo Siuntio-Sjundeå Total Rannikko/Pohjanmaan rannikko 231 Kaskinen-Kaskö Kokkola-Karleby Rannikko Korsnäs Kristinestad Kronoby-Kruunupyy Larsmo-Luoto Malax-Maalahti Korsholm-Mustasaari Närpes-Närpiö Jakobstad-Pietarsaari Pedersöre-Pedersören kunta Nykarleby-Uusikaarlepyy Vaasa-Vasa Vörå-Vöyri Total Lounais-Suomi 019 Aura Eura Eurajoki Harjavalta Honkajoki Huittinen Jämijärvi Kaarina Kankaanpää Karvia Kokemäki Koski T.l Kustavi Köyliö Laitila Lavia Lieto Loimaa Luvia Marttila Masku Merikarvia Mynämäki Naantali Nakkila Nousiainen Oripää m 3 /ha
168 Table 7a. The mean volume of growing stock by tree and roundwood assortment on forest land by s. Municipality pulpw. Spruce Spruce Spruce pulpw. m 3 /ha pulpw. decid. tree decid. tree decid. tree All tree pulpw. 577 Paimio Pomarkku Pori Pyhäranta Pöytyä Raisio Rauma Rusko Salo Sauvo Siikainen Somero Säkylä Taivassalo Tarvasjoki Turku-Åbo Ulvila Uusikaupunki Vehmaa Total Häme-Uusimaa 016 Asikkala Askola Forssa Hartola Hattula Hausjärvi Hollola Humppila Hyvinkää Hämeenlinna Heinola Janakkala Jokioinen Järvenpää Karkkila Kerava Hämeenkoski Kärkölä Lahti Loppi Lohja Myrskylä-Mörskom Mäntsälä Nastola Nurmijärvi Orimattila Padasjoki Pornainen Pukkila Riihimäki Sysmä Tammela Tuusula Vihti Ypäjä Total Kaakkois-Suomi 075 Hamina Iitti Imatra Kotka Kouvola Lappeenranta Lemi Luumäki Miehikkälä Parikkala Pyhtää-Pyttis Rautjärvi Ruokolahti Savitaipale Taipalsaari Virolahti Total Pirkanmaa 020 Akaa Hämeenkyrö Ikaalinen
169 Table 7a. The mean volume of growing stock by tree and roundwood assortment on forest land by s. Municipality pulpw. Spruce Spruce Spruce pulpw. m 3 /ha pulpw. decid. tree decid. tree decid. tree All tree pulpw. 177 Juupajoki Kangasala Kihniö Lempäälä Mänttä-Vilppula Nokia Orivesi Parkano Pirkkala Punkalaidun Pälkäne Ruovesi Sastamala Tampere Urjala Valkeakoski Vesilahti Virrat Ylöjärvi Total Etelä-Savo 046 Enonkoski Heinävesi Hirvensalmi Joroinen Juva Kangasniemi Mikkeli Mäntyharju Pertunmaa Pieksämäki Puumala Rantasalmi Savonlinna Sulkava Total Etelä-Pohjanmaa 005 Alajärvi Alavus Evijärvi Halsua Ilmajoki Isojoki Isokyrö Jalasjärvi Kannus Karijoki Kauhajoki Kauhava Kaustinen Kokkola-Karleby E-Pohjanmaa Kuortane Kurikka Laihia Lappajärvi Lapua Lestijärvi Perho Seinäjoki Soini Teuva Toholampi Veteli Vimpeli Ähtäri Total Keski-Suomi 077 Hankasalmi Joutsa Jyväskylä Jämsä Kannonkoski Karstula Keuruu Kinnula Kivijärvi Konnevesi Kuhmoinen Kyyjärvi
170 Table 7a. The mean volume of growing stock by tree and roundwood assortment on forest land by s. Municipality pulpw. Spruce Spruce Spruce pulpw. m 3 /ha pulpw. decid. tree decid. tree decid. tree All tree pulpw. 410 Laukaa Luhanka Multia Muurame Petäjävesi Pihtipudas Saarijärvi Toivakka Uurainen Viitasaari Äänekoski Total Pohjois-Savo 140 Iisalmi Juankoski Kaavi Keitele Kiuruvesi Kuopio Lapinlahti Leppävirta Maaninka Pielavesi Rautalampi Rautavaara Siilinjärvi Sonkajärvi Suonenjoki Tervo Tuusniemi Varkaus Vesanto Vieremä Total Pohjois-Karjala 146 Ilomantsi Joensuu Juuka Kitee Kontiolahti Outokumpu Lieksa Liperi Nurmes Polvijärvi Rääkkylä Tohmajärvi Valtimo Total Kainuu 105 Hyrynsalmi Kajaani Kuhmo Paltamo Puolanka Ristijärvi Sotkamo Suomussalmi Vaala Total Pohjois-Pohjanmaa 009 Alavieska Haapajärvi Haapavesi Hailuoto Kalajoki Ii Kempele Kuusamo Kärsämäki Liminka Lumijoki Merijärvi Muhos Nivala Oulainen Oulu Pudasjärvi Pyhäjoki
171 Table 7a. The mean volume of growing stock by tree and roundwood assortment on forest land by s. Municipality pulpw. Spruce Spruce Spruce pulpw. m 3 /ha pulpw. decid. tree decid. tree decid. tree All tree pulpw. 626 Pyhäsalmi Pyhäntä Raahe Reisjärvi Sievi Siikajoki Siikalatva Taivalkoski Tyrnävä Utajärvi Ylivieska Total Lapland 047 Enontekiö Inari Kemi Keminmaa Kittilä Kolari Kemijärvi Muonio Pelkosenniemi Posio Ranua Rovaniemi Salla Savukoski Simo Sodankylä Tervola Tornio Pello Utsjoki Ylitornio Total
172 Table 7b. The growing stock volume by tree and roundwood assortment on forest land by s. Municipality pulpw. Spruce Spruce Spruce pulpw m 3 pulpw. decid. tree decid. tree decid. tree pulpw. All tree Åland 035 Brändö Eckerö Finström Föglö Geta Hammarland Jomala Kumlinge Kökar Lemland Lumparland Mariehamn-Maarianhamina Saltvik Sottunga Sund Vårdö Total Rannikko/Etelärannikko 049 Espoo-Esbo Hanko-Hangö Helsinki-Helsingfors Vantaa-Vanda Ingå-Inkoo Kauniainen-Grankulla Kirkkonummi-Kyrkslätt Kemiönsaari Lapinjärvi-Lappträsk Loviisa-Lovisa Länsi-Turunmaa Porvoo-Borgå Raasepori Sipoo-Sibbo Siuntio-Sjundeå Total Rannikko/Pohjanmaan rannikko 231 Kaskinen-Kaskö Kokkola-Karleby Rannikko Korsnäs Kristinestad Kronoby-Kruunupyy Larsmo-Luoto Malax-Maalahti Korsholm-Mustasaari Närpes-Närpiö Jakobstad-Pietarsaari Pedersöre-Pedersören kunta Nykarleby-Uusikaarlepyy Vaasa-Vasa Vörå-Vöyri Total Lounais-Suomi 019 Aura Eura Eurajoki Harjavalta Honkajoki Huittinen Jämijärvi Kaarina Kankaanpää Karvia Kokemäki Koski T.l Kustavi Köyliö Laitila Lavia Lieto Loimaa Luvia Marttila Masku Merikarvia Mynämäki Naantali Nakkila Nousiainen
173 Table 7b. The growing stock volume by tree and roundwood assortment on forest land by s. Municipality pulpw. Spruce Spruce Spruce pulpw m 3 pulpw. decid. tree decid. tree decid. tree pulpw. All tree 561 Oripää Paimio Pomarkku Pori Pyhäranta Pöytyä Raisio Rauma Rusko Salo Sauvo Siikainen Somero Säkylä Taivassalo Tarvasjoki Turku-Åbo Ulvila Uusikaupunki Vehmaa Total Häme-Uusimaa 016 Asikkala Askola Forssa Hartola Hattula Hausjärvi Hollola Humppila Hyvinkää Hämeenlinna Heinola Janakkala Jokioinen Järvenpää Karkkila Kerava Hämeenkoski Kärkölä Lahti Loppi Lohja Myrskylä-Mörskom Mäntsälä Nastola Nurmijärvi Orimattila Padasjoki Pornainen Pukkila Riihimäki Sysmä Tammela Tuusula Vihti Ypäjä Total Kaakkois-Suomi 075 Hamina Iitti Imatra Kotka Kouvola Lappeenranta Lemi Luumäki Miehikkälä Parikkala Pyhtää-Pyttis Rautjärvi Ruokolahti Savitaipale Taipalsaari Virolahti Total Pirkanmaa 020 Akaa
174 Table 7b. The growing stock volume by tree and roundwood assortment on forest land by s. Municipality pulpw. Spruce Spruce Spruce pulpw m 3 pulpw. decid. tree decid. tree decid. tree pulpw. All tree 108 Hämeenkyrö Ikaalinen Juupajoki Kangasala Kihniö Lempäälä Mänttä-Vilppula Nokia Orivesi Parkano Pirkkala Punkalaidun Pälkäne Ruovesi Sastamala Tampere Urjala Valkeakoski Vesilahti Virrat Ylöjärvi Total Etelä-Savo 046 Enonkoski Heinävesi Hirvensalmi Joroinen Juva Kangasniemi Mikkeli Mäntyharju Pertunmaa Pieksämäki Puumala Rantasalmi Savonlinna Sulkava Total Etelä-Pohjanmaa 005 Alajärvi Alavus Evijärvi Halsua Ilmajoki Isojoki Isokyrö Jalasjärvi Kannus Karijoki Kauhajoki Kauhava Kaustinen Kokkola-Karleby E-Pohjanmaa Kuortane Kurikka Laihia Lappajärvi Lapua Lestijärvi Perho Seinäjoki Soini Teuva Toholampi Veteli Vimpeli Ähtäri Total Keski-Suomi 077 Hankasalmi Joutsa Jyväskylä Jämsä Kannonkoski Karstula Keuruu Kinnula Kivijärvi
175 Table 7b. The growing stock volume by tree and roundwood assortment on forest land by s. Municipality pulpw. Spruce Spruce Spruce pulpw m 3 pulpw. decid. tree decid. tree decid. tree pulpw. All tree 275 Konnevesi Kuhmoinen Kyyjärvi Laukaa Luhanka Multia Muurame Petäjävesi Pihtipudas Saarijärvi Toivakka Uurainen Viitasaari Äänekoski Total Pohjois-Savo 140 Iisalmi Juankoski Kaavi Keitele Kiuruvesi Kuopio Lapinlahti Leppävirta Maaninka Pielavesi Rautalampi Rautavaara Siilinjärvi Sonkajärvi Suonenjoki Tervo Tuusniemi Varkaus Vesanto Vieremä Total Pohjois-Karjala 146 Ilomantsi Joensuu Juuka Kitee Kontiolahti Outokumpu Lieksa Liperi Nurmes Polvijärvi Rääkkylä Tohmajärvi Valtimo Total Kainuu 105 Hyrynsalmi Kajaani Kuhmo Paltamo Puolanka Ristijärvi Sotkamo Suomussalmi Vaala Total Pohjois-Pohjanmaa 009 Alavieska Haapajärvi Haapavesi Hailuoto Kalajoki Ii Kempele Kuusamo Kärsämäki Liminka Lumijoki Merijärvi Muhos Nivala
176 Table 7b. The growing stock volume by tree and roundwood assortment on forest land by s. Municipality pulpw. Spruce Spruce Spruce pulpw m 3 pulpw. decid. tree decid. tree decid. tree pulpw. All tree 563 Oulainen Oulu Pudasjärvi Pyhäjoki Pyhäsalmi Pyhäntä Raahe Reisjärvi Sievi Siikajoki Siikalatva Taivalkoski Tyrnävä Utajärvi Ylivieska Total Lapland 047 Enontekiö Inari Kemi Keminmaa Kittilä Kolari Kemijärvi Muonio Pelkosenniemi Posio Ranua Rovaniemi Salla Savukoski Simo Sodankylä Tervola Tornio Pello Utsjoki Ylitornio Total
177 Table 7c. The mean volume of growing stock by tree and roundwood assortment on forest land available for wood supply by s. Municipality pulpw. Spruce Spruce Spruce pulpw. pulpw. decid. tree decid. tree decid. tree All tree pulpw. Åland 035 Brändö Eckerö Finström Föglö Geta Hammarland Jomala Kumlinge Kökar Lemland Lumparland Mariehamn-Maarianhamina Saltvik Sottunga Sund Vårdö Total Rannikko/Etelärannikko 049 Espoo-Esbo Hanko-Hangö Helsinki-Helsingfors Vantaa-Vanda Ingå-Inkoo Kauniainen-Grankulla Kirkkonummi-Kyrkslätt Kemiönsaari Lapinjärvi-Lappträsk Loviisa-Lovisa Länsi-Turunmaa Porvoo-Borgå Raasepori Sipoo-Sibbo Siuntio-Sjundeå Total Rannikko/Pohjanmaan rannikko 231 Kaskinen-Kaskö Kokkola-Karleby Rannikko Korsnäs Kristinestad Kronoby-Kruunupyy Larsmo-Luoto Malax-Maalahti Korsholm-Mustasaari Närpes-Närpiö Jakobstad-Pietarsaari Pedersöre-Pedersören kunta Nykarleby-Uusikaarlepyy Vaasa-Vasa Vörå-Vöyri Total Lounais-Suomi 019 Aura Eura Eurajoki Harjavalta Honkajoki Huittinen Jämijärvi Kaarina Kankaanpää Karvia Kokemäki Koski T.l Kustavi Köyliö Laitila Lavia Lieto Loimaa Luvia Marttila Masku Merikarvia Mynämäki Naantali Nakkila Nousiainen m 3 /ha
178 Table 7c. The mean volume of growing stock by tree and roundwood assortment on forest land available for wood supply by s. Municipality pulpw. Spruce Spruce Spruce pulpw. m 3 /ha pulpw. decid. tree decid. tree decid. tree All tree pulpw. 561 Oripää Paimio Pomarkku Pori Pyhäranta Pöytyä Raisio Rauma Rusko Salo Sauvo Siikainen Somero Säkylä Taivassalo Tarvasjoki Turku-Åbo Ulvila Uusikaupunki Vehmaa Total Häme-Uusimaa 016 Asikkala Askola Forssa Hartola Hattula Hausjärvi Hollola Humppila Hyvinkää Hämeenlinna Heinola Janakkala Jokioinen Järvenpää Karkkila Kerava Hämeenkoski Kärkölä Lahti Loppi Lohja Myrskylä-Mörskom Mäntsälä Nastola Nurmijärvi Orimattila Padasjoki Pornainen Pukkila Riihimäki Sysmä Tammela Tuusula Vihti Ypäjä Total Kaakkois-Suomi 075 Hamina Iitti Imatra Kotka Kouvola Lappeenranta Lemi Luumäki Miehikkälä Parikkala Pyhtää-Pyttis Rautjärvi Ruokolahti Savitaipale Taipalsaari Virolahti Total Pirkanmaa 020 Akaa
179 Table 7c. The mean volume of growing stock by tree and roundwood assortment on forest land available for wood supply by s. Municipality pulpw. Spruce Spruce Spruce pulpw. m 3 /ha pulpw. decid. tree decid. tree decid. tree All tree pulpw. 108 Hämeenkyrö Ikaalinen Juupajoki Kangasala Kihniö Lempäälä Mänttä-Vilppula Nokia Orivesi Parkano Pirkkala Punkalaidun Pälkäne Ruovesi Sastamala Tampere Urjala Valkeakoski Vesilahti Virrat Ylöjärvi Total Etelä-Savo 046 Enonkoski Heinävesi Hirvensalmi Joroinen Juva Kangasniemi Mikkeli Mäntyharju Pertunmaa Pieksämäki Puumala Rantasalmi Savonlinna Sulkava Total Etelä-Pohjanmaa 005 Alajärvi Alavus Evijärvi Halsua Ilmajoki Isojoki Isokyrö Jalasjärvi Kannus Karijoki Kauhajoki Kauhava Kaustinen Kokkola-Karleby E-Pohjanmaa Kuortane Kurikka Laihia Lappajärvi Lapua Lestijärvi Perho Seinäjoki Soini Teuva Toholampi Veteli Vimpeli Ähtäri Total Keski-Suomi 077 Hankasalmi Joutsa Jyväskylä Jämsä Kannonkoski Karstula Keuruu Kinnula Kivijärvi
180 Table 7c. The mean volume of growing stock by tree and roundwood assortment on forest land available for wood supply by s. Municipality pulpw. Spruce Spruce Spruce pulpw. m 3 /ha pulpw. decid. tree decid. tree decid. tree All tree pulpw. 275 Konnevesi Kuhmoinen Kyyjärvi Laukaa Luhanka Multia Muurame Petäjävesi Pihtipudas Saarijärvi Toivakka Uurainen Viitasaari Äänekoski Total Pohjois-Savo 140 Iisalmi Juankoski Kaavi Keitele Kiuruvesi Kuopio Lapinlahti Leppävirta Maaninka Pielavesi Rautalampi Rautavaara Siilinjärvi Sonkajärvi Suonenjoki Tervo Tuusniemi Varkaus Vesanto Vieremä Total Pohjois-Karjala 146 Ilomantsi Joensuu Juuka Kitee Kontiolahti Outokumpu Lieksa Liperi Nurmes Polvijärvi Rääkkylä Tohmajärvi Valtimo Total Kainuu 105 Hyrynsalmi Kajaani Kuhmo Paltamo Puolanka Ristijärvi Sotkamo Suomussalmi Vaala Total Pohjois-Pohjanmaa 009 Alavieska Haapajärvi Haapavesi Hailuoto Kalajoki Ii Kempele Kuusamo Kärsämäki Liminka Lumijoki Merijärvi Muhos Nivala
181 Table 7c. The mean volume of growing stock by tree and roundwood assortment on forest land available for wood supply by s. Municipality pulpw. Spruce Spruce Spruce pulpw. m 3 /ha pulpw. decid. tree decid. tree decid. tree All tree pulpw. 563 Oulainen Oulu Pudasjärvi Pyhäjoki Pyhäsalmi Pyhäntä Raahe Reisjärvi Sievi Siikajoki Siikalatva Taivalkoski Tyrnävä Utajärvi Ylivieska Total Lapland 047 Enontekiö Inari Kemi Keminmaa Kittilä Kolari Kemijärvi Muonio Pelkosenniemi Posio Ranua Rovaniemi Salla Savukoski Simo Sodankylä Tervola Tornio Pello Utsjoki Ylitornio Total
182 Table 7d. The growing stock volume by tree and roundwood assortment on forest land available for wood supply by Forest Centre regions. Municipality pulpw. Spruce Spruce Spruce pulpw m 3 pulpw. decid. tree decid. tree decid. tree pulpw. All tree Åland 035 Brändö Eckerö Finström Föglö Geta Hammarland Jomala Kumlinge Kökar Lemland Lumparland Mariehamn-Maarianhamina Saltvik Sottunga Sund Vårdö Total Rannikko/Etelärannikko 049 Espoo-Esbo Hanko-Hangö Helsinki-Helsingfors Vantaa-Vanda Ingå-Inkoo Kauniainen-Grankulla Kirkkonummi-Kyrkslätt Kemiönsaari Lapinjärvi-Lappträsk Loviisa-Lovisa Länsi-Turunmaa Porvoo-Borgå Raasepori Sipoo-Sibbo Siuntio-Sjundeå Total Rannikko/Pohjanmaan rannikko 231 Kaskinen-Kaskö Kokkola-Karleby Rannikko Korsnäs Kristinestad Kronoby-Kruunupyy Larsmo-Luoto Malax-Maalahti Korsholm-Mustasaari Närpes-Närpiö Jakobstad-Pietarsaari Pedersöre-Pedersören kunta Nykarleby-Uusikaarlepyy Vaasa-Vasa Vörå-Vöyri Total Lounais-Suomi 019 Aura Eura Eurajoki Harjavalta Honkajoki Huittinen Jämijärvi Kaarina Kankaanpää Karvia Kokemäki Koski T.l Kustavi Köyliö Laitila Lavia Lieto Loimaa Luvia Marttila Masku Merikarvia Mynämäki Naantali Nakkila Nousiainen
183 Table 7d. The growing stock volume by tree and roundwood assortment on forest land available for wood supply by Forest Centre regions. Municipality pulpw. Spruce Spruce Spruce pulpw m 3 pulpw. decid. tree decid. tree decid. tree pulpw. All tree 561 Oripää Paimio Pomarkku Pori Pyhäranta Pöytyä Raisio Rauma Rusko Salo Sauvo Siikainen Somero Säkylä Taivassalo Tarvasjoki Turku-Åbo Ulvila Uusikaupunki Vehmaa Total Häme-Uusimaa 016 Asikkala Askola Forssa Hartola Hattula Hausjärvi Hollola Humppila Hyvinkää Hämeenlinna Heinola Janakkala Jokioinen Järvenpää Karkkila Kerava Hämeenkoski Kärkölä Lahti Loppi Lohja Myrskylä-Mörskom Mäntsälä Nastola Nurmijärvi Orimattila Padasjoki Pornainen Pukkila Riihimäki Sysmä Tammela Tuusula Vihti Ypäjä Total Kaakkois-Suomi 075 Hamina Iitti Imatra Kotka Kouvola Lappeenranta Lemi Luumäki Miehikkälä Parikkala Pyhtää-Pyttis Rautjärvi Ruokolahti Savitaipale Taipalsaari Virolahti Total Pirkanmaa 020 Akaa
184 Table 7d. The growing stock volume by tree and roundwood assortment on forest land available for wood supply by Forest Centre regions. Municipality pulpw. Spruce Spruce Spruce pulpw m 3 pulpw. decid. tree decid. tree decid. tree pulpw. All tree 108 Hämeenkyrö Ikaalinen Juupajoki Kangasala Kihniö Lempäälä Mänttä-Vilppula Nokia Orivesi Parkano Pirkkala Punkalaidun Pälkäne Ruovesi Sastamala Tampere Urjala Valkeakoski Vesilahti Virrat Ylöjärvi Total Etelä-Savo 046 Enonkoski Heinävesi Hirvensalmi Joroinen Juva Kangasniemi Mikkeli Mäntyharju Pertunmaa Pieksämäki Puumala Rantasalmi Savonlinna Sulkava Total Etelä-Pohjanmaa 005 Alajärvi Alavus Evijärvi Halsua Ilmajoki Isojoki Isokyrö Jalasjärvi Kannus Karijoki Kauhajoki Kauhava Kaustinen Kokkola-Karleby E-Pohjanmaa Kuortane Kurikka Laihia Lappajärvi Lapua Lestijärvi Perho Seinäjoki Soini Teuva Toholampi Veteli Vimpeli Ähtäri Total Keski-Suomi 077 Hankasalmi Joutsa Jyväskylä Jämsä Kannonkoski Karstula Keuruu Kinnula Kivijärvi
185 Table 7d. The growing stock volume by tree and roundwood assortment on forest land available for wood supply by Forest Centre regions. Municipality pulpw. Spruce Spruce Spruce pulpw m 3 pulpw. decid. tree decid. tree decid. tree pulpw. All tree 275 Konnevesi Kuhmoinen Kyyjärvi Laukaa Luhanka Multia Muurame Petäjävesi Pihtipudas Saarijärvi Toivakka Uurainen Viitasaari Äänekoski Total Pohjois-Savo 140 Iisalmi Juankoski Kaavi Keitele Kiuruvesi Kuopio Lapinlahti Leppävirta Maaninka Pielavesi Rautalampi Rautavaara Siilinjärvi Sonkajärvi Suonenjoki Tervo Tuusniemi Varkaus Vesanto Vieremä Total Pohjois-Karjala 146 Ilomantsi Joensuu Juuka Kitee Kontiolahti Outokumpu Lieksa Liperi Nurmes Polvijärvi Rääkkylä Tohmajärvi Valtimo Total Kainuu 105 Hyrynsalmi Kajaani Kuhmo Paltamo Puolanka Ristijärvi Sotkamo Suomussalmi Vaala Total Pohjois-Pohjanmaa 009 Alavieska Haapajärvi Haapavesi Hailuoto Kalajoki Ii Kempele Kuusamo Kärsämäki Liminka Lumijoki Merijärvi Muhos Nivala
186 Table 7d. The growing stock volume by tree and roundwood assortment on forest land available for wood supply by Forest Centre regions. Municipality pulpw. Spruce Spruce Spruce pulpw m 3 pulpw. decid. tree decid. tree decid. tree pulpw. All tree 563 Oulainen Oulu Pudasjärvi Pyhäjoki Pyhäsalmi Pyhäntä Raahe Reisjärvi Sievi Siikajoki Siikalatva Taivalkoski Tyrnävä Utajärvi Ylivieska Total Lapland 047 Enontekiö Inari Kemi Keminmaa Kittilä Kolari Kemijärvi Muonio Pelkosenniemi Posio Ranua Rovaniemi Salla Savukoski Simo Sodankylä Tervola Tornio Pello Utsjoki Ylitornio Total
187 Table 8a. The biomass of the tree compartments available for energy wood by tree in young thinning stands on forest land by s. Stands with proposed cutting for the first 5-year period selected. The assessed removal by plot stand based on regional thinning regimes Municipality Stem including bark Spruce Broadleaved All tree Branches Stem including Branch- Stem including Branch- Stem including Branch- Foliage bark es Foliage bark es Foliage bark es Foliage Åland 035 Brändö Eckerö Finström Föglö Geta Hammarland Jomala Kumlinge Kökar Lemland Lumparland Mariehamn-Maarianhamina Saltvik Sottunga Sund Vårdö Total Rannikko/Etelärannikko 049 Espoo-Esbo Hanko-Hangö Helsinki-Helsingfors Vantaa-Vanda Ingå-Inkoo Kauniainen-Grankulla Kirkkonummi-Kyrkslätt Kemiönsaari Lapinjärvi-Lappträsk Loviisa-Lovisa Länsi-Turunmaa Porvoo-Borgå Raasepori Sipoo-Sibbo Siuntio-Sjundeå Total Rannikko/Pohjanmaan rannikko 231 Kaskinen-Kaskö Kokkola-Karleby Rannikko Korsnäs Kristinestad Kronoby-Kruunupyy Larsmo-Luoto Malax-Maalahti Korsholm-Mustasaari Närpes-Närpiö Jakobstad-Pietarsaari Pedersöre-Pedersören kunta Nykarleby-Uusikaarlepyy Vaasa-Vasa Vörå-Vöyri Total Lounais-Suomi 019 Aura Eura Eurajoki Harjavalta Honkajoki Huittinen Jämijärvi Kaarina Kankaanpää Karvia Kokemäki Koski T.l Kustavi Köyliö Laitila Lavia Lieto Loimaa Luvia Marttila Masku Merikarvia Mynämäki Naantali Nakkila Nousiainen t
188 Table 8a. The biomass of the tree compartments available for energy wood by tree in young thinning stands on forest land by s. Stands with proposed cutting for the first 5-year period selected. The assessed removal by plot stand based on regional thinning regimes Municipality Stem including bark Spruce Broadleaved All tree Foliage Stem including bark Foliage 1000 t Stem including bark Foliage Stem including bark Branches Branches Branches Branches 561 Oripää Paimio Pomarkku Pori Pyhäranta Pöytyä Raisio Rauma Rusko Salo Sauvo Siikainen Somero Säkylä Taivassalo Tarvasjoki Turku-Åbo Ulvila Uusikaupunki Vehmaa Total Häme-Uusimaa 016 Asikkala Askola Forssa Hartola Hattula Hausjärvi Hollola Humppila Hyvinkää Hämeenlinna Heinola Janakkala Jokioinen Järvenpää Karkkila Kerava Hämeenkoski Kärkölä Lahti Loppi Lohja Myrskylä-Mörskom Mäntsälä Nastola Nurmijärvi Orimattila Padasjoki Pornainen Pukkila Riihimäki Sysmä Tammela Tuusula Vihti Ypäjä Total Kaakkois-Suomi 075 Hamina Iitti Imatra Kotka Kouvola Lappeenranta Lemi Luumäki Miehikkälä Parikkala Pyhtää-Pyttis Rautjärvi Ruokolahti Savitaipale Taipalsaari Virolahti Total Pirkanmaa 020 Akaa Foliage
189 Table 8a. The biomass of the tree compartments available for energy wood by tree in young thinning stands on forest land by s. Stands with proposed cutting for the first 5-year period selected. The assessed removal by plot stand based on regional thinning regimes Municipality Stem including bark Spruce Broadleaved All tree Foliage Stem including bark Foliage 1000 t Stem including bark Foliage Stem including bark Branches Branches Branches Branches 108 Hämeenkyrö Ikaalinen Juupajoki Kangasala Kihniö Lempäälä Mänttä-Vilppula Nokia Orivesi Parkano Pirkkala Punkalaidun Pälkäne Ruovesi Sastamala Tampere Urjala Valkeakoski Vesilahti Virrat Ylöjärvi Total Etelä-Savo 046 Enonkoski Heinävesi Hirvensalmi Joroinen Juva Kangasniemi Mikkeli Mäntyharju Pertunmaa Pieksämäki Puumala Rantasalmi Savonlinna Sulkava Total Etelä-Pohjanmaa 005 Alajärvi Alavus Evijärvi Halsua Ilmajoki Isojoki Isokyrö Jalasjärvi Kannus Karijoki Kauhajoki Kauhava Kaustinen Kokkola-Karleby E-Pohjanmaa Kuortane Kurikka Laihia Lappajärvi Lapua Lestijärvi Perho Seinäjoki Soini Teuva Toholampi Veteli Vimpeli Ähtäri Total Keski-Suomi 077 Hankasalmi Joutsa Jyväskylä Jämsä Kannonkoski Karstula Keuruu Kinnula Kivijärvi Foliage
190 Table 8a. The biomass of the tree compartments available for energy wood by tree in young thinning stands on forest land by s. Stands with proposed cutting for the first 5-year period selected. The assessed removal by plot stand based on regional thinning regimes Municipality Stem including bark Spruce Broadleaved All tree Foliage Stem including bark Foliage 1000 t Stem including bark Foliage Stem including bark Branches Branches Branches Branches 275 Konnevesi Kuhmoinen Kyyjärvi Laukaa Luhanka Multia Muurame Petäjävesi Pihtipudas Saarijärvi Toivakka Uurainen Viitasaari Äänekoski Total Pohjois-Savo 140 Iisalmi Juankoski Kaavi Keitele Kiuruvesi Kuopio Lapinlahti Leppävirta Maaninka Pielavesi Rautalampi Rautavaara Siilinjärvi Sonkajärvi Suonenjoki Tervo Tuusniemi Varkaus Vesanto Vieremä Total Pohjois-Karjala 146 Ilomantsi Joensuu Juuka Kitee Kontiolahti Outokumpu Lieksa Liperi Nurmes Polvijärvi Rääkkylä Tohmajärvi Valtimo Total Kainuu 105 Hyrynsalmi Kajaani Kuhmo Paltamo Puolanka Ristijärvi Sotkamo Suomussalmi Vaala Total Pohjois-Pohjanmaa 009 Alavieska Haapajärvi Haapavesi Hailuoto Kalajoki Ii Kempele Kuusamo Kärsämäki Liminka Lumijoki Merijärvi Muhos Nivala Foliage
191 Table 8a. The biomass of the tree compartments available for energy wood by tree in young thinning stands on forest land by s. Stands with proposed cutting for the first 5-year period selected. The assessed removal by plot stand based on regional thinning regimes Municipality Stem including bark Spruce Broadleaved All tree Foliage Stem including bark Foliage 1000 t Stem including bark Foliage Stem including bark Branches Branches Branches Branches 563 Oulainen Oulu Pudasjärvi Pyhäjoki Pyhäsalmi Pyhäntä Raahe Reisjärvi Sievi Siikajoki Siikalatva Taivalkoski Tyrnävä Utajärvi Ylivieska Total Lapland 047 Enontekiö Inari Kemi Keminmaa Kittilä Kolari Kemijärvi Muonio Pelkosenniemi Posio Ranua Rovaniemi Salla Savukoski Simo Sodankylä Tervola Tornio Pello Utsjoki Ylitornio Total Foliage
192 Table 8b. The biomass of the tree compartments available for energy wood by tree in mature stands on forest land by Forest Centre regions. Municipality Branches, foliage and stem residual Spruce Broadleaved All tree Branches, Branches, Branches, Stumps and big roots foliage and stem residual Stumps and big roots foliage and stem residual Stumps and big roots foliage and stem residual Stumps and big roots Åland 035 Brändö Eckerö Finström Föglö Geta Hammarland Jomala Kumlinge Kökar Lemland Lumparland Mariehamn-Maarianhamina Saltvik Sottunga Sund Vårdö Total Rannikko/Etelärannikko 049 Espoo-Esbo Hanko-Hangö Helsinki-Helsingfors Vantaa-Vanda Ingå-Inkoo Kauniainen-Grankulla Kirkkonummi-Kyrkslätt Kemiönsaari Lapinjärvi-Lappträsk Loviisa-Lovisa Länsi-Turunmaa Porvoo-Borgå Raasepori Sipoo-Sibbo Siuntio-Sjundeå Total Rannikko/Pohjanmaan rannikko 231 Kaskinen-Kaskö Kokkola-Karleby Rannikko Korsnäs Kristinestad Kronoby-Kruunupyy Larsmo-Luoto Malax-Maalahti Korsholm-Mustasaari Närpes-Närpiö Jakobstad-Pietarsaari Pedersöre-Pedersören kunta Nykarleby-Uusikaarlepyy Vaasa-Vasa Vörå-Vöyri Total Lounais-Suomi 019 Aura Eura Eurajoki Harjavalta Honkajoki Huittinen Jämijärvi Kaarina Kankaanpää Karvia Kokemäki Koski T.l Kustavi Köyliö Laitila Lavia Lieto t
193 Table 8b. The biomass of the tree compartments available for energy wood by tree in mature stands on forest land by Forest Centre regions. Municipality Branches, foliage and stem residual Spruce Broadleaved All tree Branches, Branches, Branches, Stumps and big roots foliage and stem residual Stumps and big roots foliage and stem residual Stumps and big roots foliage and stem residual 1000 t Stumps and big roots 430 Loimaa Luvia Marttila Masku Merikarvia Mynämäki Naantali Nakkila Nousiainen Oripää Paimio Pomarkku Pori Pyhäranta Pöytyä Raisio Rauma Rusko Salo Sauvo Siikainen Somero Säkylä Taivassalo Tarvasjoki Turku-Åbo Ulvila Uusikaupunki Vehmaa Total Häme-Uusimaa 016 Asikkala Askola Forssa Hartola Hattula Hausjärvi Hollola Humppila Hyvinkää Hämeenlinna Heinola Janakkala Jokioinen Järvenpää Karkkila Kerava Hämeenkoski Kärkölä Lahti Loppi Lohja Myrskylä-Mörskom Mäntsälä Nastola Nurmijärvi Orimattila Padasjoki Pornainen Pukkila Riihimäki Sysmä Tammela Tuusula Vihti Ypäjä Total Kaakkois-Suomi 075 Hamina
194 Table 8b. The biomass of the tree compartments available for energy wood by tree in mature stands on forest land by Forest Centre regions. Municipality Branches, foliage and stem residual Spruce Broadleaved All tree Branches, Branches, Branches, Stumps and big roots foliage and stem residual Stumps and big roots foliage and stem residual Stumps and big roots foliage and stem residual 1000 t Stumps and big roots 142 Iitti Imatra Kotka Kouvola Lappeenranta Lemi Luumäki Miehikkälä Parikkala Pyhtää-Pyttis Rautjärvi Ruokolahti Savitaipale Taipalsaari Virolahti Total Pirkanmaa 020 Akaa Hämeenkyrö Ikaalinen Juupajoki Kangasala Kihniö Lempäälä Mänttä-Vilppula Nokia Orivesi Parkano Pirkkala Punkalaidun Pälkäne Ruovesi Sastamala Tampere Urjala Valkeakoski Vesilahti Virrat Ylöjärvi Total Etelä-Savo 046 Enonkoski Heinävesi Hirvensalmi Joroinen Juva Kangasniemi Mikkeli Mäntyharju Pertunmaa Pieksämäki Puumala Rantasalmi Savonlinna Sulkava Total Etelä-Pohjanmaa 005 Alajärvi Alavus Evijärvi Halsua Ilmajoki Isojoki Isokyrö Jalasjärvi Kannus Karijoki Kauhajoki Kauhava
195 Table 8b. The biomass of the tree compartments available for energy wood by tree in mature stands on forest land by Forest Centre regions. Municipality Branches, foliage and stem residual Spruce Broadleaved All tree Branches, Branches, Branches, Stumps and big roots foliage and stem residual Stumps and big roots foliage and stem residual Stumps and big roots foliage and stem residual 1000 t Stumps and big roots 236 Kaustinen Kokkola-Karleby E Kuortane Kurikka Laihia Lappajärvi Lapua Lestijärvi Perho Seinäjoki Soini Teuva Toholampi Veteli Vimpeli Ähtäri Total Keski-Suomi 077 Hankasalmi Joutsa Jyväskylä Jämsä Kannonkoski Karstula Keuruu Kinnula Kivijärvi Konnevesi Kuhmoinen Kyyjärvi Laukaa Luhanka Multia Muurame Petäjävesi Pihtipudas Saarijärvi Toivakka Uurainen Viitasaari Äänekoski Total Pohjois-Savo 140 Iisalmi Juankoski Kaavi Keitele Kiuruvesi Kuopio Lapinlahti Leppävirta Maaninka Pielavesi Rautalampi Rautavaara Siilinjärvi Sonkajärvi Suonenjoki Tervo Tuusniemi Varkaus Vesanto Vieremä Total Pohjois-Karjala 146 Ilomantsi Joensuu Juuka Kitee
196 Table 8b. The biomass of the tree compartments available for energy wood by tree in mature stands on forest land by Forest Centre regions. Municipality Branches, foliage and stem residual Spruce Broadleaved All tree Branches, Branches, Branches, Stumps and big roots foliage and stem residual Stumps and big roots foliage and stem residual Stumps and big roots foliage and stem residual 1000 t Stumps and big roots 276 Kontiolahti Outokumpu Lieksa Liperi Nurmes Polvijärvi Rääkkylä Tohmajärvi Valtimo Total Kainuu 105 Hyrynsalmi Kajaani Kuhmo Paltamo Puolanka Ristijärvi Sotkamo Suomussalmi Vaala Total Pohjois-Pohjanmaa 009 Alavieska Haapajärvi Haapavesi Hailuoto Kalajoki Ii Kempele Kuusamo Kärsämäki Liminka Lumijoki Merijärvi Muhos Nivala Oulainen Oulu Pudasjärvi Pyhäjoki Pyhäsalmi Pyhäntä Raahe Reisjärvi Sievi Siikajoki Siikalatva Taivalkoski Tyrnävä Utajärvi Ylivieska Total Lapland 047 Enontekiö Inari Kemi Keminmaa Kittilä Kolari Kemijärvi Muonio Pelkosenniemi Posio Ranua Rovaniemi Salla Savukoski Simo Sodankylä
197 Table 8b. The biomass of the tree compartments available for energy wood by tree in mature stands on forest land by Forest Centre regions. Municipality Branches, foliage and stem residual Spruce Broadleaved All tree Branches, Branches, Branches, Stumps and big roots foliage and stem residual Stumps and big roots foliage and stem residual Stumps and big roots foliage and stem residual 1000 t Stumps and big roots 845 Tervola Tornio Pello Utsjoki Ylitornio Total
198 Table 8c. The biomass of the tree compartments available for energy wood by tree in young thinning stands on forest land available for wood supply by s. Stands with proposed cutting for the first 5-year period selected. The assessed removal by plot stand based on regional thinning regimes Municipality Stem including bark Spruce Broadleaved All tree Foliage Stem including bark Foliage Stem including bark Foliage Stem including bark Branches Branches Branches Branches Åland 035 Brändö Eckerö Finström Föglö Geta Hammarland Jomala Kumlinge Kökar Lemland Lumparland Mariehamn-Maarianhamina Saltvik Sottunga Sund Vårdö Total Rannikko/Etelärannikko 049 Espoo-Esbo Hanko-Hangö Helsinki-Helsingfors Vantaa-Vanda Ingå-Inkoo Kauniainen-Grankulla Kirkkonummi-Kyrkslätt Kemiönsaari Lapinjärvi-Lappträsk Loviisa-Lovisa Länsi-Turunmaa Porvoo-Borgå Raasepori Sipoo-Sibbo Siuntio-Sjundeå Total Rannikko/Pohjanmaan rannikko 231 Kaskinen-Kaskö Kokkola-Karleby Rannikko Korsnäs Kristinestad Kronoby-Kruunupyy Larsmo-Luoto Malax-Maalahti Korsholm-Mustasaari Närpes-Närpiö Jakobstad-Pietarsaari Pedersöre-Pedersören kunta Nykarleby-Uusikaarlepyy Vaasa-Vasa Vörå-Vöyri Total Lounais-Suomi 019 Aura Eura Eurajoki Harjavalta Honkajoki Huittinen Jämijärvi Kaarina Kankaanpää Karvia Kokemäki Koski T.l Kustavi Köyliö Laitila Lavia Lieto Loimaa Luvia Marttila Masku Merikarvia Mynämäki Naantali Nakkila Nousiainen t Foliage
199 Table 8c. The biomass of the tree compartments available for energy wood by tree in young thinning stands on forest land available for wood supply by s. Stands with proposed cutting for the first 5-year period selected. The assessed removal by plot stand based on regional thinning regimes Municipality Stem including bark Spruce Broadleaved All tree Branches Stem including Branch- Stem including Branch- Stem including Branch- Foliage bark es Foliage bark es Foliage bark es Foliage 561 Oripää Paimio Pomarkku Pori Pyhäranta Pöytyä Raisio Rauma Rusko Salo Sauvo Siikainen Somero Säkylä Taivassalo Tarvasjoki Turku-Åbo Ulvila Uusikaupunki Vehmaa Total Häme-Uusimaa 016 Asikkala Askola Forssa Hartola Hattula Hausjärvi Hollola Humppila Hyvinkää Hämeenlinna Heinola Janakkala Jokioinen Järvenpää Karkkila Kerava Hämeenkoski Kärkölä Lahti Loppi Lohja Myrskylä-Mörskom Mäntsälä Nastola Nurmijärvi Orimattila Padasjoki Pornainen Pukkila Riihimäki Sysmä Tammela Tuusula Vihti Ypäjä Total Kaakkois-Suomi 075 Hamina Iitti Imatra Kotka Kouvola Lappeenranta Lemi Luumäki Miehikkälä Parikkala Pyhtää-Pyttis Rautjärvi Ruokolahti Savitaipale Taipalsaari Virolahti Total Pirkanmaa 020 Akaa t
200 Table 8c. The biomass of the tree compartments available for energy wood by tree in young thinning stands on forest land available for wood supply by s. Stands with proposed cutting for the first 5-year period selected. The assessed removal by plot stand based on regional thinning regimes Municipality Stem including bark Spruce Broadleaved All tree Branches Stem including Branch- Stem including Branch- Stem including Branch- Foliage bark es Foliage bark es Foliage bark es Foliage 108 Hämeenkyrö Ikaalinen Juupajoki Kangasala Kihniö Lempäälä Mänttä-Vilppula Nokia Orivesi Parkano Pirkkala Punkalaidun Pälkäne Ruovesi Sastamala Tampere Urjala Valkeakoski Vesilahti Virrat Ylöjärvi Total Etelä-Savo 046 Enonkoski Heinävesi Hirvensalmi Joroinen Juva Kangasniemi Mikkeli Mäntyharju Pertunmaa Pieksämäki Puumala Rantasalmi Savonlinna Sulkava Total Etelä-Pohjanmaa 005 Alajärvi Alavus Evijärvi Halsua Ilmajoki Isojoki Isokyrö Jalasjärvi Kannus Karijoki Kauhajoki Kauhava Kaustinen Kokkola-Karleby E-Pohjanmaa Kuortane Kurikka Laihia Lappajärvi Lapua Lestijärvi Perho Seinäjoki Soini Teuva Toholampi Veteli Vimpeli Ähtäri Total Keski-Suomi 077 Hankasalmi Joutsa Jyväskylä Jämsä Kannonkoski Karstula Keuruu Kinnula Kivijärvi t
201 Table 8c. The biomass of the tree compartments available for energy wood by tree in young thinning stands on forest land available for wood supply by s. Stands with proposed cutting for the first 5-year period selected. The assessed removal by plot stand based on regional thinning regimes Municipality Stem including bark Spruce Broadleaved All tree Branches Stem including Branch- Stem including Branch- Stem including Branch- Foliage bark es Foliage bark es Foliage bark es Foliage 275 Konnevesi Kuhmoinen Kyyjärvi Laukaa Luhanka Multia Muurame Petäjävesi Pihtipudas Saarijärvi Toivakka Uurainen Viitasaari Äänekoski Total Pohjois-Savo 140 Iisalmi Juankoski Kaavi Keitele Kiuruvesi Kuopio Lapinlahti Leppävirta Maaninka Pielavesi Rautalampi Rautavaara Siilinjärvi Sonkajärvi Suonenjoki Tervo Tuusniemi Varkaus Vesanto Vieremä Total Pohjois-Karjala 146 Ilomantsi Joensuu Juuka Kitee Kontiolahti Outokumpu Lieksa Liperi Nurmes Polvijärvi Rääkkylä Tohmajärvi Valtimo Total Kainuu 105 Hyrynsalmi Kajaani Kuhmo Paltamo Puolanka Ristijärvi Sotkamo Suomussalmi Vaala Total Pohjois-Pohjanmaa 009 Alavieska Haapajärvi Haapavesi Hailuoto Kalajoki Ii Kempele Kuusamo Kärsämäki Liminka Lumijoki Merijärvi Muhos Nivala t
202 Table 8c. The biomass of the tree compartments available for energy wood by tree in young thinning stands on forest land available for wood supply by s. Stands with proposed cutting for the first 5-year period selected. The assessed removal by plot stand based on regional thinning regimes Municipality Stem including bark Spruce Broadleaved All tree Branches Stem including Branch- Stem including Branch- Stem including Branch- Foliage bark es Foliage bark es Foliage bark es Foliage 563 Oulainen Oulu Pudasjärvi Pyhäjoki Pyhäsalmi Pyhäntä Raahe Reisjärvi Sievi Siikajoki Siikalatva Taivalkoski Tyrnävä Utajärvi Ylivieska Total Lapland 047 Enontekiö Inari Kemi Keminmaa Kittilä Kolari Kemijärvi Muonio Pelkosenniemi Posio Ranua Rovaniemi Salla Savukoski Simo Sodankylä Tervola Tornio Pello Utsjoki Ylitornio Total t
203 Table 8d. The biomass of the tree compartments available for energy wood by tree in mature stands on forest land available for wood supply by s. Municipality Branches, foliage and stem residual Spruce Broadleaved All tree Branches, Branches, Branches, Stumps and big roots foliage and stem residual Stumps and big roots foliage and stem residual Stumps and big roots foliage and stem residual Stumps and big roots Åland 035 Brändö Eckerö Finström Föglö Geta Hammarland Jomala Kumlinge Kökar Lemland Lumparland Mariehamn-Maarianhamina Saltvik Sottunga Sund Vårdö Total Rannikko/Etelärannikko 049 Espoo-Esbo Hanko-Hangö Helsinki-Helsingfors Vantaa-Vanda Ingå-Inkoo Kauniainen-Grankulla Kirkkonummi-Kyrkslätt Kemiönsaari Lapinjärvi-Lappträsk Loviisa-Lovisa Länsi-Turunmaa Porvoo-Borgå Raasepori Sipoo-Sibbo Siuntio-Sjundeå Total Rannikko/Pohjanmaan rannikko 231 Kaskinen-Kaskö Kokkola-Karleby Rannikko Korsnäs Kristinestad Kronoby-Kruunupyy Larsmo-Luoto Malax-Maalahti Korsholm-Mustasaari Närpes-Närpiö Jakobstad-Pietarsaari Pedersöre-Pedersören kunta Nykarleby-Uusikaarlepyy Vaasa-Vasa Vörå-Vöyri Total Lounais-Suomi 019 Aura Eura Eurajoki Harjavalta Honkajoki Huittinen Jämijärvi Kaarina Kankaanpää Karvia Kokemäki Koski T.l Kustavi Köyliö Laitila Lavia Lieto t
204 Table 8d. The biomass of the tree compartments available for energy wood by tree in mature stands on forest land available for wood supply by s. Municipality Branches, foliage and stem residual Spruce Broadleaved All tree Branches, Branches, Branches, Stumps and big roots foliage and stem residual Stumps and big roots foliage and stem residual Stumps and big roots foliage and stem residual 1000 t Stumps and big roots 430 Loimaa Luvia Marttila Masku Merikarvia Mynämäki Naantali Nakkila Nousiainen Oripää Paimio Pomarkku Pori Pyhäranta Pöytyä Raisio Rauma Rusko Salo Sauvo Siikainen Somero Säkylä Taivassalo Tarvasjoki Turku-Åbo Ulvila Uusikaupunki Vehmaa Total Häme-Uusimaa 016 Asikkala Askola Forssa Hartola Hattula Hausjärvi Hollola Humppila Hyvinkää Hämeenlinna Heinola Janakkala Jokioinen Järvenpää Karkkila Kerava Hämeenkoski Kärkölä Lahti Loppi Lohja Myrskylä-Mörskom Mäntsälä Nastola Nurmijärvi Orimattila Padasjoki Pornainen Pukkila Riihimäki Sysmä Tammela Tuusula Vihti Ypäjä Total Kaakkois-Suomi 075 Hamina
205 Table 8d. The biomass of the tree compartments available for energy wood by tree in mature stands on forest land available for wood supply by s. Municipality Branches, foliage and stem residual Spruce Broadleaved All tree Branches, Branches, Branches, Stumps and big roots foliage and stem residual Stumps and big roots foliage and stem residual Stumps and big roots foliage and stem residual 1000 t Stumps and big roots 142 Iitti Imatra Kotka Kouvola Lappeenranta Lemi Luumäki Miehikkälä Parikkala Pyhtää-Pyttis Rautjärvi Ruokolahti Savitaipale Taipalsaari Virolahti Total Pirkanmaa 020 Akaa Hämeenkyrö Ikaalinen Juupajoki Kangasala Kihniö Lempäälä Mänttä-Vilppula Nokia Orivesi Parkano Pirkkala Punkalaidun Pälkäne Ruovesi Sastamala Tampere Urjala Valkeakoski Vesilahti Virrat Ylöjärvi Total Etelä-Savo 046 Enonkoski Heinävesi Hirvensalmi Joroinen Juva Kangasniemi Mikkeli Mäntyharju Pertunmaa Pieksämäki Puumala Rantasalmi Savonlinna Sulkava Total Etelä-Pohjanmaa 005 Alajärvi Alavus Evijärvi Halsua Ilmajoki Isojoki Isokyrö Jalasjärvi Kannus Karijoki Kauhajoki Kauhava
206 Table 8d. The biomass of the tree compartments available for energy wood by tree in mature stands on forest land available for wood supply by s. Municipality Branches, foliage and stem residual Spruce Broadleaved All tree Branches, Branches, Branches, Stumps and big roots foliage and stem residual Stumps and big roots foliage and stem residual Stumps and big roots foliage and stem residual 1000 t Stumps and big roots 236 Kaustinen Kokkola-Karleby E Kuortane Kurikka Laihia Lappajärvi Lapua Lestijärvi Perho Seinäjoki Soini Teuva Toholampi Veteli Vimpeli Ähtäri Total Keski-Suomi 077 Hankasalmi Joutsa Jyväskylä Jämsä Kannonkoski Karstula Keuruu Kinnula Kivijärvi Konnevesi Kuhmoinen Kyyjärvi Laukaa Luhanka Multia Muurame Petäjävesi Pihtipudas Saarijärvi Toivakka Uurainen Viitasaari Äänekoski Total Pohjois-Savo 140 Iisalmi Juankoski Kaavi Keitele Kiuruvesi Kuopio Lapinlahti Leppävirta Maaninka Pielavesi Rautalampi Rautavaara Siilinjärvi Sonkajärvi Suonenjoki Tervo Tuusniemi Varkaus Vesanto Vieremä Total Pohjois-Karjala 146 Ilomantsi Joensuu Juuka Kitee
207 Table 8d. The biomass of the tree compartments available for energy wood by tree in mature stands on forest land available for wood supply by s. Municipality Branches, foliage and stem residual Spruce Broadleaved All tree Branches, Branches, Branches, Stumps and big roots foliage and stem residual Stumps and big roots foliage and stem residual Stumps and big roots foliage and stem residual 1000 t Stumps and big roots 276 Kontiolahti Outokumpu Lieksa Liperi Nurmes Polvijärvi Rääkkylä Tohmajärvi Valtimo Total Kainuu 105 Hyrynsalmi Kajaani Kuhmo Paltamo Puolanka Ristijärvi Sotkamo Suomussalmi Vaala Total Pohjois-Pohjanmaa 009 Alavieska Haapajärvi Haapavesi Hailuoto Kalajoki Ii Kempele Kuusamo Kärsämäki Liminka Lumijoki Merijärvi Muhos Nivala Oulainen Oulu Pudasjärvi Pyhäjoki Pyhäsalmi Pyhäntä Raahe Reisjärvi Sievi Siikajoki Siikalatva Taivalkoski Tyrnävä Utajärvi Ylivieska Total Lapland 047 Enontekiö Inari Kemi Keminmaa Kittilä Kolari Kemijärvi Muonio Pelkosenniemi Posio Ranua Rovaniemi Salla Savukoski Simo Sodankylä
208 Table 8d. The biomass of the tree compartments available for energy wood by tree in mature stands on forest land available for wood supply by s. Municipality Branches, foliage and stem residual Spruce Broadleaved All tree Branches, Branches, Branches, Stumps and big roots foliage and stem residual Stumps and big roots foliage and stem residual Stumps and big roots foliage and stem residual 1000 t Stumps and big roots 845 Tervola Tornio Pello Utsjoki Ylitornio Total
209 Table 9. The biomass of tree compartments by tree on forest and poorly productive forest land by s. Municipality Stem including bark Branches Foliage Stumps Spruce Broadleaved Roots over 1 cm Stem including bark Branches Foliage Stumps 1000 t Roots over 1 cm Stem including bark Branches Foliage Stumps Roots over 1 cm Total biomass Åland 035 Brändö Eckerö Finström Föglö Geta Hammarland Jomala Kumlinge Kökar Lemland Lumparland Mariehamn-Maarianhamina Saltvik Sottunga Sund Vårdö Total Rannikko/Etelärannikko 049 Espoo-Esbo Hanko-Hangö Helsinki-Helsingfors Vantaa-Vanda Ingå-Inkoo Kauniainen-Grankulla Kirkkonummi-Kyrkslätt Kemiönsaari Lapinjärvi-Lappträsk Loviisa-Lovisa Länsi-Turunmaa Porvoo-Borgå Raasepori Sipoo-Sibbo Siuntio-Sjundeå Total Rannikko/Pohjanmaan rannikko 231 Kaskinen-Kaskö Kokkola-Karleby Rannikko Korsnäs Kristinestad Kronoby-Kruunupyy Larsmo-Luoto Malax-Maalahti Korsholm-Mustasaari Närpes-Närpiö Jakobstad-Pietarsaari Pedersöre-Pedersören kunta Nykarleby-Uusikaarlepyy Vaasa-Vasa
210 Table 9. The biomass of tree compartments by tree on forest and poorly productive forest land by s. Stem including bark Branches Foliage Stumps Spruce Broadleaved Roots over 1 cm Stem including bark Branches Foliage Stumps Municipality 1000 t Roots over 1 cm Stem including bark Branches Foliage Stumps 946 Vörå-Vöyri Total Lounais-Suomi 019 Aura Eura Eurajoki Harjavalta Honkajoki Huittinen Jämijärvi Kaarina Kankaanpää Karvia Kokemäki Koski T.l Kustavi Köyliö Laitila Lavia Lieto Loimaa Luvia Marttila Masku Merikarvia Mynämäki Naantali Nakkila Nousiainen Oripää Paimio Pomarkku Pori Pyhäranta Pöytyä Raisio Rauma Rusko Salo Sauvo Siikainen Somero Säkylä Taivassalo Tarvasjoki Turku-Åbo Ulvila Uusikaupunki Vehmaa Total Roots over 1 cm Total biomass
211 Table 9. The biomass of tree compartments by tree on forest and poorly productive forest land by s. Stem including bark Branches Foliage Stumps Spruce Broadleaved Roots over 1 cm Stem including bark Branches Foliage Stumps Municipality 1000 t Roots over 1 cm Stem including bark Branches Foliage Stumps Häme-Uusimaa 016 Asikkala Askola Forssa Hartola Hattula Hausjärvi Hollola Humppila Hyvinkää Hämeenlinna Heinola Janakkala Jokioinen Järvenpää Karkkila Kerava Hämeenkoski Kärkölä Lahti Loppi Lohja Myrskylä-Mörskom Mäntsälä Nastola Nurmijärvi Orimattila Padasjoki Pornainen Pukkila Riihimäki Sysmä Tammela Tuusula Vihti Ypäjä Total Kaakkois-Suomi 075 Hamina Iitti Imatra Kotka Kouvola Lappeenranta Lemi Luumäki Miehikkälä Parikkala Pyhtää-Pyttis Rautjärvi Roots over 1 cm Total biomass
212 Table 9. The biomass of tree compartments by tree on forest and poorly productive forest land by s. Stem including bark Branches Foliage Stumps Spruce Broadleaved Roots over 1 cm Stem including bark Branches Foliage Stumps Municipality 1000 t Roots over 1 cm Stem including bark Branches Foliage Stumps 700 Ruokolahti Savitaipale Taipalsaari Virolahti Total Pirkanmaa 020 Akaa Hämeenkyrö Ikaalinen Juupajoki Kangasala Kihniö Lempäälä Mänttä-Vilppula Nokia Orivesi Parkano Pirkkala Punkalaidun Pälkäne Ruovesi Sastamala Tampere Urjala Valkeakoski Vesilahti Virrat Ylöjärvi Total Etelä-Savo 046 Enonkoski Heinävesi Hirvensalmi Joroinen Juva Kangasniemi Mikkeli Mäntyharju Pertunmaa Pieksämäki Puumala Rantasalmi Savonlinna Sulkava Total Etelä-Pohjanmaa 005 Alajärvi Alavus Evijärvi Halsua Roots over 1 cm Total biomass
213 Table 9. The biomass of tree compartments by tree on forest and poorly productive forest land by s. Stem including bark Branches Foliage Stumps Spruce Broadleaved Roots over 1 cm Stem including bark Branches Foliage Stumps Municipality 1000 t Roots over 1 cm Stem including bark Branches Foliage Stumps 145 Ilmajoki Isojoki Isokyrö Jalasjärvi Kannus Karijoki Kauhajoki Kauhava Kaustinen Kokkola-Karleby E-Pohjanmaa Kuortane Kurikka Laihia Lappajärvi Lapua Lestijärvi Perho Seinäjoki Soini Teuva Toholampi Veteli Vimpeli Ähtäri Total Keski-Suomi 077 Hankasalmi Joutsa Jyväskylä Jämsä Kannonkoski Karstula Keuruu Kinnula Kivijärvi Konnevesi Kuhmoinen Kyyjärvi Laukaa Luhanka Multia Muurame Petäjävesi Pihtipudas Saarijärvi Toivakka Uurainen Viitasaari Äänekoski Total Roots over 1 cm Total biomass
214 Table 9. The biomass of tree compartments by tree on forest and poorly productive forest land by s. Stem including bark Branches Foliage Stumps Spruce Broadleaved Roots over 1 cm Stem including bark Branches Foliage Stumps Municipality 1000 t Roots over 1 cm Stem including bark Branches Foliage Stumps Pohjois-Savo 140 Iisalmi Juankoski Kaavi Keitele Kiuruvesi Kuopio Lapinlahti Leppävirta Maaninka Pielavesi Rautalampi Rautavaara Siilinjärvi Sonkajärvi Suonenjoki Tervo Tuusniemi Varkaus Vesanto Vieremä Total Pohjois-Karjala 146 Ilomantsi Joensuu Juuka Kitee Kontiolahti Outokumpu Lieksa Liperi Nurmes Polvijärvi Rääkkylä Tohmajärvi Valtimo Total Kainuu 105 Hyrynsalmi Kajaani Kuhmo Paltamo Puolanka Ristijärvi Sotkamo Suomussalmi Vaala Total Pohjois-Pohjanmaa 009 Alavieska Roots over 1 cm Total biomass
215 Table 9. The biomass of tree compartments by tree on forest and poorly productive forest land by s. Stem including bark Branches Foliage Stumps Spruce Broadleaved Roots over 1 cm Stem including bark Branches Foliage Stumps Municipality 1000 t Roots over 1 cm Stem including bark Branches Foliage Stumps 069 Haapajärvi Haapavesi Hailuoto Kalajoki Ii Kempele Kuusamo Kärsämäki Liminka Lumijoki Merijärvi Muhos Nivala Oulainen Oulu Pudasjärvi Pyhäjoki Pyhäsalmi Pyhäntä Raahe Reisjärvi Sievi Siikajoki Siikalatva Taivalkoski Tyrnävä Utajärvi Ylivieska Total Lapland 047 Enontekiö Inari Kemi Keminmaa Kittilä Kolari Kemijärvi Muonio Pelkosenniemi Posio Ranua Rovaniemi Salla Savukoski Simo Sodankylä Tervola Tornio Pello Utsjoki Roots over 1 cm Total biomass
216 Table 9. The biomass of tree compartments by tree on forest and poorly productive forest land by s. Stem including bark Branches Foliage Stumps Spruce Broadleaved Roots over 1 cm Stem including bark Branches Foliage Stumps Municipality 1000 t Roots over 1 cm Stem including bark Branches Foliage Stumps 976 Ylitornio Total Roots over 1 cm Total biomass
217
218
Efficiency change over time
 Efficiency change over time Heikki Tikanmäki Optimointiopin seminaari 14.11.2007 Contents Introduction (11.1) Window analysis (11.2) Example, application, analysis Malmquist index (11.3) Dealing with panel
Capacity Utilization
 Capacity Utilization Tim Schöneberg 28th November Agenda Introduction Fixed and variable input ressources Technical capacity utilization Price based capacity utilization measure Long run and short run
The Multi-source National Forest Inventory of Finland methods and results 2011
 ISBN 978-951-40-2516-7(PDF) ISSN 1795-150X The Multi-source National Forest Inventory of Finland methods and results 2011 Erkki Tomppo, Matti Katila, Kai Mäkisara, and Jouni Peräsaari www.metla.fi Working
Research plan for masters thesis in forest sciences. The PELLETime 2009 Symposium Mervi Juntunen
 Modelling tree and stand characteristics and estimating biomass removals and harvesting costs of lodgepole pine (Pinus contorta) plantations in Iceland Research plan for masters thesis in forest sciences
The Multi-source National Forest Inventory of Finland methods and results 2009
 ISBN 978-951-40-2428-3 (PDF) ISSN 1795-150X The Multi-source National Forest Inventory of Finland methods and results 2009 Erkki Tomppo, Matti Katila, Kai Mäkisara and Jouni Peräsaari www.metla.fi Working
National Building Code of Finland, Part D1, Building Water Supply and Sewerage Systems, Regulations and guidelines 2007
 National Building Code of Finland, Part D1, Building Water Supply and Sewerage Systems, Regulations and guidelines 2007 Chapter 2.4 Jukka Räisä 1 WATER PIPES PLACEMENT 2.4.1 Regulation Water pipe and its
The CCR Model and Production Correspondence
 The CCR Model and Production Correspondence Tim Schöneberg The 19th of September Agenda Introduction Definitions Production Possiblity Set CCR Model and the Dual Problem Input excesses and output shortfalls
Tynnyrivaara, OX2 Tuulivoimahanke. ( Layout 9 x N131 x HH145. Rakennukset Asuinrakennus Lomarakennus 9 x N131 x HH145 Varjostus 1 h/a 8 h/a 20 h/a
 , Tuulivoimahanke Layout 9 x N131 x HH145 Rakennukset Asuinrakennus Lomarakennus 9 x N131 x HH145 Varjostus 1 h/a 8 h/a 20 h/a 0 0,5 1 1,5 km 2 SHADOW - Main Result Assumptions for shadow calculations
Gap-filling methods for CH 4 data
 Gap-filling methods for CH 4 data Sigrid Dengel University of Helsinki Outline - Ecosystems known for CH 4 emissions; - Why is gap-filling of CH 4 data not as easy and straight forward as CO 2 ; - Gap-filling
Metsälamminkankaan tuulivoimapuiston osayleiskaava
 VAALAN KUNTA TUULISAIMAA OY Metsälamminkankaan tuulivoimapuiston osayleiskaava Liite 3. Varjostusmallinnus FCG SUUNNITTELU JA TEKNIIKKA OY 12.5.2015 P25370 SHADOW - Main Result Assumptions for shadow calculations
( ( OX2 Perkkiö. Rakennuskanta. Varjostus. 9 x N131 x HH145
 OX2 9 x N131 x HH145 Rakennuskanta Asuinrakennus Lomarakennus Liike- tai julkinen rakennus Teollinen rakennus Kirkko tai kirkollinen rak. Muu rakennus Allas Varjostus 1 h/a 8 h/a 20 h/a 0 0,5 1 1,5 2 km
I. Principles of Pointer Year Analysis
 I. Principles of Pointer Year Analysis Fig 1. Maximum (red) and minimum (blue) pointer years. 1 Fig 2. Principle of pointer year calculation. Fig 3. Skeleton plot graph created by Kinsys/Kigraph programme.
TM ETRS-TM35FIN-ETRS89 WTG
 SHADOW - Main Result Assumptions for shadow calculations Maximum distance for influence Calculate only when more than 20 % of sun is covered by the blade Please look in WTG table WindPRO version 2.8.579
On instrument costs in decentralized macroeconomic decision making (Helsingin Kauppakorkeakoulun julkaisuja ; D-31)
") On instrument costs in decentralized macroeconomic decision making (Helsingin Kauppakorkeakoulun julkaisuja ; D-31) Juha Kahkonen Click here if your download doesn"t start automatically On instrument costs
On instrument costs in decentralized macroeconomic decision making (Helsingin Kauppakorkeakoulun julkaisuja ; D-31) Juha Kahkonen Click here if your download doesn"t start automatically On instrument costs
TM ETRS-TM35FIN-ETRS89 WTG
 SHADOW - Main Result Assumptions for shadow calculations Maximum distance for influence Calculate only when more than 20 % of sun is covered by the blade Please look in WTG table WindPRO version 2.8.579
TM ETRS-TM35FIN-ETRS89 WTG
 SHADOW - Main Result Assumptions for shadow calculations Maximum distance for influence Calculate only when more than 20 % of sun is covered by the blade Please look in WTG table WindPRO version 2.9.269
Accommodation statistics
 Transport and Tourism 2011 Accommodation statistics 2011, January Nights spent by foreign tourists in Finland increased by per cent in January The number of recorded nights spent by foreign tourists at
Network to Get Work. Tehtäviä opiskelijoille Assignments for students. www.laurea.fi
 Network to Get Work Tehtäviä opiskelijoille Assignments for students www.laurea.fi Ohje henkilöstölle Instructions for Staff Seuraavassa on esitetty joukko tehtäviä, joista voit valita opiskelijaryhmällesi
1. SIT. The handler and dog stop with the dog sitting at heel. When the dog is sitting, the handler cues the dog to heel forward.
 START START SIT 1. SIT. The handler and dog stop with the dog sitting at heel. When the dog is sitting, the handler cues the dog to heel forward. This is a static exercise. SIT STAND 2. SIT STAND. The
TM ETRS-TM35FIN-ETRS89 WTG
 SHADOW - Main Result Assumptions for shadow calculations Maximum distance for influence Calculate only when more than 20 % of sun is covered by the blade Please look in WTG table WindPRO version 2.8.579
TM ETRS-TM35FIN-ETRS89 WTG
 SHADOW - Main Result Calculation: N117 x 9 x HH141 Assumptions for shadow calculations Maximum distance for influence Calculate only when more than 20 % of sun is covered by the blade Please look in WTG
16. Allocation Models
 16. Allocation Models Juha Saloheimo 17.1.27 S steemianalsin Optimointiopin seminaari - Sks 27 Content Introduction Overall Efficienc with common prices and costs Cost Efficienc S steemianalsin Revenue
TM ETRS-TM35FIN-ETRS89 WTG
 VE1 SHADOW - Main Result Calculation: 8 x Nordex N131 x HH145m Assumptions for shadow calculations Maximum distance for influence Calculate only when more than 20 % of sun is covered by the blade Please
WindPRO version joulu 2012 Printed/Page :42 / 1. SHADOW - Main Result
 SHADOW - Main Result Assumptions for shadow calculations Maximum distance for influence Calculate only when more than 20 % of sun is covered by the blade Please look in WTG table 13.6.2013 19:42 / 1 Minimum
Accommodation statistics
 Transport and Tourism 2015 Accommodation statistics 2015, September Nights spent by foreign tourists in Finland up by 5.0 per cent in September The number of recorded nights spent by foreign tourists at
( ,5 1 1,5 2 km
 Tuulivoimala Rakennukset Asuinrakennus Liikerak. tai Julkinen rak. Lomarakennus Teollinen rakennus Kirkollinen rakennus Varjostus "real case" h/a 1 h/a 8 h/a 20 h/a 4 5 3 1 2 6 7 8 9 10 0 0,5 1 1,5 2 km
Other approaches to restrict multipliers
 Other approaches to restrict multipliers Heikki Tikanmäki Optimointiopin seminaari 10.10.2007 Contents Short revision (6.2) Another Assurance Region Model (6.3) Cone-Ratio Method (6.4) An Application of
Accommodation statistics
 Transport and Tourism 2015 Accommodation statistics 2015, October Overnight stays at accommodation establishments increased by per cent in October The total number of overnight stays at Finnish accommodation
WindPRO version joulu 2012 Printed/Page :47 / 1. SHADOW - Main Result
 SHADOW - Main Result Assumptions for shadow calculations Maximum distance for influence Calculate only when more than 20 % of sun is covered by the blade Please look in WTG table WindPRO version 2.8.579
Information on preparing Presentation
 Information on preparing Presentation Seminar on big data management Lecturer: Spring 2017 20.1.2017 1 Agenda Hints and tips on giving a good presentation Watch two videos and discussion 22.1.2017 2 Goals
Use of spatial data in the new production environment and in a data warehouse
 Use of spatial data in the new production environment and in a data warehouse Nordic Forum for Geostatistics 2007 Session 3, GI infrastructure and use of spatial database Statistics Finland, Population
Alternative DEA Models
 Mat-2.4142 Alternative DEA Models 19.9.2007 Table of Contents Banker-Charnes-Cooper Model Additive Model Example Data Home assignment BCC Model (Banker-Charnes-Cooper) production frontiers spanned by convex
TM ETRS-TM35FIN-ETRS89 WTG
 SHADOW - Main Result Assumptions for shadow calculations Maximum distance for influence Calculate only when more than 20 % of sun is covered by the blade Please look in WTG table WindPRO version 2.8.579
TM ETRS-TM35FIN-ETRS89 WTG
 SHADOW - Main Result Assumptions for shadow calculations Maximum distance for influence Calculate only when more than 20 % of sun is covered by the blade Please look in WTG table WindPRO version 2.8.579
Accommodation statistics
 Transport and Tourism 201 Accommodation statistics 201, May Nights spent by foreign tourists in Finland up by 11 per cent in May 201 Overnight stays by foreign tourists continued increasing at Finnish
Accommodation statistics
 Transport and Tourism 2014 Accommodation statistics 2013, December Nights spent by foreign tourists in Finland up by 5.5 per cent in December 2013 The number of recorded nights spent by foreign tourists
LYTH-CONS CONSISTENCY TRANSMITTER
 LYTH-CONS CONSISTENCY TRANSMITTER LYTH-INSTRUMENT OY has generate new consistency transmitter with blade-system to meet high technical requirements in Pulp&Paper industries. Insurmountable advantages are
TM ETRS-TM35FIN-ETRS89 WTG
 SHADOW - Main Result Assumptions for shadow calculations Maximum distance for influence Calculate only when more than 20 % of sun is covered by the blade Please look in WTG table WindPRO version 2.8.579
,0 Yes ,0 120, ,8
 SHADOW - Main Result Calculation: Alue 2 ( x 9 x HH120) TuuliSaimaa kaavaluonnos Assumptions for shadow calculations Maximum distance for influence Calculate only when more than 20 % of sun is covered
Uusi Ajatus Löytyy Luonnosta 4 (käsikirja) (Finnish Edition)
 (Finnish Edition)") Uusi Ajatus Löytyy Luonnosta 4 (käsikirja) (Finnish Edition) Esko Jalkanen Click here if your download doesn"t start automatically Uusi Ajatus Löytyy Luonnosta 4 (käsikirja) (Finnish Edition) Esko Jalkanen
Uusi Ajatus Löytyy Luonnosta 4 (käsikirja) (Finnish Edition) Esko Jalkanen Click here if your download doesn"t start automatically Uusi Ajatus Löytyy Luonnosta 4 (käsikirja) (Finnish Edition) Esko Jalkanen
Bounds on non-surjective cellular automata
 Bounds on non-surjective cellular automata Jarkko Kari Pascal Vanier Thomas Zeume University of Turku LIF Marseille Universität Hannover 27 august 2009 J. Kari, P. Vanier, T. Zeume (UTU) Bounds on non-surjective
TM ETRS-TM35FIN-ETRS89 WTG
 SHADOW - Main Result Assumptions for shadow calculations Maximum distance for influence Calculate only when more than 20 % of sun is covered by the blade Please look in WTG table 22.12.2014 11:33 / 1 Minimum
Accommodation statistics
 Transport and Tourism 2013 Accommodation statistics 2013, July Nights spent by foreign tourists in Finland up by 1.9 per cent in July 2013 The number of recorded nights spent by foreign tourists at Finnish
TM ETRS-TM35FIN-ETRS89 WTG
 SHADOW - Main Result Assumptions for shadow calculations Maximum distance for influence Calculate only when more than 20 % of sun is covered by the blade Please look in WTG table 5.11.2013 16:44 / 1 Minimum
Tree map system in harvester
 Tree map system in harvester Fibic seminar 12.6.2013 Lahti Timo Melkas, Metsäteho Oy Mikko Miettinen, Argone Oy Kalle Einola, Ponsse Oyj Project goals EffFibre project 2011-2013 (WP3) To evaluate the accuracy
Accommodation statistics
 Transport and Tourism 2013 Accommodation statistics 2013, February Nights spent by foreign tourists in Finland down by 2.5 per cent in February 2013 The number of recorded nights spent by foreign tourists
On instrument costs in decentralized macroeconomic decision making (Helsingin Kauppakorkeakoulun julkaisuja ; D-31)
") On instrument costs in decentralized macroeconomic decision making (Helsingin Kauppakorkeakoulun julkaisuja ; D-31) Juha Kahkonen Click here if your download doesn"t start automatically On instrument costs
On instrument costs in decentralized macroeconomic decision making (Helsingin Kauppakorkeakoulun julkaisuja ; D-31) Juha Kahkonen Click here if your download doesn"t start automatically On instrument costs
Accommodation statistics
 Transport and Tourism 201 Accommodation statistics 201, July Nights spent by resident tourists increased by 3.7 per cent in July 201 Overnight stays by resident tourists increased by 3.7 per cent in July
Accommodation statistics
 Transport and Tourism 2014 Accommodation statistics 2014, October Nights spent by foreign tourists in Finland decreased by 1. per cent in October The number of recorded nights spent by foreign tourists
MUSEOT KULTTUURIPALVELUINA
 Elina Arola MUSEOT KULTTUURIPALVELUINA Tutkimuskohteena Mikkelin museot Opinnäytetyö Kulttuuripalvelujen koulutusohjelma Marraskuu 2005 KUVAILULEHTI Opinnäytetyön päivämäärä 25.11.2005 Tekijä(t) Elina
Rakennukset Varjostus "real case" h/a 0,5 1,5
 Tuulivoimala Rakennukset Asuinrakennus Liikerak. tai Julkinen rak. Lomarakennus Teollinen rakennus Kirkollinen rakennus Varjostus "real case" h/a 1 h/a 8 h/a 20 h/a 1 2 3 5 8 4 6 7 9 10 0 0,5 1 1,5 2 km
The Viking Battle - Part Version: Finnish
 The Viking Battle - Part 1 015 Version: Finnish Tehtävä 1 Olkoon kokonaisluku, ja olkoon A n joukko A n = { n k k Z, 0 k < n}. Selvitä suurin kokonaisluku M n, jota ei voi kirjoittaa yhden tai useamman
Accommodation statistics
 Transport and Tourism 2013 Accommodation statistics 2012, December Nights spent by foreign tourists in Finland up by 45 per cent in December 2012 The number of recorded nights spent by foreign tourists
Social and Regional Economic Impacts of Use of Bioenergy and Energy Wood Harvesting in Suomussalmi
 Social and Regional Economic Impacts of Use of Bioenergy and Energy Wood Harvesting in Suomussalmi Green Cities and Settlements 18.2.2014 Ville Manninen Writers Project group Sirpa Korhonen, Anna Mari
TM ETRS-TM35FIN-ETRS89 WTG
 SHADOW - Main Result Assumptions for shadow calculations Maximum distance for influence Calculate only when more than 20 % of sun is covered by the blade Please look in WTG table WindPRO version 2.8.579
Tutkimuslääkkeiden GMP. Fimea Pirjo Hänninen
 Tutkimuslääkkeiden GMP Fimea 17.1.2017 Pirjo Hänninen Kliinisiä lääketutkimuksia koskeva EU:n asetus Regulation (EU) No 536/2014 Hyväksytty 16.4.2014 (voimaan 28.5. 2016) Kumoaa nykyisen lääketutkimusdirektiivin
TIEKE Verkottaja Service Tools for electronic data interchange utilizers. Heikki Laaksamo
 TIEKE Verkottaja Service Tools for electronic data interchange utilizers Heikki Laaksamo TIEKE Finnish Information Society Development Centre (TIEKE Tietoyhteiskunnan kehittämiskeskus ry) TIEKE is a neutral,
Returns to Scale II. S ysteemianalyysin. Laboratorio. Esitelmä 8 Timo Salminen. Teknillinen korkeakoulu
 Returns to Scale II Contents Most Productive Scale Size Further Considerations Relaxation of the Convexity Condition Useful Reminder Theorem 5.5 A DMU found to be efficient with a CCR model will also be
( N117 x HH141 ( Honkajoki N117 x 9 x HH120 tv-alueet ( ( ( ( ( ( ( ( ( ( m. Honkajoki & Kankaanpää tuulivoimahankkeet
 Honkajoki & Kankaanpää tuulivoimahankkeet N117 x HH141 Honkajoki N117 x 9 x HH120 tv-alueet Alahonkajoki_kaava_alueen_raja_polyline Asuinrakennus Julkinen tai liiker rak. Lomarakennus Teollinen rak. Allas
 Digitally signed by Hans Vadbäck DN: cn=hans Vadbäck, o, ou=fcg Suunnittelu ja Tekniikka Oy, email=hans.vadback@fcg.fi, c=fi Date: 2016.12.20 15:45:35 +02'00' Jakob Kjellman Digitally signed by Jakob Kjellman
AYYE 9/ HOUSING POLICY
 AYYE 9/12 2.10.2012 HOUSING POLICY Mission for AYY Housing? What do we want to achieve by renting apartments? 1) How many apartments do we need? 2) What kind of apartments do we need? 3) To whom do we
Accommodation statistics
 Transport and Tourism 2015 Accommodation statistics 2015, July Nights spent by foreign tourists in Finland up by.5 per cent in July The number of recorded nights spent by foreign tourists at Finnish accommodation
On instrument costs in decentralized macroeconomic decision making (Helsingin Kauppakorkeakoulun julkaisuja ; D-31)
") On instrument costs in decentralized macroeconomic decision making (Helsingin Kauppakorkeakoulun julkaisuja ; D-31) Juha Kahkonen Click here if your download doesn"t start automatically On instrument costs
On instrument costs in decentralized macroeconomic decision making (Helsingin Kauppakorkeakoulun julkaisuja ; D-31) Juha Kahkonen Click here if your download doesn"t start automatically On instrument costs
toukokuu 2011: Lukion kokeiden kehittämistyöryhmien suunnittelukokous
 Tuula Sutela toukokuu 2011: Lukion kokeiden kehittämistyöryhmien suunnittelukokous äidinkieli ja kirjallisuus, modersmål och litteratur, kemia, maantiede, matematiikka, englanti käsikirjoitukset vuoden
7.4 Variability management
 7.4 Variability management time... space software product-line should support variability in space (different products) support variability in time (maintenance, evolution) 1 Product variation Product
Results on the new polydrug use questions in the Finnish TDI data
 Results on the new polydrug use questions in the Finnish TDI data Multi-drug use, polydrug use and problematic polydrug use Martta Forsell, Finnish Focal Point 28/09/2015 Martta Forsell 1 28/09/2015 Esityksen
Choose Finland-Helsinki Valitse Finland-Helsinki
 Write down the Temporary Application ID. If you do not manage to complete the form you can continue where you stopped with this ID no. Muista Temporary Application ID. Jos et onnistu täyttää lomake loppuun
FinFamily PostgreSQL installation ( ) FinFamily PostgreSQL
 FinFamily PostgreSQL") FinFamily PostgreSQL 1 Sisällys / Contents FinFamily PostgreSQL... 1 1. Asenna PostgreSQL tietokanta / Install PostgreSQL database... 3 1.1. PostgreSQL tietokannasta / About the PostgreSQL database...
FinFamily PostgreSQL 1 Sisällys / Contents FinFamily PostgreSQL... 1 1. Asenna PostgreSQL tietokanta / Install PostgreSQL database... 3 1.1. PostgreSQL tietokannasta / About the PostgreSQL database...
KMTK lentoestetyöpaja - Osa 2
 KMTK lentoestetyöpaja - Osa 2 Veijo Pätynen 18.10.2016 Pasila YHTEISTYÖSSÄ: Ilmailun paikkatiedon hallintamalli Ilmailun paikkatiedon hallintamalli (v0.9 4.3.2016) 4.4 Maanmittauslaitoksen rooli ja vastuut...
Use of Stochastic Compromise Programming to develop forest management alternatives for ecosystem services
 Use of Stochastic Compromise Programming to develop forest management alternatives for ecosystem services Kyle Eyvindson 24.3.2014 Forest Science Department / Kyle Eyvindson 3/26/2014 1 Overview Introduction
Copernicus, Sentinels, Finland. Erja Ämmälahti Tekes,
 Copernicus, Sentinels, Finland Erja Ämmälahti Tekes, 24.5.2016 Finnish Space industry in the European context European Space industry has been constantly growing and increasing its direct employment in
Characterization of clay using x-ray and neutron scattering at the University of Helsinki and ILL
 Characterization of clay using x-ray and neutron scattering at the University of Helsinki and ILL Ville Liljeström, Micha Matusewicz, Kari Pirkkalainen, Jussi-Petteri Suuronen and Ritva Serimaa 13.3.2012
C++11 seminaari, kevät Johannes Koskinen
 C++11 seminaari, kevät 2012 Johannes Koskinen Sisältö Mikä onkaan ongelma? Standardidraftin luku 29: Atomiset tyypit Muistimalli Rinnakkaisuus On multicore systems, when a thread writes a value to memory,
Särmäystyökalut kuvasto Press brake tools catalogue
 Finnish sheet metal machinery know-how since 1978 Särmäystyökalut kuvasto Press brake tools catalogue www.aliko.fi ALIKO bending chart Required capacity in kn (T) in relation to V-opening. V R A S = plates
Helsinki Metropolitan Area Council
 Helsinki Metropolitan Area Council Current events at YTV The future of YTV and HKL On the initiative of 4 city mayors the Helsinki region negotiation consortiums coordinating group have presented that:
Photo: Paavo Keränen. KAINUU in statistics 2009
 Photo: Paavo Keränen KAINUU in statistics 2009 KAINUU IN PROPORTION TO THE WHOLE OF FINLAND Forest area Total area Roads Primary production Summer cottages Unemployed Populat. over 64 years Number of farms
Accommodation statistics
 Transport and Tourism 2015 Accommodation statistics 2015, April Nights spent by foreign tourists in Finland decreased by 4.4 per cent in April The number of recorded nights spent by foreign tourists at
Curriculum. Gym card
 A new school year Curriculum Fast Track Final Grading Gym card TET A new school year Work Ethic Detention Own work Organisation and independence Wilma TMU Support Services Well-Being CURRICULUM FAST TRACK
Tarua vai totta: sähkön vähittäismarkkina ei toimi? 11.2.2015 Satu Viljainen Professori, sähkömarkkinat
 Tarua vai totta: sähkön vähittäismarkkina ei toimi? 11.2.2015 Satu Viljainen Professori, sähkömarkkinat Esityksen sisältö: 1. EU:n energiapolitiikka on se, joka ei toimi 2. Mihin perustuu väite, etteivät
Toimintamallit happamuuden ennakoimiseksi ja riskien hallitsemiseksi turvetuotantoalueilla (Sulfa II)
") Toimintamallit happamuuden ennakoimiseksi ja riskien hallitsemiseksi turvetuotantoalueilla (Sulfa II) Happamuuskuormituksen ennustaminen valuma-aluetasolla Marie Korppoo ja Markus Huttunen 13.5.2019 Päämäärä
Toimintamallit happamuuden ennakoimiseksi ja riskien hallitsemiseksi turvetuotantoalueilla (Sulfa II) Happamuuskuormituksen ennustaminen valuma-aluetasolla Marie Korppoo ja Markus Huttunen 13.5.2019 Päämäärä
Integration of Finnish web services in WebLicht Presentation in Freudenstadt 2010-10-16 by Jussi Piitulainen
 Integration of Finnish web services in WebLicht Presentation in Freudenstadt 2010-10-16 by Jussi Piitulainen Who we are FIN-CLARIN University of Helsinki The Language Bank of Finland CSC - The Center for
The Finnish healthcare service grid and access in rural Finland
 The Finnish healthcare service grid and access in rural Finland Kimmo Parhiala, M.Soc.Sc Development Manager, National Institute for Health and Welfare TW: @parhialakimmo 20.6.2017 The Finnish healthcare
Kysymys 5 Compared to the workload, the number of credits awarded was (1 credits equals 27 working hours): (4)
: (4)") Tilasto T1106120-s2012palaute Kyselyn T1106120+T1106120-s2012palaute yhteenveto: vastauksia (4) Kysymys 1 Degree programme: (4) TIK: TIK 1 25% ************** INF: INF 0 0% EST: EST 0 0% TLT: TLT 0 0% BIO:
Tilasto T1106120-s2012palaute Kyselyn T1106120+T1106120-s2012palaute yhteenveto: vastauksia (4) Kysymys 1 Degree programme: (4) TIK: TIK 1 25% ************** INF: INF 0 0% EST: EST 0 0% TLT: TLT 0 0% BIO:
Vaisala s New Global L ightning Lightning Dataset GLD360
 Vaisala s New Global Lightning Dataset GLD360 Vaisala Global Lightning Dataset GLD360 Page 2 / Oct09 / Holle-SW Hydro / Vaisala Schedule GLD360 Validation Applications Demonstration Page 3 / Oct09 / Holle-SW
LX 70. Ominaisuuksien mittaustulokset 1-kerroksinen 2-kerroksinen. Fyysiset ominaisuudet, nimellisarvot. Kalvon ominaisuudet
 LX 70 % Läpäisy 36 32 % Absorptio 30 40 % Heijastus 34 28 % Läpäisy 72 65 % Heijastus ulkopuoli 9 16 % Heijastus sisäpuoli 9 13 Emissiivisyys.77.77 Auringonsuojakerroin.54.58 Auringonsäteilyn lämmönsiirtokerroin.47.50
EUROOPAN PARLAMENTTI
 EUROOPAN PARLAMENTTI 2004 2009 Kansalaisvapauksien sekä oikeus- ja sisäasioiden valiokunta 2008/0101(CNS) 2.9.2008 TARKISTUKSET 9-12 Mietintöluonnos Luca Romagnoli (PE409.790v01-00) ehdotuksesta neuvoston
Salasanan vaihto uuteen / How to change password
 Salasanan vaihto uuteen / How to change password Sisällys Salasanakäytäntö / Password policy... 2 Salasanan vaihto verkkosivulla / Change password on website... 3 Salasanan vaihto matkapuhelimella / Change
The role of 3dr sector in rural -community based- tourism - potentials, challenges
 The role of 3dr sector in rural -community based- tourism - potentials, challenges Lappeenranta, 5th September 2014 Contents of the presentation 1. SEPRA what is it and why does it exist? 2. Experiences
Constructive Alignment in Specialisation Studies in Industrial Pharmacy in Finland
 Constructive Alignment in Specialisation Studies in Industrial Pharmacy in Finland Anne Mari Juppo, Nina Katajavuori University of Helsinki Faculty of Pharmacy 23.7.2012 1 Background Pedagogic research
Pricing policy: The Finnish experience
 Pricing policy: The Finnish experience Esa Österberg Senior Researcher Alcohol and Drug Research, STAKES, Helsinki, Finland esa.osterberg@stakes.fi Three pillars of traditional Nordic alcohol control Strict
Olet vastuussa osaamisestasi
 Olet vastuussa osaamisestasi Ohjelmistoammattilaisuuden uudet haasteet Timo Vehmaro 02-12-2015 1 Nokia 2015 Mitä osaamista tulevaisuudessa tarvitaan? Vahva perusosaaminen on kaiken perusta Implementaatio
MEETING PEOPLE COMMUNICATIVE QUESTIONS
 Tiistilän koulu English Grades 7-9 Heikki Raevaara MEETING PEOPLE COMMUNICATIVE QUESTIONS Meeting People Hello! Hi! Good morning! Good afternoon! How do you do? Nice to meet you. / Pleased to meet you.
Increase of opioid use in Finland when is there enough key indicator data to state a trend?
 Increase of opioid use in Finland when is there enough key indicator data to state a trend? Martta Forsell, Finnish Focal Point 28.9.2015 Esityksen nimi / Tekijä 1 Martta Forsell Master of Social Sciences
7. Product-line architectures
 7. Product-line architectures 7.1 Introduction 7.2 Product-line basics 7.3 Layered style for product-lines 7.4 Variability management 7.5 Benefits and problems with product-lines 1 Short history of software
RANTALA SARI: Sairaanhoitajan eettisten ohjeiden tunnettavuus ja niiden käyttö hoitotyön tukena sisätautien vuodeosastolla
 TURUN YLIOPISTO Hoitotieteen laitos RANTALA SARI: Sairaanhoitajan eettisten ohjeiden tunnettavuus ja niiden käyttö hoitotyön tukena sisätautien vuodeosastolla Pro gradu -tutkielma, 34 sivua, 10 liitesivua
Tietorakenteet ja algoritmit
 Tietorakenteet ja algoritmit Taulukon edut Taulukon haitat Taulukon haittojen välttäminen Dynaamisesti linkattu lista Linkatun listan solmun määrittelytavat Lineaarisen listan toteutus dynaamisesti linkattuna
Climforisk - Climate change induced drought effects on forest growth and vulnerability
 Climforisk - Climate change induced drought effects on forest growth and vulnerability Aleksi Lehtonen METLA ja HY www.metla.fi/life/climforisk 1 Kick-off kokous - aikataulu 9.00 Tilaisuuden avaus (Mikko)
Skene. Games Refueled. Muokkaa perustyyl. napsautt. @Games for Health, Kuopio. 2013 kari.korhonen@tekes.fi. www.tekes.fi/skene
 Skene Muokkaa perustyyl. Games Refueled napsautt. @Games for Health, Kuopio Muokkaa alaotsikon perustyyliä napsautt. 2013 kari.korhonen@tekes.fi www.tekes.fi/skene 10.9.201 3 Muokkaa Skene boosts perustyyl.
ECVETin soveltuvuus suomalaisiin tutkinnon perusteisiin. Case:Yrittäjyyskurssi matkailualan opiskelijoille englantilaisen opettajan toteuttamana
 ECVETin soveltuvuus suomalaisiin tutkinnon perusteisiin Case:Yrittäjyyskurssi matkailualan opiskelijoille englantilaisen opettajan toteuttamana Taustaa KAO mukana FINECVET-hankeessa, jossa pilotoimme ECVETiä
Transport climate policy choices in the Helsinki Metropolitan Area 2025
 Transport climate policy choices in the Helsinki Metropolitan Area 2025 views of transport officials and politicians Vilja Varho Introduction Experts have doubts about whether sufficiently effective policies