UNIVERSITY OF HELSINKI Faculty of Agriculture and Forestry Department of Forest Sciences
|
|
|
- Maarit Tamminen
- 6 vuotta sitten
- Katselukertoja:
Transkriptio
 Virpi Stenman Master s Thesis University of Helsinki Department of Forest Sciences Forest Ecology and Management")
1 UNIVERSITY OF HELSINKI Faculty of Agriculture and Forestry Department of Forest Sciences Upper Stem Diameter and Volume Prediction Strategies in National Forest Inventory (NFI) Virpi Stenman Master s Thesis University of Helsinki Department of Forest Sciences Forest Ecology and Management 2019
2 i Tiedekunta/Osasto Fakultet/Sektion Faculty Faculty of Agriculture and Forestry Tekijä/Författare Author Laitos/Institution Department Department of Forest Sciences Stenman, Virpi Työn nimi / Arbetets titel Title Upper Stem Diameter and Volume Prediction Strategies in National Forest Inventory (NFI) Oppiaine /Läroämne Subject Forest Ecology and Management / Forest Resource Science Työn laji/arbetets art Level Aika/Datum Month and year Sivumäärä/ Sidoantal Number of pages Master s Thesis Tiivistelmä/Referat Abstract March In forest inventories, the field data is needed as a reference data, calibration and for assessing the accuracy. Gathering the field data needs resources, such as work forces, equipment and data management operations. This means that time and budget as well as quality must be carefully considered when National Forest Inventory activities are to be planned. Therefore, the development of cost efficient, simpler, safer and more accurate and reliable field data measurement methods and tools are topics of great interest. One of the field measurement variables is the upper stem diameter, which has been part of the NFI field data set until the 11 th NFI. The measured upper stem diameter helps to produce more reliable tree stem volumes with 3-parameter Laasasenaho volume model. However, only if the quality of the measurements is on an adequate level. The upper stem diameter has been traditionally measured with parabolic caliper assembled in the top of the 5-meter aluminium rod. This equipment combination takes time to assemble and disassemble, it is not very compact to be carried around as well as it can be a health and safety issue during the thunderstorm. Therefore Criterion, laser-based dendrometer performance was further examined in this study as an optional measurement equipment for future upper stem diameter field measurements. The Criterion upper stem as well as dbh measurement precision was analysed based on the 326 sample tree measurements with Sonar, Caliper and Criterion. The standard error for Criterion was 17,26 mm in dbh measurements for all species and 10,36 mm in d6 measurements for all species. The reference standard errors from earlier studies were 2,70 mm for dbh with Steel Caliper and 7,00 mm for d6 with Caliper. When analysing the Criterion performance with reference to mean of the measurements, the standard error in dbh measuements for all species was 9,72 mm and for d6 measurements 7,07 mm. Furthermore, the accuracy and precision were analysed with Bland-Altman technique, which is a suitable method for comparing two measurements of the same variable when both have some errors. The Bland-Altman results supported the earlier findings. Within and between observer analysis showed that the impact in measurement accuracy or precision is not caused by the observers. The comparison of the sample tree volumes produced the results that the relative standard error was increased by 2,13 % for all species when 2-parameter volume model was compared with 3-parameter model. Likewise, the relative bias was increased by 1,53 %. In efficiency experiment the scenario where only one sample tree with measured d6 was chosen from each of the sample plot and dbh percentile of p70 was providing most accurate and precise sample plot volumes with RMSE of 3,92 m 3 /ha and bias m 3 /ha. The results show that there is a real challenge to achieve reliable and accurate upper stem diameter measurements and therefore new measurement methods need to be further studied and analysed. Avainsanat Nyckelord Keywords Measurement errors, forest inventory, accuracy Säilytyspaikka Förvaringställe Where deposited Helda / E-thesis (opinnäytteet) Työn ohjaaja(t) Arbetets handlerare Supervisor ethesis.helsinki.fi Annika Kangas, Markus Holopainen
3 ii Tiedekunta/Osasto Fakultet/Sektion Faculty Maatalous-Metsätieteellinen tiedekunta Tekijä/Författare Author Laitos/Institution Department Metsätieteiden laitos Stenman, Virpi Työn nimi / Arbetets titel Title Yläläpimitan ja puustotilavuuden ennustamisen strategiat valtakunnan metsien inventoinnissa (VMI). Oppiaine /Läroämne Subject Metsävarojen hallinta Työn laji/arbetets art Level Maisterintutkielma Tiivistelmä/Referat Abstract Aika/Datum Month and year Maaliskuu 2019 Sivumäärä/ Sidoantal Number of pages Luotettavia maastomittauksia tarvitaan luotettavan metsäninventoinnin tueksi. Vaikka esimerkiksi monilähdeinventoinnissa kaukokartoitusaineistoja hyödynnetään laajasti, tarvitsee menetelmä tuekseen maastoaineistoa. Sitä käytetään referenssiaineistona, tulosten kalibroinnissa tai tarkkuuden arvioinnissa. Maastoaineiston kerääminen vaatii resursseja, kuten työvoimaa, työvälineitä sekä tiedonhallintaan liittyviä operaatioita. Sen vuoksi niin ajankäyttö, budjetointi kuin laatuvaatimuksetkin on huomioitava valtakunnan metsien inventointiin liittyvien aktiviteettien suunnittelussa. Kiinnostavia aihepiirejä ovatkin kustannustehokkaiden, yksinkertaisempien, turvallisempien sekä tarkempien ja luotettavampien maastomittaus menetelmien kehittäminen. Eräs maastossa mitatuista tunnuksista on yläläpimitta, joka mitattiin koepuista aina 11. Valtakunnan metsien inventointiin saakka. Mitatun yläläpimitan avulla voidaan tuottaa luotettavampia puustotilavuuksia käyttämällä Laasasenahon 3-parametrista tilavuusmallia, olettaen että mittausten laatu on riittävällä tasolla. Perinteisesti yläläpimitta on mitattu latvakaulaimella, jossa on 5 metriä pitkä alumiininen varsi. Latvakaulaimen kasaamiseen ja purkuun kuluu aikaa ja sitä on hankala kuljettaa maastossa. Lisäksi latvakaulaimen käyttöä ei suositella ukkosella, sillä siihen liittyy riskejä. Tästä johtuen Criterion laser-mittalaitetta tutkittiin vaihtoehtoisena menetelmänä mahdollisiin yläläpimitan maastomittauksiin. Criterioinilla mitattuja rinnankorkeus- ja yläläpimitan tarkkuuksia analysoitiin 326 mitatun koepuun avulla. Mittauksiin käytettiin Sonar-, Caliper-, ja Criterion mittalaitteita. Criterionilla mitatuissa kaikkien puulajien rinnankorkeusläpimitoissa keskivirhe oli 17,26 mm ja yläläpimitoissa 10,36 mm. Tulosten vertailukohtana olivat aiemmista tutkimuksista mittasaksien keskivirhe 2,70 mm ja latvakaulaimen keskivirhe 7,00 mm. Criterionin toimintakykyä vertailtiin myös toistomittausten keskiarvoon, jolloin keskivirhe rinnankorkeusläpimitan mittauksessa kaikilla puulajeilla oli 9,72 mm ja yläläpimitan mittauksissa 7,07 mm. Lisäksi Criterionin tarkkuutta ja täsmällisyyttä analysoitiin Bland-Altman menetelmällä, joka sopii eri mittaustapojen vertailuun silloin, kun molemmat mittaustavat sisältävät virheitä. Bland-Altman menetelmän tulokset tukivat aiempia löydöksiä. Mittaajien välistä ja sisäistä eroa tutkitiin varianssianalyysillä, joka osoitti, ettei mittaajalla ole vaikutusta mittausten tarkkuuteen tai täsmällisyyteen. Koepuiden tilavuuksien tarkastelun tulokset osoittivat, että suhteellinen keskivirhe kasvoi 2,13 % kaikille puulajeille, kun 2-parametrisella tilavuusmallilla tuotettuja tilavuuksia verrattiin 3-parametrisella mallilla tuotettuihin tilavuuksiin. Lisäksi, suhteellinen harha kasvoi 1,53 %. Tehokkuuteen liittyvässä kokeessa päästiin luotettavimpiin tuloksiin, kun vain yhdenkoepuun mittauksia hyödynnettiin koealatilavuuslaskelmissa. Koepuu oli valittu rinnankorkeuläpimittojen persentiililtä p70 ja tulosten RMSE oli 3,92 m 3 /ha ja harha m 3 /ha. Tulokset osoittavat yläläpimitan luotettavan ja tarkan mittaamisen haasteellisuuden ja siksi uusia mittausmenetelmiä tulisi edelleen tutkia ja analysioida lisää. Avainsanat Nyckelord Keywords Mittausvirheet, metsän inventointi, tarkkuus Säilytyspaikka Förvaringställe Where deposited Helda / E-thesis (opinnäytteet) Työn ohjaaja(t) Arbetets handlerare Supervisor ethesis.helsinki.fi Annika Kangas, Markus Holopainen
4 i Acknowledgements This study was prepared as a part of the Finnish Government and Ministry of Agriculture and Forestry key project Wood on the move and new products from forests. I wish to thank the Department of Forest Sciences in Helsinki University as well as Natural Resources Institute Finland for the financial support of this study. I want to thank professor Annika Kangas for her patient guidance and support she offered during this project. Additionally, I want to thank the Natural Resources Institute Finland for the opportunity to join the field data gathering forces to collect the data for this study. I would also like to thank professor Markus Holopainen for providing me the topic for this study and Mikko Vastaranta for providing me the early support in the data analysis work. Finally, I wish to thank my work colleagues, friends and family for all their support while writing this thesis and the many years of study before that. Special and warm thanks to my husband Jim for his full support in this project.
5 ii Acronyms and Abbreviations CPL CSV d6 dbh GMFR GNSS h LED NFI OLS RMSE TLS Cost-plus-loss method Comma-separated values Upper stem diameter at the height of 6 meters from ground Diameter at breast height (1.3 meters from ground level) Geometric mean functional relationship regression Global navigation satellite system Height of the tree from ground level to the top of the tree Light-emitting diode National forest inventory Ordinary least squares Root mean square error Terrestrial laser scanning
6 iii Table of Contents 1 Introduction and Background The National Forest Inventory (NFI) NFI Field Measurements in Finland Upper Stem Diameter (d6) Purpose of the Study Previous Research Structure of the Study Theoretical Framework of the Study Methods and Statistical Analysis Selection of the Statistical Analysis Method Measurement Theory Regression Analysis and Modelling Bland-Altman Technique Volume Prediction in Finnish NFI Research Materials and Methods Field Data Lapinjärvi Sample Plots Tree measurements Criterion RD 1000 Electronic Dendrometer Data Analysis methods Precision and Accuracy of the Different Measurement Equipment Precision and Accuracy of Volume Estimates Comparison of the Predicted and Observed Upper Stem diameter Evaluation of the Measurement Strategy Impact in Efficiency... 33
7 iv 4 Results of the Study Overview of the Data Measurement Equipment and Observer Precision Measurement Equipment Accuracy Precision and Accuracy of the Sample Tree Volume Estimates Measurement Strategy Impact in Efficiency Discussion Measurements and Equipment Sample Tree Volumes Efficiency and Sample Plot Volumes Conclusions References Appendix 1 Map of Sample Plots Appendix 2 Histograms for dbh and d6 Observations by Species Appendix 3 Q-Q Plots for Data Normality Assessment Appendix 4 Main characteristics of the data... 63
8 v List of Tables Table 1. The estimates of Laasasenaho model (1) parameters Table 2.The estimates of Laasasenaho model (2) parameters Table 3. Sample tree measurement statistics and number of sample trees (n) for observed dbh and d Table 4. Standard error for Criterion with reference to earlier research with Steel Caliper for dbh and Caliper for d6. Number of observations is n, standard error s and measurement unit is mm Table 5. Standard error and bias for Criterion with reference to mean of the measurements. Number of observations is n, standard error s and measurement unit is mm Table 6. The standard error (s) for Criterion dbh and d6 by observers Table 7. Criterion standard errors (s) within and between observers Table 8. Standard error and bias for sample tree volumes produced by Criterion. Number of observations is n, standard error smodel and the unit is dm Table 9. The accuracy and precision of sample plot volumes in m 3 /ha
9 vi List of Figures Figure 1. Parabolic caliper for measuring d Figure 2. Lapinjärvi research forest in Finland Figure 3. Sonar caliper measurement equipment Figure 4. Criterion RD 1000 electronic dendrometer Figure 5. Criterion RD 1000 diameter measurement bars Figure 6. Measurement data covering all species in histograms, where n is number of observations Figure 7. Between and within observer boxplots for dbh and d Figure 8. The plot of dbh field measurements against the reference data. The identity line is presented with a solid line, OLS with dashed line and GMFR with dotted line Figure 9. The plot of d6 field measurements against the reference data. The identity line is presented with a solid line, OLS with dashed line and GMFR with dotted line Figure 10. The Bland-Altman plots for dbh, where the difference between measurement equipment is compared to reference data. The mean difference line and mean difference +/- 2SD lines are presented with dashed lines and the trend line with solid line Figure 11. The Bland-Altman plots for d6, where the difference between measurement equipment is compared to reference data. The mean difference line and mean difference +/- 2SD lines are presented with dashed lines and the trend line with solid line Figure 12. The plot of volumes with dbh, where identity line is presented with a solid line, OLS with dashed line and GMFR with dotted line Figure 13. The plot of volumes with d6 against the reference volumes. The identity line is presented with a solid line, OLS with dashed line and GMFR with dotted line Figure 14. The Bland-Altman plots for sample tree volumes including dbh measurement errors Figure 15. The Bland-Altman plots for sample tree volumes including d6 measurement errors Figure 16. Regression models for d Figure 17. Sample plot volumes for different scenarios in m3/ha
10 1 Introduction and Background 1.1 The National Forest Inventory (NFI) The national forest inventory is a monitoring system for the development of forests in Finland. As Tomppo et al. (2011) pointed out, main purpose of the national forest inventory is to provide comprehensive and reliable information regarding the forest resources. This information can be used for predicting the future development of the forests as well as a research material. Several international instances are using the forest resource information as an input in their decision-making processes and this information provides also the data for several global reporting requirements (Chirici et al. 2011). Thus there are increasing requirements for more accurate and reliable information of the forest resources on a global and local level. On a global level, one of the reasons why more and more countries are implementing the NFI around the world is the monitoring requirement related to the prevention of the climate change (Chirici et al. 2011). On local level and for example in Finland the Strategic Programme of Prime Minister Juha Sipilä s Government on 29 th of May 2015 includes a target for more efficient utilization of the forest resources data and related electronic services (Government Publications 1/2016). These are only few reasons why the national forest inventory methods are under continuous development and why the ongoing research activities are focusing on finding new solutions for collecting, managing, refining and distributing the forest resource data. In Finland the first national forest inventory was carried out in the early 1920 s. Until today the inventories have been repeated in 5-10 year s cycles and currently the ongoing 12 th national forest inventory was kicked off in Finland during the summer 2014 (Haapanen 2014). The data for the most recently published forest resource information in Finland, NFI 11, was gathered during years (Valtakunnan metsien 11. inventointi (VMI) 2009). The major driving forces for the national level forest monitoring have been the increased interest in forests as well as the demand for timber (Tomppo et al. 2008). Re- 7
11 ferring to Haapanen (2014) until the 1970 s the objective of the national forest inventories was to serve the forest industry by providing the best estimates of the growing stock and its development. In later inventories the interest has also increased in non-wood forest products like the environmental, economic and social roles of forests. However, defining the sustainable level of harvests without jeopardizing the future timber production is one of the key objectives that has remained over the series of national forest inventories until today (Haapanen 2014). This means that the main interest has always been the amount, structure and quality of growing stock as well as the growth, state and need of silviculture activities. Due to the use of the forest resource information especially in the decision-making activities, the inventory methods should be reliable and efficient (Tomppo et al. 2011). A common challenge related to the inventory measurements is how to achieve a high degree of accuracy and unbiasedness cost-efficiently. For practical reasons it is not possible to measure every tree in the forest or all the tree variables in large area inventories like in NFI. This means that sampling methods need to be applied and the field measurements can include only a few key variables. Therefore, the Finnish national forest inventory is a sampling-based inventory (Tomppo et al. 2014) NFI Field Measurements in Finland The forest resource information produced by the NFI is still based on the comprehensive field measurements, which are gathered from the country wide network of clustered sample plots. The clustered sample plot setup varies, and the sampling intensity is fitted to the spatial variation in forests and the road network availability throughout the whole country, being lower in the north than in the south (Tomppo et al. 2014). Finland is divided geographically into six sampling intensity regions consisting of Åland region, Southern Finland, Central Finland, North Central Finland, South Lapland and North Lapland (Valtakunnan metsien 11. inventointi (VMI) 2009). According to Tomppo et al. (2008) the growing stock volume estimates are calculated based on the tree measurements on the field sample plot. The sample plot tree measurements are further separated for the tally tree measurements and for the sub-plot measurements of the sample trees. According to the 12 th NFI manual, the sample trees 8
12 are selected based on the cumulatively summarized basal area or based on the tree diameter. The sample trees, which are over 45 millimetres of diameter breast height (dbh) are selected based on the cumulative basal area. In Southern Finland the basal area-based sampling interval for the sample tree over 45 millimetres of dbh is 15 m 2 /ha and in Northern Finland it is 10 m 2 /ha. However, when the tally tree dbh is less than 45 millimetres, every 10 th tree is a sample tree in Southern Finland and in North Finland every 7 th tree is a sample tree. In addition to the tally tree variables, such as tree species and breast height diameter, the sub-plot sample tree measurements are including also the height measurements and the crown indicators. In 12 th NFI the sample tree measurements are gathered for different types of sample trees. Depending on the use of the data, the measurements can be classified as normal NFI sample trees and sample trees for the laser-based methods. The laser-based methods will require measurements for the tree species specific mean heights from each of the sample plot (Valtakunnan metsien 12. inventointi (VMI12) 2015). This information is needed for the sample plot specific height model calibration. Volume estimates of growing stock and increments are based on detailed measurements of sample trees, taper curve models and generalization of sample tree results to tallied trees (Metla Research Programmes 2015). Based on the field measurements the estimates for instance for the volume of the growing stock can be made for the entire country. NFI methods are under continuous development and changes are implemented for instance due to new demands or due to technology development. For the 12 th NFI the sample tree measurements were simplified by leaving out the upper stem diameter (d6), which was earlier measured for the sample trees at the height of six meters (Valtakunnan metsien 11. inventointi (VMI11) 2009). More detailed description regarding the volume estimation in Finnish NFI is introduced later in this study Upper Stem Diameter (d6) The volume or taper curve models presented by Laasasenaho (1982) are usually used for estimating the volume of timber in Finnish forest inventory systems. These models estimate the volume or taper curve as a function of dbh or dbh and height (h) or as a function of dbh, d6 and h. The model-based volume estimates are more reliable when also the d6 is used as an explanatory variable in addition to dbh and h, while the volume 9
13 estimates that are obtained by using only d and h can be biased (Korhonen 1992). According to Korhonen the d6 measurements are not obtained for trees less than 8- meter of height, because in this case the d6 is not improving the reliability of the volume estimate. During the earlier National forest inventory rotations and for instance based on eleventh national forest inventory manual, the upper stem diameter has been measured as a part of the field measurements. The d6 was measured for the standing sample trees and over bark at the height of 6 meters over ground. The measurement was taken in 1 cm classes for the trees over 81 decimetres of height and by using a parabolic caliper (Figure 1.) with a 5-meter aluminium rod. Before reading the measurement result, the aluminium rod was placed along the tree stem by matching the dbh indicator on the rod with the measured tree dbh height sign on the tree stem. The dbh indicator on the rod was placed 30 cm from the bottom of the rod so that the dbh height and the remaining rod length sums up to 6 meters from the ground level. The caliper measurement was read from the right side of the tree stem based on the caliper scale and diameter class. The caliper scale is between 2-38 cm and thus this the trees over the scale were visually assessed. Figure 1. Parabolic caliper for measuring d6. Measuring the d6 is time consuming, expensive and prone to measurement errors (Korhonen 1992). Based on the VMI11 manual and instructions following points need to be taken into consideration (Valtakunnan metsien 11. inventointi (VMI11) 2009). The tree characteristics like the shape of the stem, the density of branches as well as the tree species are influencing the d6 measurement accuracy. The measurement errors 10
14 can be divided in recording errors and equipment placement errors. The recording errors could be caused by the poor visibility, wrong reading or typing of the measurement. The placement errors could be caused by the wrong measurement height or wrong angle of the measuring equipment. Depending on the geographical location and the region, the travelled distance for oneday field measurements can be over 10 kilometres. Especially challenging are the offroad transfers when all the measurement equipment needs to be carried by the observers. For the transfers, the upper stem caliper rod is split in to four parts, which are fitted and carried in a tube. In addition to the rod, the caliper need to be carried. Before and after the measurements the equipment need to be assembled and disassembled, which is time consuming. 1.2 Purpose of the Study The purpose of this study is to examine the accuracy, precision and efficiency of the upper stem diameter field measurements by comparing the different measurement equipment observations as well as different strategies on the prediction of the tree volumes. The upper stem diameters are measured with two different equipment and methods, which are based on a laser dendrometer and on the d6 caliper with a rod. The predictions of the tree volumes are statistically analysed so that the accuracy and precision between the different measurement methods can be compared. Also, the purpose is to compare the results with the earlier studies by considering the accuracy of the tree measurements as well as the modelled volume estimates with or without the d6 measurement. Finally, the efficiency of the upper stem diameter measurements comparison is done based on sample tree selection strategies. The specific objectives of this study are as follows: Find out and analyse the measurement error of the upper stem diameter measurement. Compare the precision, accuracy and efficiency of the different d6 measurement equipment and find out which one is most accurate and most efficient. Compare and analyse the reliability of the volume estimates with or without the d6 considering the measurement errors as well as model errors. 11
15 Examine how many sample trees must be measured with the upper stem diameter for providing the most reliable results for the sample plot volume Find out if there is statistically significant difference between the predicted tree volumes with or without measured upper stem diameter. The purpose of his research is to generate new knowledge on the strategies of the upper stem diameter measurements. The hypothesis of this study is: there is a cost-efficient way to improve the volume estimation accuracy in National Forest Inventory (NFI). 1.3 Previous Research There are a few previous studies conducted in Finland regarding the upper stem diameter measurements. For instance, Hyppönen & Roiko-Jokela (1978) examined the accuracy and effectivity of the sample tree measurements. In this research the upper stem diameter was measured for 114 times by three different observers with the parabolic caliper and as in NFI. The precision and bias of the used instruments and the instrument-based time consumption was examined for Scots pine. They found out that the optimum instrument for measuring the upper diameter was the parabolic caliper with the aluminium rod. Regarding the time management the biggest impact in efficiency was caused by the height measurements and not by d6 measurements. The study by regarding the accuracy of certain tree measurements including the random errors and bias showed that the impact of the observer experience and carefulness is more important than the order of the measurements (Päivinen et al. 1992). In this study the upper diameter d6 was measured according to the NFI guidance with the parabolic caliper for 366 times for Scots pine and for 154 times for Norway spruce. They found out that the d6 measurement bias for both tree species was -0,1 cm and the standard deviation was 0,7 cm. Pennanen (1978) estimated that the sample tree measurements will take approximately % of the total measurement time. Päivinen (1987) introduced the findings of the 7 th NFI time management, where the field measurements were considered as one of the largest cost elements and the time consumed in sample tree measurements was between 9,5 14,4 % of the total working time. Therefore, when designing the optimal 12
16 model for the forest inventory measurements, there is always a need to balance between the number and size of the sample trees as well as the measurement time and the measurement error or error caused by the lack of measurements. The measurement and model errors impact in tree volume predictions and therefore analysing the d6 measurement error alone does not provide the best solution. Kangas (1996) found out that using predicted height or upper diameter instead of measured one produces statistically significant bias in volume estimates. This study consisted of the data from 8516 Scots pine trees, which were measured as sample trees in the 8 th Finnish NFI. The volume for each tree was predicted with the Laasasenaho (1982) model with observed or estimated d6 in addition to other observed or estimated sample tree characteristics. Finally, the true volume was compared to the volume subject to measurement and prediction errors in different height and upper diameter models. The research findings suggest that the best approach for the unbiased estimate of mean volume is to predict the tree volumes with observed dbh and stand characteristics as the regressor. The bias in the volume predictions with predicted height or upper diameter was found to be statistically significant and this bias may have a significant effect on the inventory results especially when total volumes for large areas are calculated as in national inventories. The NFI sampling designs and plot specific tree measurements have been modified over the time to respond the need of the data accuracy as well as the use of available resources (Tomppo et al 2008). There is always a trade-off between efficiency and accuracy, which impacts in how many and what size of the sample trees are selected. Henttonen and Kangas (2015) studied the optimal plot design in multipurpose forest inventory by cost-plus-loss (CPL) approach. The cost-plus-loss for the optimal plot design was defined by minimizing the costs as a function of time and the losses as a function of RMSE for the variables of interest including also subsample tree variables such as upper stem diameter d6. They found out that the subsample tree selection strategy was more important in selecting optimal plot than many other factors. When other characteristics than volume, for instance such as volume growth is analysed, the subsample tree selection and measurement strategies need further studies. 13
17 1.4 Structure of the Study The study is structured in four different sections and after the first section consisting of introduction and background the following content is introduced. The focus in the second section of this study is on the theoretical framework. This section introduces detailed information about the theories that are used as a foundation to facilitate the research work. It is based on the literature review of scientific articles as well as previous studies and publications. On the other hand, the framework aims to connect the relationship between theories and the statistical analysis of the study. Following the theoretical framework, the third section is focused on methods and materials. This chapter contains the description of the research data as well as the methods regarding the data gathering, classification and analysis work. The applied data analysis methods are critically reviewed with the benefits and disadvantages from the viewpoint of this study and the motivation of the study material selection is introduced. Finally, the last section consists of the results, discussion and conclusion chapters. The answers obtained for all the research questions will be presented in the last section of this study and the main findings will be summarized and discussed as a deeper insight of the research. At this phase of the study, the discussion and interpretation of the results will facilitate the conclusions that will answer the research questions that refer to the research problem for finding out the optimal strategy for measuring the upper stem diameter in NFI. 14
18 2 Theoretical Framework of the Study 2.1 Methods and Statistical Analysis This section is focusing on the selection procedure as well as on the theory of the statistical analysis methods utilized in this study. With reference to previous and similar studies in forestry, the field measurements are assumed to be the absolute truth and the errors in them are assumed insignificant or not important. This could mean that the decisions regarding the acquisition of the information are often depending on the seemingly real precision or accuracy of the data. For instance, in tree-level comparisons, the field measurements contain always measurement errors. Therefore, in this study the selection of the analysis method was heavily impacted by the lack of the error-free reference data for the d6 observations Selection of the Statistical Analysis Method Since the true values for the d6 measurements are unknown, one option for the data analysis is the traditional regression analysis to find out if there is a significant difference between the sample tree volumes produced by the d6 variables of different measurement methods. In this method the sample tree volumes for the regression analysis are produced by the Laasasenaho models and the dependant and explanatory variables are chosen based on the sample tree volumes produced with d6 variable and based on the measurement type i.e. the traditional caliper or laser dendrometer. Furthermore, the paired Student s t-test is utilized for finding out if there is an evidence of a difference between the means of measurements produced by different methods. However, comparing only the means of measurements produced by two methods with a traditional Student s t-test is not straightforward. The comparison results are heavily depending on the amount of the observations and the results are less accurate with fewer observations. Therefore, it is difficult to find the evidence of the significance between for instance two measurement methods with t-test. Likewise, with the bigger amount of observations it is more likely that the t-test produces a result, which is illustrating rather the evidence of difference between the measurement methods than the reason for the difference between the measurement methods. 15
19 Therefore, slightly different approach was chosen for the analysis method of this study and combination of the measurement theory and Bland-Altman (1983) techniques were applied Measurement Theory As Päivinen (1987) presents there are certain reasons for the deviations between the reality i.e. the truth and the measured values in the forest inventory. The tree measurements are always involving sources of errors. These types of errors are also called as measurement errors and their magnitude is mainly depending on the measurer, measuring equipment as well as on the target of the measurement. The measurement error can be further divided into two components, which are random error and systematic error. Random error can be randomly either positive or negative and it may vary from observation to another. Random errors are also always present when something is measured, and they are typically more likely to be small errors. They can be caused for example by the unintended mistakes by observers. The random error variance indicates the precision of the observations or measurements. Systematic error indicates that the measurement error is systematically either positive or negative. Even with large amount of measurements the mean of the systematic error does not reach zero. The systematic error can be caused for instance by the wrongly calibrated measurement equipment. The systematic error is also called as bias and it can be calculated as follows: BIAS = n i=1 (y i ŷ i ) n (1) Mean squared error (MSE) is an indicator for the accuracy as it consists of both, the random error as well as bias. MSE for the measurement errors can be calculated as follows: MSE = VAR (y) + BIAS 2 (2) where the variance is calculated as follows: VAR(y) = 1 n n 1 i=1 (y i y i) 2 (3) 16
20 Where n is the number of observed measurements, yi is the observed measurement, ŷi is the true value and ȳi is the mean of the observed measurements. Root mean square error (RMSE) is one of the most important indicators for the data quality in forest mensuration science. For the tree measurements, RMSE can be calculated as follows: RMSE = MSE (4) Regression Analysis and Modelling Regression is a statistical method, which has got many practical use cases. Most commonly linear regression analysis is used for prediction or forecasting, and it includes several techniques for modelling and analysing several variables. Regression analysis helps to understand the relationship between a dependent variable and one or more independent, also called as explanatory variables. It also helps to understand how the typical value of the dependent variable changes when any one of the explanatory variables is varied. When a predictive regression model is developed, it can be used to make a prediction for the dependent variables based on the modelled relationship between the variables even if the explanatory variable is unknown. The regression model is also represented as a function where the explanatory variable is placed on X -axis and dependent variable or predicted variable on Y-axis. The regression analysis can be applied also to quantify the strength of the relationship between the dependent and the explanatory variables. Once a regression model has been constructed, it is important to verify the goodness of fit of the model and the statistical significance of the estimated parameters. Commonly used checks of goodness of fit include the R 2 i.e. coefficient of determination, analyses of the pattern of residuals and hypothesis testing. R 2 is a statistical indicator, which indicates the coefficient of determination and it can get values between 0 and 1. Bigger R 2 value indicates stronger coefficient of determination. This means that the better the linear regression model fits to the data in comparison the closer the R 2 value gets to 1. The coefficient of determination is the percent of the variation that can be explained by the regression model. R 2 is produced by dividing the explained variation by the total variation as follows. 17
21 R 2 = SSR SSR+SSE (5) The total variation is a sum of two parts, the part that can be explained by the regression model and the part that can't be explained by the regression model. The variation explained by the regression model can be calculated by utilizing the following equation. SSR = n i=1 (ŷ i y ) 2 (6) The unexplained variation can be calculated by utilizing the equation as follows. SSE = n i=1 (y i ŷ) 2 (7) Where ŷi indicates the predicted value, yi the observed or true value for one unit of the population and y indicates the average of the observed or true values. SSR is the sum of the squared differences between the prediction for each observation and the population mean and SSE is the sum of squared errors of prediction. A small SSE indicates a tight fit of the model to the data. Another way to analyse the model goodness of fit is to calculate the Root Mean Square Error (RMSE). RMSE is a measure of how spread out the residuals are, and it indicates how concentrated the data is around the line of best fit. Each data point has got its own residual. A residual is generated by subtracting for instance the observed value from the true value and it indicates how far from the regression function line the actual true data points are. Analysing the pattern of residuals can be used also for assessing the regression model suitability for the data. This can be done via examining the residual plots. A residual plot is a graph that shows the residuals on the vertical axis and the independent variable on the horizontal axis. If the points in a residual plot are randomly distributed around the horizontal axis, a linear regression model is appropriate for the data. Otherwise, a non-linear model is more suitable. 18
22 The goodness of model can be also analysed by the predicted values produced by the model. For instance, if the model is used for predicting the volume of a tree, the model should not produce negative values. In case the regression analysis is used for modelling purposes, it is important to notice that the amount of the explanatory variables may have an impact in the coefficient of the determination of the model. In fact, the model coefficient of the determination increases if new explanatory variables are added in the model. The more explanatory variables, the more flexible model will be. Therefore, it is recommended to use another indicator for analysing the coefficient of the determination of the model, when the most optimal amount or combination of the explanatory variables are selected for the model. This indicator is Adjusted R 2 and it is useful for comparing the models with different amount or combination of the explanatory variables. Adjusted R 2 is calculated by the following equation. Adjusted R 2 = SSR (p 1) SST (n 1) (8) Where p indicates the amount of the explanatory variables, n indicates the degrees of freedom and SST = SSR + SSE. The linear regression is a good analysis method when the variables are error free and the explanatory variable is identified. However, when the variables are not error free and the explanatory variable cannot be identified, the geometric mean functional relationship regression can be utilized. In the linear regression method, the relationship of the explanatory and dependent variable cannot be switched, however this not an objection for GMFR, which produces a symmetric regression line as follows: ŷ 2 = b 0 + b 1 y 1 (9) where the b0 is calculated as b 0 = y 2 b 1 y 1 (10) and b1 is estimated as 19
23 b 1 = ± [ n i=1 (y i2 y 2 ) 2 n i=1(y i1 y 1 ) 2 ] 1 2 (11) The GMFR line together with identity line also called as 45-degree line as well as with OLS regression line could provide better overview for the visual analysis. This approach will also help with interpretation as the measurement errors are causing biased coefficients for OLS regression lines Bland-Altman Technique Bland-Altman plot can be used as a visual analysis tool (Altman & Bland 1983). It is also called as a difference plot and it is used for comparison of two measurements of the same variable that both have some errors. In Bland-Altman plot the mean of the measurements is placed on x-axis and the difference of the measurements is placed on y-axis. It is expected that the values are clustered around the mean of the differences line, which also describes the bias. If the line is above zero, the values for the measurement method selected as control method tends to be higher than the values for the other method selected as assessment. The conclusion is opposite if the line is below zero. Bland-Altman plot includes ±2 standard deviation of the difference s lines and the trend of differences line. If the values are normally distributed and placed within 2 standard deviations of the mean and between the lines, it will provide the 95% limit of the confidence interval. This is also called as limits of agreement between the two measurement methods. The trendline describes the difference in the variances of two measurement methods. Steeper trendline refers to the larger difference between the variances. The trendline coefficient is zero if the error variances are equal, positive if the assessment variance is smaller than control variance and negative in the opposite situation. 2.2 Volume Prediction in Finnish NFI In latest NFI the volume estimation follows the framework described in Tomppo et al. (2011a) for 9 th National Forest Inventory of Finland. The volume was defined as tree stem volume with bark. The tree stem starts from above the stump until the top of the 20
24 tree and it does not include the branches. The volume estimation was produced for all trees over 1,3 meters in height. The volume functions, taper curve models and sample tree measurements were used for predicting the tree volumes and volumes for timber assortment classes. In prediction Laasasenaho volume functions as well as models for other species were utilized with estimates of the parameters for the following tree species; pine, spruce, birch, aspen, alder and Siberian larch (Tomppo et al. 2011, 75-77). For other coniferous and broad-leaved tree species the models for pine or birch were applied. When all three explanatory variables dbh, d6 and h are available for the Laasasenaho model, the parameter estimates of the model by tree species are according to table 1. Table 1. The estimates of Laasasenaho model (1) parameters Species b1 b2 b3 b4 b5 b6 Pine 0, Spruce Birch The equation of Laasasenaho volume model (1) with three explanatory variables is as follows: v = b 1 dbh 2 + b 2 dbh 2 h + b 3 dbh 3 h + b 4 dbh 2 h 2 + b 5 (dbh 2 + dbh d6 + d6 2 ) + b 6 d6 2 (h 6) (12) Where the explanatory variables are dbh, d6 and h. When only two explanatory variables d and h are available the parameter estimates of the model by tree species are according to table 2. Table 2.The estimates of Laasasenaho model (2) parameters Species b1 b2 b3 b4 b5 Pine 0, ,99676 Spruce 0, , ,99146 Birch 0, ,
25 The equation for the volume prediction is as follows. v = b 1 dbh b2 h b 3(h 1.3) b 4b 5 dbh (13) Where the explanatory variables are dbh and h. 22

26 3 Research Materials and Methods 3.1 Field Data The field work was done as part of the Natural Forest Resources Centre research project. The data collection team was working in pairs and before the field work started the team was trained on how to use the NFI measurement instruments. The field measurements and use of instruments were rehearsed in advance and before entering the field Lapinjärvi For this study the data was collected in Lapinjärvi during the months of June and August Lapinjärvi municipality is in southern Finland (N= , E= (ETRS-TM35FIN), Figure 2). Natural Resources Institute Finland manages the research forests owned by Metsähallitus and Lapinjärvi research forest was established in It consists of two research forest areas, which are Holmgård (150 ha) and Latokartano (250 ha) ( The field data for this study was gathered from Latokartano area, which belongs to the southern Boreal Forest Zone and consists of mainly managed boreal forest. Scots pine and Norway spruce are the dominant tree species and the site quality varies from groves to barren heaths. Figure 2. Lapinjärvi research forest in Finland. 23
27 According to Natural Resources Institute Finland website, Lapinjärvi research forest has been also used as a gene bank for ensuring the preservation of the native genome material for Scots pine and Norway spruce Sample Plots For planning and positioning the sample plots prior to the field measurements, the information regarding tree stratums and tree stands was exported from the Silvia system owned by Metsähallitus. The sample plots were positioned for different types of forests with varying tree species ratio, forest density and tree diameters on breast height. The sample plot maximum radius was 20 meters with reference to 12 th NFI, where the maximum radius is 9 meters (Valtakunnan metsien 12. inventointi (VMI12). The sample plot mean height had to be over 5 meters and they were grouped based on the stratums and properties of the living trees as follows. Dominated tree species 1. Scots pine dominated, >70 % of the volume 2. Norway spruce dominated, >70 % of the volume 3. Broad leave species dominated, >70 % of the volume 4. Coniferous species, other than 1 or 2, >70 % of the volume 5. Mixed species, none of the above Forest density Basal area >10 m 2 / ha Basal area m 2 / ha Basal area m 2 / ha Basal area >30 m 2 / ha Diameter on breast height dbh < 12 cm dbh < cm dbh > 25 cm 24
28 Every sample plot was labelled with 3 numbers indicating the criteria from each stratum category. For example, sample plot with label 413 indicated that this plot represented the stratum 4. Coniferous species with 1. Basal area >10 m 2 / ha and 3. dbh > 25 cm. The total of 131 sample plots were placed in Lapinjärvi research forest so that several sample plots were representing the same stratum. The plan was to measure at least one sample plot for each stratum type. The extra sample plots representing the same stratum were only reserve plots in case the chosen sample plot did not really represent the expected stratum. The plan was to measure 36 sample plots in Lapinjärvi. However, as it turned out, only 18 sample plots were measured due to the lack of time and resources. One reason for this was the sample plot size and the amount of the tree measurements, which was much larger than for instance in 11 th NFI. In 11 th NFI the average amount of the tally trees on one sample plot was 11,5 pcs and every seventh tree was selected as a sample tree (Tuominen et al. 2014). In this study the amount of the sample trees ranged from 10 to 27 pcs. The sample plots were positioned in Lapinjärvi based on certain requirements. For one forest stand there was a possibility to position only one sample plot. The sample plot distance to the stand boundary had to be at least 20 meters and to the closest road at least 40 meters. The distance between the sample plots had to be at least 100 meters. However, the sample plots were positioned close to the road network and each other so that the commuting time between the plots could be minimized. The sample plots were also positioned outside of the areas with any other ongoing research activity. The centre points of the sample plots were subjectively selected and positioned in ArcGIS application. Two types of sample plots were applied. The smaller trees with dbh < 45 mm were measured with relascope type of sample plot and trees with dbh 45 mm or above were measured with fixed radius sample plot. This setup was mimicking the 12 th NFI setup. From the sample plots some general information was gathered as well as the sample plots were GNSS positioned and marked out. The positioning was done according to the 12 th NFI with the most precise GNSS positioning device. Accordingly, the marking 25
29 out was done with the wooden stick labelled with the sample plot number and positioned in the centre point of the sample plot. There was a possibility to move the centre point of the sample plot in case it was originally positioned in the inadequate place or the stratum criteria was not fulfilled. In this case both the originally planned centre point and the new centre point had to be marked out. The same sample plots were to be used also for other research purposes and measurements and therefore the marking out was important. The sample plot general information gathering process was also based on the 12 th NFI and consisted of data regarding the land class, fertility types and accomplished drainage Tree measurements The instructions regarding individual tree measurements were based on the 12 th NFI guidance. Only tally tree specifications were modified for this study. Categorisation of the tree types was simplified to better match the requirements in this study, and it consisted of six tree types. 1. Living trees, 2. Usable and unusable standing dead trees (in standing position more than 45 degrees), 3. Lying dead trees with the standing part over 1,3 m, 4. Standing stumps over 1.3 m, 5. Living bushes and 6. Dead bushes. The trees with at least 45 mm dbh were measured from the circular sample plot with fixed radius. The sample plot radius was adjusted based on the dbh of the trees. The sample plot radius was 9 meters for the trees with dbh between mm, 15 meters for the trees with dbh mm and 20 meters for the trees with dbh at least 300 mm. Trees with dbh less than 45 mm were measured with the relascope type of the sample plot and with a basal area factor 1,5. The tally trees were also numbered in clockwise numerical order as well as coordinates of the trees were recorded by using the bearing and distance on dbh height from the plot centre with scale ranging from 0 to 400. The sample plot tree species and tree classes were recorded according to the 12 th NFI guidelines. The Sonar caliper was used for the dbh measurements as well as for measuring the distance between the tree and the sample plot centre point (Figure 3). The distance was measured as horizontal distance on the dbh height. 26
30 Figure 3. Sonar caliper measurement equipment. The tree classes were recorded partly according to the 12 th NFI guidelines. Tree class was based on the current tree volume and the current volume of the timber assortments. Living trees were classified to five classes, dead trees to five classes and stumps in one class (Koivuniemi 2016). Sample trees were selected from among the tally trees, which were not classified as dead trees or bushes. A tally tree was a sample tree if the dbh was at least 45 mm and it exceeded the relascope factor 1,5. Every third tally tree with dbh less than 45 mm was a sample tree. The tree height and the length of the broken part was measured for stems and dead trees selected as sample trees. In case the relascope method did not produce the sample trees for all the tree classes, the basal area based median tree was selected for the sample tree. Other sample tree measurements like lower limit of dead and dry branches, lower limit of living crown, height and the length of the broken part were measured according to the 12 th NFI guidelines. The age was estimated for the basal area based median trees. All field data collected in the field was entered into digital form with the field computer. Upper stem diameter (d6) was measured at height 6 m from sample trees with heights of at least 8 m and perpendicular to the radius to plot centre. The upper stem diameter was measured traditionally with the parabolic caliper as well as with new dendrometer device, Criterion RD This dendrometer was used also for the dbh measurements prior to d6 measurements. Total of 326 sample trees were measured and for 250 trees dbh was measured twice with Criterion. The upper stem diameter was measured for 250 trees twice with Criterion by both observers and for 305 trees once with Caliper either by observer 1 or 2. Table 3 presents the sample tree measurement statistics for used equipment, observers, 27

31 observed values, species and number of sample trees. For the Sonar measurements the observer information could not be separated as this was not recorded as a part of the field data. Therefore, in table 3 the observer for Sonar is 1 or 2. Table 3. Sample tree measurement statistics and number of sample trees (n) for observed dbh and d6 Equipment Sonar Criterion Caliper Observed variable dbh dbh d6 d6 Observer 1 or Scots Pine Norway Spruce Birch Aspen Grey Alder Sample trees total Criterion RD 1000 Electronic Dendrometer The Criterion RD 1000 device utilizes the laser technology, where a laser beam is used to measure the distance to the object (Figure 4). In-scope LED projects a measurement bar scale that represents a subtended horizontal angle. The RD 1000 uses this angular measurement and the horizontal distance to the target tree to calculate the diameter of the tree stem (Criterion RD 1000 user s manual 2018). Figure 4. Criterion RD 1000 electronic dendrometer. According to Criterion RD 1000 user manual the device can be used as a basal area factor scope and dendrometer. As a dendrometer it can be used for measuring the diameter of the tree stem at any height. It is capable to measure the diameters from 5 to 254 cm. However, it requires as an input value the distance between the measurer and 28

32 object. In this study the distance to tree was measured with Vertex ultrasound transponder on dbh level. Vertex transponder was also utilized in this study as well as in the 12 th NFI for tree height measurements. The transponder was calibrated before each of the sample plot measurements. With reference to the Criterion user manual the horizontal distance means the level distance between the dendrometer eyepiece and the point of measured object on the face of the tree. The horizontal distance, measured by the Vertex equipment, had to be given as an input value before the dbh or d6 measurements. The target visibility could be improved a lot by an attachable magnifier. Also, a monopod was utilized to decrease the wobble and increase the measurement precision. For the dbh and d6 measurements the Criterion offered two alternative measurement bars as visualized in figure 5. During the equipment testing it was noticed that the gap bar scale was more suitable for the diameter observations and it was used also in this study. Figure 5. Criterion RD 1000 diameter measurement bars. 3.2 Data Analysis methods The data analysis and processing as well as producing the results were done with Microsoft Excel and with the statistical programming language R and R Studio data analysis software (RStudio Team, 2018). The field data was collected with Psion Workabout Pro field computer and transferred to the laptop data folder in CSV data format. This data format enabled the further data analysis operations in RStudio. The tree measurements were obtained with the precision according to 12 th NFI field work manual and the measurement unit was millimetre ((Valtakunnan metsien 12. inventointi 29
33 (VMI12) 2015). The data analysis produced values with theoretical precision of several decimal places, but the results were rounded to the values with two decimal places Precision and Accuracy of the Different Measurement Equipment The precision of the different measurement equipment as well as observers was analysed by comparing the standard errors of the different measurement methods. For analyzing the accuracy of the measurement equipment, paired datasets for dbh and d6 were compared. The dbh was measured with Sonar and Criterion and d6 was measured with Caliper and Criterion. As defined in Bland-Altman technique the individual observations produced by two types of measurement equipment were compared. The accuracy of the Criterion dbh and d6 measurements were calculated in relation to the reference measurements provided by the different type of the measurement equipment. For further analysis the Criterion data was plotted against the reference data produced with the comparable equipment and the scatterplot was enriched with the GMFR line and identity line as well as with the OLS regression line. Furthermore, the Bland-Altman plots were produced for the visualization of the bias analysis in different measurement methods similarly than in GMFR method. In Bland- Altman plot the mean difference line provides the estimated bias and the plotted values are representing the variance of the different measurement method. For analysing the difference between the different measurement methods, the error variance was further examined. The maximum standard error (smax) consisting of Criterion and Caliper errors, was calculated for Criterion d6 measurements with initial assumption that the error is zero in the comparable measurement method i.e. in Sonar or Caliper measurements. The same approach was applied for comparing the dbh measurement methods. Following equation was applied for d6 measurement methods. s max = 1 n 1 (d6 CRI d6 CAL ) 2 n i=1 (14) However as mentioned earlier, Sonar and Caliper measurements were not either error free, therefore the standard errors for the referenced methods were adopted from the earlier studies conducted by Päivinen et al for Caliper and by Hyppönen and Roiko-Jokela 1978 for Steel Caliper. This procedure made it possible to calculate the 30
34 estimated standard error for Criterion d6 as well as for dbh measurements by subtracting the reference methods standard error from the Criterion maximum standard error. The following equation was applied for Criterion d6 estimated standard error and the same approach was applied for the dbh measurements. s method = (s max 2 s ref 2 ) (15) For further analysing the errors between the observer specific measurements and the mean of the measurements was calculated for those measurement methods, where the same variable was measured twice by the different observers. The mean of the measurements was assumed to represent the best estimate of the true measurement value and for each of the measurement method the difference between the observer measurement and mean of the repeated measurement was calculated for d6 Criterion measurements. s CRI(d6) = (d6 CRI(o) d6 CRI(mean) ) 2 (16) The observer impact in measurement error was analysed based on between-observer and within-observer error variances as presented in equation 16. Between-observer variance was calculated as the amount of variation between the observations obtained by two or more observers examining the same material as follows. SS between = n (d6 CRI(o) d6 CRI(mean) ) 2 (k 1) (17) Within-observer variation was produced based on the amount of variation for the dbh or d6 measured by different observers as presented in equation 17. It was calculated as the mean of the error variance for the both observers and this illustrates the random variation between observers. SS within = (d6 CRI(o) d6 CRI(o1) ) 2 N k (18) Where n is the number of observations, k is the number of groups, o is referring to observer and with index 1 to the first observer. 31
35 Furthermore, the F test as specified in equation 18 was utilized for finding out if the variation within and between groups was statistically significant. The result of F test is presented as the p-value. F = SS between SS within (19) Precision and Accuracy of Volume Estimates The strategy impact analysis was done by calculating the sample tree volumes by using different types of Laasasenaho volume models, with d6 and without d6 measurements. The volumes were calculated also with species specific model parameters for Scots pine, Norway spruce and Birch trees. As visible in table 3 also other species were measured and these were grouped together with Birches for the volume modelling as well as for further analysis. The error variances for the tree volumes were compared between different types of methods including the different measurement equipment as well as Laasasenaho volume models. Volumes for Scots pine, Norway spruce and Birch including other species were calculated with d6 measurements produced by Criterion and Caliper and with dbh mean. Volumes were also calculated for the same tree species without d6 measurements and with dbh mean and dbh measurements produced by Sonar and Criterion. The accuracy for the sample tree volumes was analysed with similar methods than the measurement accuracy Comparison of the Predicted and Observed Upper Stem diameter For further analysing the upper stem diameter impact in volume estimation, the upper stem models were produced by utilizing the d6 as well as dbh measurements gathered by the different equipment. The d6 models were produced separately for each species group and they were applied for the sample plot volume prediction. The mean of the dbh measurements was assumed to be the true value for the d6 model parameters as well as for the volume estimations. Finally, the measurement errors were compared with the predicted volume errors to find out the differences between them. 32
36 3.2.4 Evaluation of the Measurement Strategy Impact in Efficiency For evaluating the selected measurement strategy impact in efficiency, different types of scenarios for producing the sample plot volumes were chosen as well as compared. The comparison of the sample plot volumes was done similarly to the measurement and volume accuracy comparison i.e. the accuracy between the sample plot specific volume estimations was compared. For producing the sample plot specific volumes, the height for tally trees was calculated with Näslund s equation, which is a two-parameter height-diameter model. Furthermore, Laasasenaho volume functions and models were utilized for the volume prediction. The efficiency was analysed by assuming that the more measurements are taken, the more time is spent as well as the bigger is the overall cost of the measurements. Therefore, following different types of measurement scenarios were utilized in the analysis as follows: Scenario 1. No upper stem diameter is measured, and volume is calculated with dbh and h parameters. Scenario 2. The upper stem diameter is measured for every sample tree and the volume is calculated with h, dbh and d6. Additionally, following sample tree selection related scenarios were analysed for the volume models with d6: Scenario 3. Only one sample tree is selected from the 70 % percentile of sample trees and used for the sample plot volume estimation. Scenario 4. Total of three sample trees are selected from the sample tree percentiles of 10 %, 50 % and 90 % and used for the sample plot volume estimation. Scenario 5. Total of five sample trees are selected from the sample tree percentiles of 10 %, 30 %, 50 %, 70 % and 90 % and used for the sample plot volume estimation. 33
37 4 Results of the Study Overview of the Data The main characteristics of the field data for dbh and d6 was produced for each dbh and d6 measurement equipment and observer according to the table 4. Additionally, the data was stratified in histograms based on the number of observations, observers, measurement results as well as species. The species-specific histograms are attached in appendix 2. For further analysis the data was also visually assessed with the Quantile-Quantile plot method. QQ-plots were utilized for analyzing if the collected field data was normally distributed, which impacts in the selection of the statistics methods for further data analysis. QQ-plots are available in appendix 3. As visualized by the histograms and QQ-plots, the data is near enough the normal distribution and earlier presented research methods for this data are applicable. Figure 6. Measurement data covering all species in histograms, where n is number of observations. 34
38 4.1.2 Measurement Equipment and Observer Precision For analysing the precision and variance of the different measurement equipment and related variables, Criterion was compared with Sonar and Caliper measurements. However, the data was including some measurements, where the difference between the referenced observations was over 10 centimetres. Therefore, some of the observations were removed from the data. In dbh standard error analysis 3 pcs of observations were removed due to wrong marking or reading of the measurement result. All of the removed dbh observations were identified in the group of Birches or other species. For the analysis the observations were grouped so that all the observations were compared with Sonar and Caliper observations measured by observer 1 or 2. Table 4. Standard error for Criterion with reference to earlier research with Steel Caliper for dbh and Caliper for d6. Number of observations is n, standard error s and measurement unit is mm. Species variable n n (erased) smax sref scri All dbh Scots Pine dbh Norway Spruce dbh Birch and other dbh All d Scots Pine d Norway Spruce d Birch and other d In table 4 the results of Criterion dbh measurements were compared with earlier results of Steel Caliper dbh measurements as there were no earlier research results available for Sonar dbh measurements. The dbh reference value for Steel Caliper standard error was referenced to research results provided by Hyppönen & Roiko-Jokela (1978). Additionally, the table 4 results indicate that Criterion s best performance was achieved in d6 measurements and for Scots Pine, where the standard error was 0,69 centimetres. However, when Criterion standard errors were compared to the reference standard errors of Caliper, the Criterion performance in all the variables as well as for all tree species seem to be worse than in earlier research conducted by Päivinen et al The standard error for Criterion in d6 measurements was for all the species 1,04 35
39 centimetres and based on earlier studies the Caliper standard error for d6 measurements was 0,7 centimetres. In table 4, the column erased (n) consists of the amount of observations erased from the random error variance analysis due to over 10 centimetres difference between the measured observation. These types of errors are normally caused by typos or by wrong reading during the data gathering. Furthermore, the measurement standard errors were compared with the reference values of mean of the measurements (Table 5). The mean of the measurements was calculated as a mean of the observers for the same variable and with same equipment. In this comparison the Criterion results were quite like the previous results so that standard errors were smallest in d6 measurements with Criterion. Table 5. Standard error and bias for Criterion with reference to mean of the measurements. Number of observations is n, standard error s and measurement unit is mm. Species variable n scri scri (%) bias bias (%) All dbh Scots Pine dbh Norway Spruce dbh Birch and other dbh All d Scots Pine d Norway Spruce d Birch and other d In table 5 the bias was calculated between the Criterion measurements and mean of the Criterion measurements according to equation 1. The highest bias -3,05 mm was recorded in dbh measurements and for Scots Pine. This indicates that the Criterion is producing systematically underestimates for the dbh measurements. For d6 observations the bias for all the species was surprisingly low, only 0,45 mm when the individual measurements were compared to the mean of the measurements. The observer performance and precision were analysed similarly than the measurement equipment precision but based on the observer standard errors within and between observers. The results in table 6 and the boxplots in figure 7 are indicating there 36
40 is no difference between the standard errors for different observers and variables. The p-value in all of the data groups indicates that the differences between the means of the measurements is not statistically significant. Table 6. The standard error (s) for Criterion dbh and d6 by observers. Observer 1 Observer 2 Species n sdbh sd6 n sdbh sd6 All Scots Pine Norway Spruce Birch and other Table 7. Criterion standard errors (s) within and between observers Species variable n SSwithin SSbetween SStotal p-value All dbh Scots Pine dbh Norway Spruce dbh Birch and other dbh All d Scots Pine d Norway Spruce d Birch and other d Figure 7. Between and within observer boxplots for dbh and d6. 37
41 4.1.3 Measurement Equipment Accuracy For analyzing the accuracy, the variances for different combinations of measurement equipment and variables were calculated for further processing of the GMFR parameters. With reference to attached main characteristics of the data, the GMFR regression line equations and coefficients for the Criterion dbh and d6 measurement comparisons with Sonar and Caliper were calculated (Appendix 4). Also the coefficients for the OLS line were produced for the evaluation of the difference and distance between the OLS and GMFR lines. The OLS line was produced as a linear regression trendline between the observations with different equipment and the GMFR line slope with the following equation. GMFR = sd CRI sd ref (20) Where sdcri is the standard deviation for Criteion and sdref is the standard deviation for Sonar or Caliper measurements. Figure 8 plots are visualizing the results for the dbh observations, where the GMFR line is very close to the identity line and similarly, the OLS line is very close to the identity line. For dbh measurements the coefficients of the regression lines are very similar in all species, so this indicates that both dbh measurement methods are subject to similar errors in all species. 38
42 Figure 8. The plot of dbh field measurements against the reference data. The identity line is presented with a solid line, OLS with dashed line and GMFR with dotted line. Figure 9 visualizes the similar results for d6 measurements, which indicates that the two measurement methods for d6 measurements are subject to about equal errors. All the lines are placed almost top of each other and they are perfectly in line with the identity line. 39
43 Figure 9. The plot of d6 field measurements against the reference data. The identity line is presented with a solid line, OLS with dashed line and GMFR with dotted line. Bland-Altman results for the measurement method comparison are presented in figures 10 and 11. The bias in Bland-Altman plots is described with a mean of difference line as presented earlier in chapter The bias was smallest for the Scots Pine dbh measurements and highest in dbh measurements for Birch and other species. The mean difference line is in all cases above the zero line and this indicates that the Criterion equipment is underestimating both dbh and d6 observations when it is compared with Sonar or Caliper observations. The trendline describes the relationship of variances between the different measurement methods and the trendline coefficients are very close to zero value in all the cases, which indicates similar variances for both methods. 40
44 Figure 10. The Bland-Altman plots for dbh, where the difference between measurement equipment is compared to reference data. The mean difference line and mean difference +/- 2SD lines are presented with dashed lines and the trend line with solid line. 41
45 Figure 11. The Bland-Altman plots for d6, where the difference between measurement equipment is compared to reference data. The mean difference line and mean difference +/- 2SD lines are presented with dashed lines and the trend line with solid line Precision and Accuracy of the Sample Tree Volume Estimates For further analysing the impact of different measurement method combinations in volume estimates, the sample tree volumes were calculated. The same analysis approach was taken for the individual forest parameter analysis as well as for analysing the sample tree volumes. The volume was produced in cubic decimetres (dm 3 ) for the sample trees with Laasasenaho volume functions. For the three-parameter volume model the dbh value was set to mean of the dbh measurements, so that the impact in sample tree volumes with different d6 measurement methods could be analysed. Otherwise the individual observations were used in volume estimations based on either observer 1 or 2 measurements. 42
46 The main characteristics of the data is available at appendix, where table 2 consists of 2-parameter volume model data and table 3 consists of 3-parameter volume model data. Coefficients for GMFR lines were calculated by utilizing the standard deviations for the estimated sample tree volumes. Figures 12 and 13 are visualizing the sample tree volumes with GMFR, OLS and identity lines. Figure 12. The plot of volumes with dbh, where identity line is presented with a solid line, OLS with dashed line and GMFR with dotted line. When comparing the GMFR line coefficients for the sample tree volumes, they seem to be slightly further away from the identity line than for instance the GMFR coefficients in the measurement equipment specific comparison. This indicates that the error variances in sample tree volumes are increasing. It could also indicate that when the 43
47 erroneous data is utilized in the volume estimations, the errors are cumulating in the end results and the results are more disperse. Figure 13. The plot of volumes with d6 against the reference volumes. The identity line is presented with a solid line, OLS with dashed line and GMFR with dotted line. 44
48 Bland-Altman results for sample tree volumes with two types of Laasasenaho models are presented in figures 14 and 15. Figure 14. The Bland-Altman plots for sample tree volumes including dbh measurement errors. All the bias values in sample tree volume estimation are positive values, similarly to the measurement equipment comparison. Especially the 2-parameter volume model with dbh measurements produced volumes that are relatively more biased than the results produced with the 3-parameter volume model. Furthermore, the volumes are relatively more biased than the individual measurements. This is visible in both Bland-Altman figures 14 and 15 consisting of plots for the sample tree volumes. 45
49 Figure 15. The Bland-Altman plots for sample tree volumes including d6 measurement errors. Furthermore, the Bland-Altman as well as GMFR results in table 8 illustrates that both the bias as well as standard error are increased when the results were impacted also by the modelling errors. The relative bias for individual dbh measurements was 0,3 % and for 2-parameter volume model 6,63 %. For individual d6 measurements the relative bias was 0,22 % and for 3-parameter model 5,10 %. Between the model types the 3- parameter model produces less biased results than 2-parameter model when the results are compared to sample tree volumes produced by the model where the parameters are mean of dbh and mean of d6 observations. Similarly, the relative standard errors are increased by several percentage units when sample plot volume results are compared with the relative standard errors for individual measurements. 46
50 Table 8. Standard error and bias for sample tree volumes produced by Criterion. Number of observations is n, standard error smodel and the unit is dm3. Species volume model n Smodel Smodel (%) bias bias (%) All 2-parameter Scots Pine 2-parameter Norway Spruce 2-parameter Birch and other 2-parameter All 3-parameter Scots Pine 3-parameter Norway Spruce 3-parameter Birch and other 3-parameter Measurement Strategy Impact in Efficiency The sample plot volumes were calculated based on the sample and tally tree measurements as well as estimated variables for tally tree heights and upper stem diameters. Heights were estimated for the tally trees by Näslund s height model and with total of 326 sample tree measurements. Upper stem diameters were estimated by linear regression based on 533 individual sample tree measurements. For d6 model the mean of the dbh measurements was utilized as the explanatory variable and d6 observations were utilized as the dependant variable. Furthermore, the heights and d6 were modelled by species for each of the sample plot. Following models and their coefficient of determinations were produced. The sample plot specific models could not be produced due to limited amount of the available sample trees for all the species and therefore, the d6 models were calculated on the research area level (figure 16). Scots Pine: d6 est = 0,904 dbh 27,262, where R 2 = 0,904 Norway Spruce: d6 est = 0,863 dbh 6,774, where R 2 = 0,927 Birch and other species: d6 est = 0,881 dbh 20,175, where R 2 = 0,953 47
51 Figure 16. Regression models for d6. The sample plot specific volumes were produced by Laasasenaho 2-parameter and 3- parameter volume models depending on the data availability for d6 measurements. The sample tree height percentiles were calculated for the different sample tree and sample plot volume modelling scenarios based on the sample tree dbh observations and as presented in chapter Figure 17 visualizes the differences in the sample plot volume estimates depending on the sample tree selection criteria and selected scenario. The highest volume estimates were produced with Laasasenaho 2-parameter model and the lowest with the scenario 4, where three sample trees were selected from percentiles p1, p2 and p9. By assuming that the 3-parameter volume model produced the error free volume estimates, it was set as a reference value for the sample tree measurement efficiency analysis. Based on this assumption the RMSE and bias for other sample plot measurement scenarios and related volumes could be calculated as follows and with reference to Scenario 2. Table 9. The accuracy and precision of sample plot volumes in m 3 /ha. Scenario 1 Scenario 3 Scenario 4 Scenario 5 Bias RMSE Sample trees (n)
52 This experiment illustrates that the sample tree selection strategy must be carefully considered as sometimes also fewer sample trees could provide more reliable results. In this experiment the most reliable results were achieved with the scenario, where only one sample tree was available for each of the sample plot and from the dbh percentile of 70 %. Figure 17. Sample plot volumes for different scenarios in m3/ha. 49
53 5 Discussion Sample plot measurements are in important role and key elements of the National Forest Inventory. Measuring the forest parameters and especially the sample tree variables is very time consuming and therefore more efficient measurement methods need to be studied. However, the most efficient measurement methods should be in balance with the accuracy and reliability as well. The purpose of this study was to research the upper stem diameter measurement strategy as well as the impact in the volume predictions. Measuring the upper diameter with Caliper and 5-meter rod was considered as complicated as well as unreliable method and therefore the d6 measurement was removed from the NFI s sample plot field data set few years ago. Not only that the Caliper and 5-meter rod is quite complex to be carried around as well as assembled and disassembled, it also might cause danger when trying to take the measurements during the thunderstorms. However, leaving out the d6 measurements from the sample plot field data set is causing some more errors in the volume estimation and for instance referring to Laasasenaho 2-parameter and 3-paremeter models, the volume model standard error is reduced around 10 %, when d6 is also utilized as an input parameter for the model (Laasasenaho 1982). In this assumption the d6 measurements are considered as error free. In normal situation the measurement errors caused by the dbh, d6 or height measurements will increase the sample tree volume estimate standard errors with few more percentages. Due to the accuracy and precision requirements as well as considering the measurement easiness, more compact and safer equipment needed to be tested for d6 measurements and this equipment was Criterion, laser-based dendrometer. The data for this study was gathered based on slightly amended approach when referring to the 12 th NFI fieldwork instructions. The main change was to extend the sample plot diameter from 9 meter to maximum of 20 meter, which also multiplied the amount of the tally as well as sample trees to be measured. Furthermore, the dbh and d6 measurements were repeated by two separate observers so that the observer specific impact in measurement precision and accuracy could be analysed. The reference values caused some challenges for the selection of the data analysis methods. In most previous studies the reference values have been assumed to be the 50
54 true values even if the errors are present and not known. For instance, the field measurements are often assumed to be error free and, in that case, the real errors are ignored. The reference data problem has been traditionally solved by either ignoring it or gathering only a small portion of data consisting of also the reference data from the felled trees. In this study the selected data analysis methods could be considered applicable for such research topics where the errors are present also in reference values. It would have been interesting to have reliable measurements available as a reference values so that more accurate and reliable estimations regarding the Criterion performance could have been obtained. However, the applied methods in the statistical analysis of the data did take into consideration that the reference data is not either error free and therefore the results obtained in this study give good idea about the Criterion performance in dbh and d6 measurements. Especially when same results were achieved with different statistical analysis methods Measurements and Equipment The measurement equipment precision, accuracy and efficiency were analysed based on the measurement theory related methods and by calculating standard errors as well as bias values. The measurement precision and accuracy were at first analysed based on earlier research results obtained by Päivinen et al. (1992) and Hyppönen & Roiko- Jokela (1978). At second phase the measurement precision and accuracy were analysed with reference to the mean of the repeated measurements. Additionally, between and within observer precision was analysed based on the individual measurements. Finally, the measurement equipment precision and accuracy were visually assessed with GMFR as well as with Bland-Altman plots. Criterion performance in dbh measurements was poor when referring to previous research materials produced by Hyppönen & Roiko-Jokela 1978 and Päivinen et al Only in d6 measurements for Scots Pine the Criterion was performing similarly to the reference equipment. The Criterion standard error was 6,87 mm and the reference equipment standard error based on the earlier research was 6,00 mm. However, the reference study was done only for Scots Pine, which means that in this study the Criterion performance is better for Norway Spruce and Birches than the results are indicating. 51
55 When mean of the measurements was utilized as a reference value, Criterion was performing quite similarly in all the measurements and the standard errors were varying between 5,56 mm and 10,37 mm. The highest standard error in comparison to mean of the measurements was recorded in dbh observations and for Norway Spruce This study results can be compared also with the results achieved by Pitkänen et al where the same field data was utilized as a reference data for TLS measurements of dbh and d6. In TLS measurements the dbh RMSE was between 7,34 mm and 9,76 mm, depending on the applied fitting method and in d6 measurements the TLS produced RMSE between 8,44 mm and 13,09 mm. In relative RMSE comparison the Criterion measurements seem to be both, more precise and accurate, when the reference value is the mean of the measurements. For further analysing the difference between the observers and within observers, the variance analysis as well as F-statistics related p-values were produced. The variance analysis showed that there was no statistically significant difference within or between the observers or in related errors. This confirmed that the standard errors of the different measurement equipment are not caused by the observer variance. The visual assessment of the measurements also indicated that both, the dbh measurements with Sonar and measurements with Criterion are subject to equal errors. In Bland-Altman the difference between the measurement methods was defined as a function of their mean. In case the differences between two measurement methods are normally distributed, 95 % of the observations should be between ±2 SD lines. This was present in all Bland-Altman plots. The mean of the differences was also in all the plots above the zero line, which indicates the systematic bias in Criterion measurements. More precisely it indicates that Criterion underestimates when the measurements are compared with Caliper or Sonar measurements. One reason for Criterion s poor performance could have been caused by the distance to tree stem measurements. This was not considered when analysing the overall Criterion performance and in case the distance to tree stem was not right it could have impacted in the diameter measurements as well. 52
56 5.1.2 Sample Tree Volumes For comparing and analysing the reliability of the volume estimates with or without the d6 measurements, the volumes were calculated for the sample trees by 2-parameter and 3-parameter models of Laasasenaho. This analysis helped to answer the question if the measurement errors combined with model errors are providing less accurate and less precise results than individual measurements. The reference data in this experiment was produced with models where the mean of the measurements for dbh and d6 parameters was assumed to be the true value. The accuracy and precision were analysed similarly to the individual measurements and visualized with GMFR and Bland- Altman plots. The same trend followed in the sample tree volume results what was visible also in the individual measurements. However, the relative bias values and standard errors were much higher than in individual measurements, which indicates the presence of the modelling error. The measurement errors are always producing bias in the sample tree volumes, because the volume model is nonlinear (Kangas, 1996) Efficiency and Sample Plot Volumes The efficiency analysis and the d6 prediction impact analysis in total sample plot volume estimation was done by selecting predefined scenarios for the sample plot volume estimation. The scenarios were chosen to present different sample tree selection as well as d6 measurement options and the results were referenced to the sample plot volumes produced with the 3-parameter volume model, where all the sample tree measurements were utilized, and the mean of the measurements was applied for dbh and d6 parameters. The sample trees for the different scenarios were chosen from the certain percentiles to see if there is a significant difference in the sample plot volumes based on the number of the sample trees as well as the size of the chosen sample trees. In this experiment the most accurate and precise result was achieved when only one sample tree was selected from each of the sample plot and it was representing the 70 % percentile of the measured dbh values. This result shows that when the upper stem diameter model is unbiased, there is no need to measure more sample trees. However, if the upper stem diameter model had been biased, the results could have been suggesting that more sample trees were needed. 53
57 6 Conclusions The hypothesis of this study was to find out if there is a cost-efficient way to improve the volume estimation accuracy in NFI. The accuracy as well as the precision of the dbh and d6 forest parameters were analysed from the multiple angles. Also, the methods impacting in efficiency were analysed with the sample tree volumes as well as with the sample plot volumes. The most interesting finding in this study was that the Criterion variances are like Caliper and Sonar variances, however Criterion accuracy and precision were not on the adequate level to be considered as an alternative method for d6 measurements in future. Another interesting finding was related to the observer variances, which indicated that in this study the results are not depending on the observer. The sample tree selection experiment provided also interesting results regarding the measurement selection strategies, where sometimes less is more. Especially with unbiased d6 model the reliable volume estimates can be produced with fewer sample trees. Some potential improvements regarding this study came across during the data analysis and statistical methods. For example, regarding the Criterion measurement accuracy and precision analysis, there were also other elements impacting in the measurement results and causing some uncertainties. For instance, the Criterion measurement had to be taken from a certain distance from the tree stem. This distance was measured with the Vertex transponder, before taking the Criterion measurement. This was not very efficient or reliable and perhaps Criterion equipment will be developed in future so that it automatically analyses the distance between the tree stem and the observer and in this way minimizes these types of uncertainties. More research is needed and specially to understand all the characteristics around the d6 measurements and between different measurement equipment as well as for instance to identify the reason why Criterion was performing better in d6 measurements than in dbh measurements. The technology development is fast and in case new technologies are to be tested and studied also reliable reference data is an important element. In this study the reliable reference data was absent, but in future this type of reliable reference databank could be established for the future researchers and for similar topics. 54
58 References Altman, D. G. & Bland, D. G Measurement in Medicine: The Analysis of Method Comparison Studies. The Statistician, 32 (3): Chirici, G. Winter, S., McRoberts, R. E National Forest Inventories: Contributions to Forest Biodiversity Assessments. Managing Forest Ecosystems 20. Springer, Dordrecht, Netherlands. p. 206 Criterion RD 1000 Users Manual 3 rd Edition. Laser Technology, Inc. [Online document]. Available: on.pdf. [Referred to ] Government Publications 1/2016. Action Plan for the Implementation of the Key Project and Reforms Defined in the Strategic Government Programme. [Online document]. Available: lementa-tion+strategic+government+programme+en.pdf/12f723ba-6f6b- 4e6c-a636-4ad4175d7c4e. [Referred to ] Haapanen, R Valtakunnan metsien inventoinnit - Suomen metsiä mittaamassa. Metsäkustannus, Helsinki. p. 327 (In Finnish) Henttonen H. M. & Kangas A Optimal Plot Design in a Multipurpose Forest Inventory. Forest Ecosystems 2:31. SpringerOpen Journal. Hyppönen, M. & Roiko-Jokela, P Koepuiden mittauksen tarkkuus ja tehokkuus. Summary: On the Accuracy and Effectivity of Measuring Sample Trees. Folia For. 356:1-25. (In Finnish with English summary) Kangas, A On the Bias and Variance in Tree Volume Predictions due to Model and Measurement Errors. Scand. J. For. Res. 11: Koivuniemi, J Perinteisellä mittausmenetelmällä tehtävien maastomittausten ohje uusien mitaauslaitteidein käytettävyystestausta varten. Luonnonvarakeskus, Vantaa. 14p. Korhonen, K.T Calibration of Upper Diameter Models in Large-scale Forest Inventory. Silva Fennica 26(4):
59 Laasasenaho, J Taper Curve and Volume Functions for Pine, Spurce and Birch. Communicattiones Institutis Forestalis Fenniae p. Melkas, T., Vastaranta, M., Holopainen, M., Kivilähde, J. & Merimaa, M Puun läpimitan mittauksen tarkkuus ja tehokkuus laser- ja digitaalikuvatekniikkaan perustuen. Metsätieteen aikakauskirja 4/2009: Metla Research Programmes Multi-source National Forest Inventory of Finland [Online document]. Available: [Referred to ] Natural Resources Institute of Finland Lapinjärven tutkimusmetsä [Internet page]. Available: [Referred to ] Pennanen, O Pysty- ja jälkimittauksen ajanmenekki. Summary: Expenditure of time in measurement on the stump and after cutting. Metsätehon tiedotus 347. Helsinki. Pitkänen T. P., Raumonen P. & Kangas A Measuring stem diameters with TLS in boreal forests by complementary fitting procedure, ISPRS Journal of Photogrammetry and Remote Sensing, Volume 147: Päivinen, R Metsän inventoinnin suunnittelumalli. Summary: A planning model for forest inventory. University of Joensuu Publications in Sciences N:o p. Päivinen, R., Nousiainen, M. & Korhonen, K.T Puutunnusten mittaamisen luotettavuus. Summary: Accuracy of Certain Tree Measurements. Folia Forestalia p. (In Finnish with English summary) RStudio Team RStudio: Integrated Development for R. RStudio, Inc., Boston, MA. [Online document]. Available: [Referred to ] Tomppo, E., Haakana, M., Mäkisara, K. and Peräsaari, J Multi-Source National Forest Inventory - methods and applications. Managing Forest Ecosystems 18. Springer, Dordrecht, Netherlands. p
60 Tomppo, E., Haakana, M., Mäkisara, K. and Peräsaari, J The Multi-Source National Forest Inventory - methods and results 201. Working Papers of the Finnish Forest Research Institute 319. p. 224 Tomppo, E., Heikkinen, J., Henttonen, H. M., Ihalainen, A., Katila, M., Mäkelä H., Tuomainen, T., Vainikainen, N Designing and Conducting a Forest Inventory-case: 9 th National Forest Inventory of Finland. Managing Forest Ecosystems 22. Springer, Dordrecht, Netherlands. p. 270 Tuominen S., Pitkänen J., Balazs A., Korhonen K.T., Hyvönen P., Muinonen E. (2014). NFI plots as complementary reference data in forest inventory based on airborne laser scanning and aerial photography in Finland. Silva Fennica vol. 48 no. 2 article id p. Valtakunnan metsien 11. inventointi (VMI11). Maastotyön ohjeet Metsäntutkimuslaitos, Vantaa. p. 180 (In Finnish) Valtakunnan metsien 12. inventointi (VMI12). Maastotyön ohjeet Luonnonvarakeskus, Vantaa. p. 164 (In Finnish) 57
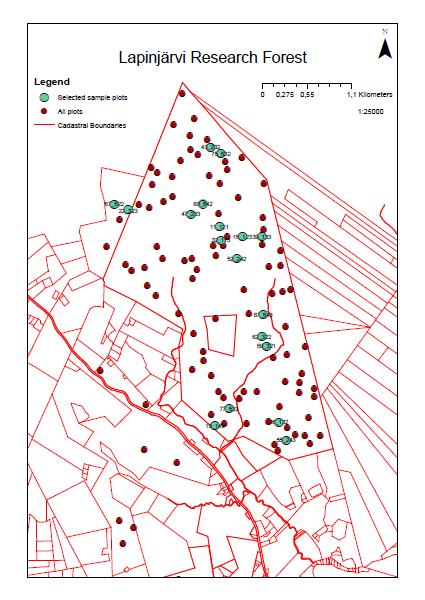
61 Appendix 1 Map of Sample Plots Appendix 1 Map of Sample Plots
Capacity Utilization
 Capacity Utilization Tim Schöneberg 28th November Agenda Introduction Fixed and variable input ressources Technical capacity utilization Price based capacity utilization measure Long run and short run
Research plan for masters thesis in forest sciences. The PELLETime 2009 Symposium Mervi Juntunen
 Modelling tree and stand characteristics and estimating biomass removals and harvesting costs of lodgepole pine (Pinus contorta) plantations in Iceland Research plan for masters thesis in forest sciences
The CCR Model and Production Correspondence
 The CCR Model and Production Correspondence Tim Schöneberg The 19th of September Agenda Introduction Definitions Production Possiblity Set CCR Model and the Dual Problem Input excesses and output shortfalls
Efficiency change over time
 Efficiency change over time Heikki Tikanmäki Optimointiopin seminaari 14.11.2007 Contents Introduction (11.1) Window analysis (11.2) Example, application, analysis Malmquist index (11.3) Dealing with panel
Tree map system in harvester
 Tree map system in harvester Fibic seminar 12.6.2013 Lahti Timo Melkas, Metsäteho Oy Mikko Miettinen, Argone Oy Kalle Einola, Ponsse Oyj Project goals EffFibre project 2011-2013 (WP3) To evaluate the accuracy
Other approaches to restrict multipliers
 Other approaches to restrict multipliers Heikki Tikanmäki Optimointiopin seminaari 10.10.2007 Contents Short revision (6.2) Another Assurance Region Model (6.3) Cone-Ratio Method (6.4) An Application of
On instrument costs in decentralized macroeconomic decision making (Helsingin Kauppakorkeakoulun julkaisuja ; D-31)
") On instrument costs in decentralized macroeconomic decision making (Helsingin Kauppakorkeakoulun julkaisuja ; D-31) Juha Kahkonen Click here if your download doesn"t start automatically On instrument costs
On instrument costs in decentralized macroeconomic decision making (Helsingin Kauppakorkeakoulun julkaisuja ; D-31) Juha Kahkonen Click here if your download doesn"t start automatically On instrument costs
Gap-filling methods for CH 4 data
 Gap-filling methods for CH 4 data Sigrid Dengel University of Helsinki Outline - Ecosystems known for CH 4 emissions; - Why is gap-filling of CH 4 data not as easy and straight forward as CO 2 ; - Gap-filling
On instrument costs in decentralized macroeconomic decision making (Helsingin Kauppakorkeakoulun julkaisuja ; D-31)
") On instrument costs in decentralized macroeconomic decision making (Helsingin Kauppakorkeakoulun julkaisuja ; D-31) Juha Kahkonen Click here if your download doesn"t start automatically On instrument costs
On instrument costs in decentralized macroeconomic decision making (Helsingin Kauppakorkeakoulun julkaisuja ; D-31) Juha Kahkonen Click here if your download doesn"t start automatically On instrument costs
16. Allocation Models
 16. Allocation Models Juha Saloheimo 17.1.27 S steemianalsin Optimointiopin seminaari - Sks 27 Content Introduction Overall Efficienc with common prices and costs Cost Efficienc S steemianalsin Revenue
I. Principles of Pointer Year Analysis
 I. Principles of Pointer Year Analysis Fig 1. Maximum (red) and minimum (blue) pointer years. 1 Fig 2. Principle of pointer year calculation. Fig 3. Skeleton plot graph created by Kinsys/Kigraph programme.
Skene. Games Refueled. Muokkaa perustyyl. napsautt. @Games for Health, Kuopio. 2013 kari.korhonen@tekes.fi. www.tekes.fi/skene
 Skene Muokkaa perustyyl. Games Refueled napsautt. @Games for Health, Kuopio Muokkaa alaotsikon perustyyliä napsautt. 2013 kari.korhonen@tekes.fi www.tekes.fi/skene 10.9.201 3 Muokkaa Skene boosts perustyyl.
Constructive Alignment in Specialisation Studies in Industrial Pharmacy in Finland
 Constructive Alignment in Specialisation Studies in Industrial Pharmacy in Finland Anne Mari Juppo, Nina Katajavuori University of Helsinki Faculty of Pharmacy 23.7.2012 1 Background Pedagogic research
Innovative and responsible public procurement Urban Agenda kumppanuusryhmä. public-procurement
 Innovative and responsible public procurement Urban Agenda kumppanuusryhmä https://ec.europa.eu/futurium/en/ public-procurement Julkiset hankinnat liittyvät moneen Konsortio Lähtökohdat ja tavoitteet Every
Information on preparing Presentation
 Information on preparing Presentation Seminar on big data management Lecturer: Spring 2017 20.1.2017 1 Agenda Hints and tips on giving a good presentation Watch two videos and discussion 22.1.2017 2 Goals
1. SIT. The handler and dog stop with the dog sitting at heel. When the dog is sitting, the handler cues the dog to heel forward.
 START START SIT 1. SIT. The handler and dog stop with the dog sitting at heel. When the dog is sitting, the handler cues the dog to heel forward. This is a static exercise. SIT STAND 2. SIT STAND. The
Network to Get Work. Tehtäviä opiskelijoille Assignments for students. www.laurea.fi
 Network to Get Work Tehtäviä opiskelijoille Assignments for students www.laurea.fi Ohje henkilöstölle Instructions for Staff Seuraavassa on esitetty joukko tehtäviä, joista voit valita opiskelijaryhmällesi
LYTH-CONS CONSISTENCY TRANSMITTER
 LYTH-CONS CONSISTENCY TRANSMITTER LYTH-INSTRUMENT OY has generate new consistency transmitter with blade-system to meet high technical requirements in Pulp&Paper industries. Insurmountable advantages are
National Building Code of Finland, Part D1, Building Water Supply and Sewerage Systems, Regulations and guidelines 2007
 National Building Code of Finland, Part D1, Building Water Supply and Sewerage Systems, Regulations and guidelines 2007 Chapter 2.4 Jukka Räisä 1 WATER PIPES PLACEMENT 2.4.1 Regulation Water pipe and its
On instrument costs in decentralized macroeconomic decision making (Helsingin Kauppakorkeakoulun julkaisuja ; D-31)
") On instrument costs in decentralized macroeconomic decision making (Helsingin Kauppakorkeakoulun julkaisuja ; D-31) Juha Kahkonen Click here if your download doesn"t start automatically On instrument costs
On instrument costs in decentralized macroeconomic decision making (Helsingin Kauppakorkeakoulun julkaisuja ; D-31) Juha Kahkonen Click here if your download doesn"t start automatically On instrument costs
GOOD WORK LONGER CAREER:
 Juhani Ilmarinen, Ville Ilmarinen, Pekka Huuhtanen, Veikko Louhevaara, Ove Näsman GOOD WORK LONGER CAREER: WORK WELL-BEING IN FINNISH TECHNOLOGY INDUSTRIES 2010-2015 Background Collective agreement between
Increase of opioid use in Finland when is there enough key indicator data to state a trend?
 Increase of opioid use in Finland when is there enough key indicator data to state a trend? Martta Forsell, Finnish Focal Point 28.9.2015 Esityksen nimi / Tekijä 1 Martta Forsell Master of Social Sciences
Returns to Scale II. S ysteemianalyysin. Laboratorio. Esitelmä 8 Timo Salminen. Teknillinen korkeakoulu
 Returns to Scale II Contents Most Productive Scale Size Further Considerations Relaxation of the Convexity Condition Useful Reminder Theorem 5.5 A DMU found to be efficient with a CCR model will also be
Supply Chain Management and Material Handling in Paper Industry Case Tervakoski Oy
 Tampere University of Applied Sciences Paper technology International Pulp and Paper Technology Supply Chain Management and Material Handling in Paper Industry Case Tervakoski Oy Supervisor Commissioned
Alternative DEA Models
 Mat-2.4142 Alternative DEA Models 19.9.2007 Table of Contents Banker-Charnes-Cooper Model Additive Model Example Data Home assignment BCC Model (Banker-Charnes-Cooper) production frontiers spanned by convex
MUSEOT KULTTUURIPALVELUINA
 Elina Arola MUSEOT KULTTUURIPALVELUINA Tutkimuskohteena Mikkelin museot Opinnäytetyö Kulttuuripalvelujen koulutusohjelma Marraskuu 2005 KUVAILULEHTI Opinnäytetyön päivämäärä 25.11.2005 Tekijä(t) Elina
Uusi Ajatus Löytyy Luonnosta 4 (käsikirja) (Finnish Edition)
 (Finnish Edition)") Uusi Ajatus Löytyy Luonnosta 4 (käsikirja) (Finnish Edition) Esko Jalkanen Click here if your download doesn"t start automatically Uusi Ajatus Löytyy Luonnosta 4 (käsikirja) (Finnish Edition) Esko Jalkanen
Uusi Ajatus Löytyy Luonnosta 4 (käsikirja) (Finnish Edition) Esko Jalkanen Click here if your download doesn"t start automatically Uusi Ajatus Löytyy Luonnosta 4 (käsikirja) (Finnish Edition) Esko Jalkanen
Julkaisun laji Opinnäytetyö. Sivumäärä 43
 OPINNÄYTETYÖN KUVAILULEHTI Tekijä(t) SUKUNIMI, Etunimi ISOVIITA, Ilari LEHTONEN, Joni PELTOKANGAS, Johanna Työn nimi Julkaisun laji Opinnäytetyö Sivumäärä 43 Luottamuksellisuus ( ) saakka Päivämäärä 12.08.2010
AYYE 9/ HOUSING POLICY
 AYYE 9/12 2.10.2012 HOUSING POLICY Mission for AYY Housing? What do we want to achieve by renting apartments? 1) How many apartments do we need? 2) What kind of apartments do we need? 3) To whom do we
Valuation of Asian Quanto- Basket Options
 Valuation of Asian Quanto- Basket Options (Final Presentation) 21.11.2011 Thesis Instructor and Supervisor: Prof. Ahti Salo Työn saa tallentaa ja julkistaa Aalto-yliopiston avoimilla verkkosivuilla. Muilta
Statistical design. Tuomas Selander
 Statistical design Tuomas Selander 28.8.2014 Introduction Biostatistician Work area KYS-erva KYS, Jyväskylä, Joensuu, Mikkeli, Savonlinna Work tasks Statistical methods, selection and quiding Data analysis
E80. Data Uncertainty, Data Fitting, Error Propagation. Jan. 23, 2014 Jon Roberts. Experimental Engineering
 Lecture 2 Data Uncertainty, Data Fitting, Error Propagation Jan. 23, 2014 Jon Roberts Purpose & Outline Data Uncertainty & Confidence in Measurements Data Fitting - Linear Regression Error Propagation
Social and Regional Economic Impacts of Use of Bioenergy and Energy Wood Harvesting in Suomussalmi
 Social and Regional Economic Impacts of Use of Bioenergy and Energy Wood Harvesting in Suomussalmi Green Cities and Settlements 18.2.2014 Ville Manninen Writers Project group Sirpa Korhonen, Anna Mari
HARJOITUS- PAKETTI A
 Logistiikka A35A00310 Tuotantotalouden perusteet HARJOITUS- PAKETTI A (6 pistettä) TUTA 19 Luento 3.Ennustaminen County General 1 piste The number of heart surgeries performed at County General Hospital
Land-Use Model for the Helsinki Metropolitan Area
 Land-Use Model for the Helsinki Metropolitan Area Paavo Moilanen Introduction & Background Metropolitan Area Council asked 2005: What is good land use for the transport systems plan? At first a literature
The role of 3dr sector in rural -community based- tourism - potentials, challenges
 The role of 3dr sector in rural -community based- tourism - potentials, challenges Lappeenranta, 5th September 2014 Contents of the presentation 1. SEPRA what is it and why does it exist? 2. Experiences
3 9-VUOTIAIDEN LASTEN SUORIUTUMINEN BOSTONIN NIMENTÄTESTISTÄ
 Puhe ja kieli, 27:4, 141 147 (2007) 3 9-VUOTIAIDEN LASTEN SUORIUTUMINEN BOSTONIN NIMENTÄTESTISTÄ Soile Loukusa, Oulun yliopisto, suomen kielen, informaatiotutkimuksen ja logopedian laitos & University
Use of Stochastic Compromise Programming to develop forest management alternatives for ecosystem services
 Use of Stochastic Compromise Programming to develop forest management alternatives for ecosystem services Kyle Eyvindson 24.3.2014 Forest Science Department / Kyle Eyvindson 3/26/2014 1 Overview Introduction
The Viking Battle - Part Version: Finnish
 The Viking Battle - Part 1 015 Version: Finnish Tehtävä 1 Olkoon kokonaisluku, ja olkoon A n joukko A n = { n k k Z, 0 k < n}. Selvitä suurin kokonaisluku M n, jota ei voi kirjoittaa yhden tai useamman
MEETING PEOPLE COMMUNICATIVE QUESTIONS
 Tiistilän koulu English Grades 7-9 Heikki Raevaara MEETING PEOPLE COMMUNICATIVE QUESTIONS Meeting People Hello! Hi! Good morning! Good afternoon! How do you do? Nice to meet you. / Pleased to meet you.
Kysymys 5 Compared to the workload, the number of credits awarded was (1 credits equals 27 working hours): (4)
: (4)") Tilasto T1106120-s2012palaute Kyselyn T1106120+T1106120-s2012palaute yhteenveto: vastauksia (4) Kysymys 1 Degree programme: (4) TIK: TIK 1 25% ************** INF: INF 0 0% EST: EST 0 0% TLT: TLT 0 0% BIO:
Tilasto T1106120-s2012palaute Kyselyn T1106120+T1106120-s2012palaute yhteenveto: vastauksia (4) Kysymys 1 Degree programme: (4) TIK: TIK 1 25% ************** INF: INF 0 0% EST: EST 0 0% TLT: TLT 0 0% BIO:
Heisingin kaupungin tietokeskus Helsingfors stads faktacentral City of Helsinki Urban Facts 0N THE EFFECTS 0F URBAN NATURAL AMENITIES, ARCHITECTURAL
 Heisingin kaupungin tietokeskus - /igc' ^' 0N THE EFFECTS 0F URBAN NATURAL TIEOUSTELUT FÖRFÄGNINGAR INQUIRIES Henrik Lönnqvist, p. - tel. 09 310 36534 etunimi.sukunimi@hel.fi JULKAISIJA UTGIVARE PUBLISHER
RANTALA SARI: Sairaanhoitajan eettisten ohjeiden tunnettavuus ja niiden käyttö hoitotyön tukena sisätautien vuodeosastolla
 TURUN YLIOPISTO Hoitotieteen laitos RANTALA SARI: Sairaanhoitajan eettisten ohjeiden tunnettavuus ja niiden käyttö hoitotyön tukena sisätautien vuodeosastolla Pro gradu -tutkielma, 34 sivua, 10 liitesivua
T Statistical Natural Language Processing Answers 6 Collocations Version 1.0
 T-61.5020 Statistical Natural Language Processing Answers 6 Collocations Version 1.0 1. Let s start by calculating the results for pair valkoinen, talo manually: Frequency: Bigrams valkoinen, talo occurred
Use of spatial data in the new production environment and in a data warehouse
 Use of spatial data in the new production environment and in a data warehouse Nordic Forum for Geostatistics 2007 Session 3, GI infrastructure and use of spatial database Statistics Finland, Population
Results on the new polydrug use questions in the Finnish TDI data
 Results on the new polydrug use questions in the Finnish TDI data Multi-drug use, polydrug use and problematic polydrug use Martta Forsell, Finnish Focal Point 28/09/2015 Martta Forsell 1 28/09/2015 Esityksen
TIEKE Verkottaja Service Tools for electronic data interchange utilizers. Heikki Laaksamo
 TIEKE Verkottaja Service Tools for electronic data interchange utilizers Heikki Laaksamo TIEKE Finnish Information Society Development Centre (TIEKE Tietoyhteiskunnan kehittämiskeskus ry) TIEKE is a neutral,
7.4 Variability management
 7.4 Variability management time... space software product-line should support variability in space (different products) support variability in time (maintenance, evolution) 1 Product variation Product
HITSAUKSEN TUOTTAVUUSRATKAISUT
 Kemppi ARC YOU GET WHAT YOU MEASURE OR BE CAREFUL WHAT YOU WISH FOR HITSAUKSEN TUOTTAVUUSRATKAISUT Puolitetaan hitsauskustannukset seminaari 9.4.2008 Mikko Veikkolainen, Ratkaisuliiketoimintapäällikkö
Teacher's Professional Role in the Finnish Education System Katriina Maaranen Ph.D. Faculty of Educational Sciences University of Helsinki, Finland
 Teacher's Professional Role in the Finnish Education System Katriina Maaranen Ph.D. Faculty of Educational Sciences University of Helsinki, Finland www.helsinki.fi/yliopisto This presentation - Background
2017/S Contract notice. Supplies
 Supplies 153936 2017 25/04/2017 S80 - - Supplies - Contract notice - Open procedure I. II. III. IV. VI. -: Medical equipments, pharmaceuticals and personal care products 2017/S 080-153936 Contract notice
Capacity utilization
 Mat-2.4142 Seminar on optimization Capacity utilization 12.12.2007 Contents Summary of chapter 14 Related DEA-solver models Illustrative examples Measure of technical capacity utilization Price-based measure
ECVETin soveltuvuus suomalaisiin tutkinnon perusteisiin. Case:Yrittäjyyskurssi matkailualan opiskelijoille englantilaisen opettajan toteuttamana
 ECVETin soveltuvuus suomalaisiin tutkinnon perusteisiin Case:Yrittäjyyskurssi matkailualan opiskelijoille englantilaisen opettajan toteuttamana Taustaa KAO mukana FINECVET-hankeessa, jossa pilotoimme ECVETiä
Miehittämätön meriliikenne
 Rolls-Royce & Unmanned Shipping Ecosystem Miehittämätön meriliikenne Digimurros 2020+ 17.11. 2016 September 2016 2016 Rolls-Royce plc The 2016 information Rolls-Royce in this plc document is the property
TM ETRS-TM35FIN-ETRS89 WTG
 SHADOW - Main Result Calculation: N117 x 9 x HH141 Assumptions for shadow calculations Maximum distance for influence Calculate only when more than 20 % of sun is covered by the blade Please look in WTG
C++11 seminaari, kevät Johannes Koskinen
 C++11 seminaari, kevät 2012 Johannes Koskinen Sisältö Mikä onkaan ongelma? Standardidraftin luku 29: Atomiset tyypit Muistimalli Rinnakkaisuus On multicore systems, when a thread writes a value to memory,
( ( OX2 Perkkiö. Rakennuskanta. Varjostus. 9 x N131 x HH145
 OX2 9 x N131 x HH145 Rakennuskanta Asuinrakennus Lomarakennus Liike- tai julkinen rakennus Teollinen rakennus Kirkko tai kirkollinen rak. Muu rakennus Allas Varjostus 1 h/a 8 h/a 20 h/a 0 0,5 1 1,5 2 km
Tynnyrivaara, OX2 Tuulivoimahanke. ( Layout 9 x N131 x HH145. Rakennukset Asuinrakennus Lomarakennus 9 x N131 x HH145 Varjostus 1 h/a 8 h/a 20 h/a
 , Tuulivoimahanke Layout 9 x N131 x HH145 Rakennukset Asuinrakennus Lomarakennus 9 x N131 x HH145 Varjostus 1 h/a 8 h/a 20 h/a 0 0,5 1 1,5 km 2 SHADOW - Main Result Assumptions for shadow calculations
Jussi Klemola 3D- KEITTIÖSUUNNITTELUOHJELMAN KÄYTTÖÖNOTTO
 Jussi Klemola 3D- KEITTIÖSUUNNITTELUOHJELMAN KÄYTTÖÖNOTTO Opinnäytetyö KESKI-POHJANMAAN AMMATTIKORKEAKOULU Puutekniikan koulutusohjelma Toukokuu 2009 TIIVISTELMÄ OPINNÄYTETYÖSTÄ Yksikkö Aika Ylivieska
ProAgria. Opportunities For Success
 ProAgria Opportunities For Success Association of ProAgria Centres and ProAgria Centres 11 regional Finnish ProAgria Centres offer their members Leadership-, planning-, monitoring-, development- and consulting
Tork Paperipyyhe. etu. tuotteen ominaisuudet. kuvaus. Väri: Valkoinen Malli: Vetopyyhe
 etu Monikäyttöpaperi hoitaa useimmat pyyhintätehtävät Sopiva lasipintojen pyyhintään Sopii käsien kuivaamiseen Elintarvikekäyttöön hyväksytty Tork Easy Handling, pakkaus, jota on helppo kantaa mukana,
EUROOPAN PARLAMENTTI
 EUROOPAN PARLAMENTTI 2004 2009 Kansalaisvapauksien sekä oikeus- ja sisäasioiden valiokunta 2008/0101(CNS) 2.9.2008 TARKISTUKSET 9-12 Mietintöluonnos Luca Romagnoli (PE409.790v01-00) ehdotuksesta neuvoston
7. Product-line architectures
 7. Product-line architectures 7.1 Introduction 7.2 Product-line basics 7.3 Layered style for product-lines 7.4 Variability management 7.5 Benefits and problems with product-lines 1 Short history of software
Characterization of clay using x-ray and neutron scattering at the University of Helsinki and ILL
 Characterization of clay using x-ray and neutron scattering at the University of Helsinki and ILL Ville Liljeström, Micha Matusewicz, Kari Pirkkalainen, Jussi-Petteri Suuronen and Ritva Serimaa 13.3.2012
TM ETRS-TM35FIN-ETRS89 WTG
 SHADOW - Main Result Assumptions for shadow calculations Maximum distance for influence Calculate only when more than 20 % of sun is covered by the blade Please look in WTG table WindPRO version 2.8.579
TM ETRS-TM35FIN-ETRS89 WTG
 SHADOW - Main Result Assumptions for shadow calculations Maximum distance for influence Calculate only when more than 20 % of sun is covered by the blade Please look in WTG table WindPRO version 2.9.269
TM ETRS-TM35FIN-ETRS89 WTG
 SHADOW - Main Result Assumptions for shadow calculations Maximum distance for influence Calculate only when more than 20 % of sun is covered by the blade Please look in WTG table WindPRO version 2.8.579
TM ETRS-TM35FIN-ETRS89 WTG
 SHADOW - Main Result Assumptions for shadow calculations Maximum distance for influence Calculate only when more than 20 % of sun is covered by the blade Please look in WTG table WindPRO version 2.8.579
WindPRO version joulu 2012 Printed/Page :47 / 1. SHADOW - Main Result
 SHADOW - Main Result Assumptions for shadow calculations Maximum distance for influence Calculate only when more than 20 % of sun is covered by the blade Please look in WTG table WindPRO version 2.8.579
WindPRO version joulu 2012 Printed/Page :42 / 1. SHADOW - Main Result
 SHADOW - Main Result Assumptions for shadow calculations Maximum distance for influence Calculate only when more than 20 % of sun is covered by the blade Please look in WTG table 13.6.2013 19:42 / 1 Minimum
Data quality points. ICAR, Berlin,
 Data quality points an immediate and motivating supervision tool ICAR, Berlin, 22.5.2014 Association of ProAgria Centres Development project of Milk Recording Project manager, Heli Wahlroos heli.wahlroos@proagria.fi
Metsälamminkankaan tuulivoimapuiston osayleiskaava
 VAALAN KUNTA TUULISAIMAA OY Metsälamminkankaan tuulivoimapuiston osayleiskaava Liite 3. Varjostusmallinnus FCG SUUNNITTELU JA TEKNIIKKA OY 12.5.2015 P25370 SHADOW - Main Result Assumptions for shadow calculations
Tarua vai totta: sähkön vähittäismarkkina ei toimi? 11.2.2015 Satu Viljainen Professori, sähkömarkkinat
 Tarua vai totta: sähkön vähittäismarkkina ei toimi? 11.2.2015 Satu Viljainen Professori, sähkömarkkinat Esityksen sisältö: 1. EU:n energiapolitiikka on se, joka ei toimi 2. Mihin perustuu väite, etteivät
toukokuu 2011: Lukion kokeiden kehittämistyöryhmien suunnittelukokous
 Tuula Sutela toukokuu 2011: Lukion kokeiden kehittämistyöryhmien suunnittelukokous äidinkieli ja kirjallisuus, modersmål och litteratur, kemia, maantiede, matematiikka, englanti käsikirjoitukset vuoden
LX 70. Ominaisuuksien mittaustulokset 1-kerroksinen 2-kerroksinen. Fyysiset ominaisuudet, nimellisarvot. Kalvon ominaisuudet
 LX 70 % Läpäisy 36 32 % Absorptio 30 40 % Heijastus 34 28 % Läpäisy 72 65 % Heijastus ulkopuoli 9 16 % Heijastus sisäpuoli 9 13 Emissiivisyys.77.77 Auringonsuojakerroin.54.58 Auringonsäteilyn lämmönsiirtokerroin.47.50
Infrastruktuurin asemoituminen kansalliseen ja kansainväliseen kenttään Outi Ala-Honkola Tiedeasiantuntija
 Infrastruktuurin asemoituminen kansalliseen ja kansainväliseen kenttään Outi Ala-Honkola Tiedeasiantuntija 1 Asemoitumisen kuvaus Hakemukset parantuneet viime vuodesta, mutta paneeli toivoi edelleen asemoitumisen
Benchmarking Controlled Trial - a novel concept covering all observational effectiveness studies
 Benchmarking Controlled Trial - a novel concept covering all observational effectiveness studies Antti Malmivaara, MD, PhD, Chief Physician Centre for Health and Social Economics National Institute for
Pricing policy: The Finnish experience
 Pricing policy: The Finnish experience Esa Österberg Senior Researcher Alcohol and Drug Research, STAKES, Helsinki, Finland esa.osterberg@stakes.fi Three pillars of traditional Nordic alcohol control Strict
Bounds on non-surjective cellular automata
 Bounds on non-surjective cellular automata Jarkko Kari Pascal Vanier Thomas Zeume University of Turku LIF Marseille Universität Hannover 27 august 2009 J. Kari, P. Vanier, T. Zeume (UTU) Bounds on non-surjective
TM ETRS-TM35FIN-ETRS89 WTG
 SHADOW - Main Result Assumptions for shadow calculations Maximum distance for influence Calculate only when more than 20 % of sun is covered by the blade Please look in WTG table 5.11.2013 16:44 / 1 Minimum
Rotarypiiri 1420 Piiriapurahoista myönnettävät stipendit
 Rotarypiiri 1420 Piiriapurahoista myönnettävät stipendit Ø Rotarypiiri myöntää stipendejä sille osoitettujen hakemusten perusteella ensisijaisesti rotaryaatteen mukaisiin tarkoituksiin. Ø Stipendejä myönnetään
KMTK lentoestetyöpaja - Osa 2
 KMTK lentoestetyöpaja - Osa 2 Veijo Pätynen 18.10.2016 Pasila YHTEISTYÖSSÄ: Ilmailun paikkatiedon hallintamalli Ilmailun paikkatiedon hallintamalli (v0.9 4.3.2016) 4.4 Maanmittauslaitoksen rooli ja vastuut...
Curriculum. Gym card
 A new school year Curriculum Fast Track Final Grading Gym card TET A new school year Work Ethic Detention Own work Organisation and independence Wilma TMU Support Services Well-Being CURRICULUM FAST TRACK
( ,5 1 1,5 2 km
 Tuulivoimala Rakennukset Asuinrakennus Liikerak. tai Julkinen rak. Lomarakennus Teollinen rakennus Kirkollinen rakennus Varjostus "real case" h/a 1 h/a 8 h/a 20 h/a 4 5 3 1 2 6 7 8 9 10 0 0,5 1 1,5 2 km
Copernicus, Sentinels, Finland. Erja Ämmälahti Tekes,
 Copernicus, Sentinels, Finland Erja Ämmälahti Tekes, 24.5.2016 Finnish Space industry in the European context European Space industry has been constantly growing and increasing its direct employment in
FROM VISION TO CRITERIA: PLANNING SUSTAINABLE TOURISM DESTINATIONS Case Ylläs Lapland
 FROM VISION TO CRITERIA: PLANNING SUSTAINABLE TOURISM DESTINATIONS Case Ylläs Lapland Tiina Merikoski, Landscape Architect (M.Sc) Aalto University School of Science and Technology Department of Architecture
TM ETRS-TM35FIN-ETRS89 WTG
 SHADOW - Main Result Assumptions for shadow calculations Maximum distance for influence Calculate only when more than 20 % of sun is covered by the blade Please look in WTG table 22.12.2014 11:33 / 1 Minimum
TAMPEREEN TEKNILLINEN YLIOPISTO Teollisuustalous
 Muista merkita nimesi Ja opiskeliianumerosi iokaiseen paperiin. Myös optiseen lomakkeeseen. Älii irroita papereita nipusta. Kaikki paperit on palautettava. TAMPEREEN 290 10 10 Tuotannonohjauksen tentti
MIKES, Julkaisu J3/2000 MASS COMPARISON M3. Comparison of 1 kg and 10 kg weights between MIKES and three FINAS accredited calibration laboratories
 MITTATEKNIIKAN KESKUS CENTRE FOR METROLOGY AND ACCREDITATION Julkaisu J3/2000 MASS COMPARISON M3 Comparison of 1 kg and 10 kg weights between MIKES and three FINAS accredited calibration laboratories Kari
A new model of regional development work in habilitation of children - Good habilitation in functional networks
 A new model of regional development work in habilitation of children - Good habilitation in functional networks Salla Sipari, PhD, Principal Lecturer Helena Launiainen, M.Ed, Manager Helsinki Metropolia
Työsuojelurahaston Tutkimus tutuksi - PalveluPulssi 11.3.2016. Peter Michelsson Wallstreet Asset Management Oy
 Työsuojelurahaston Tutkimus tutuksi - PalveluPulssi 11.3.2016 Peter Michelsson Wallstreet Asset Management Oy Wallstreet lyhyesti Perustettu vuonna 2006, SiPa toimilupa myönnetty 3/2014 Täysin kotimainen,
FinFamily PostgreSQL installation ( ) FinFamily PostgreSQL
 FinFamily PostgreSQL") FinFamily PostgreSQL 1 Sisällys / Contents FinFamily PostgreSQL... 1 1. Asenna PostgreSQL tietokanta / Install PostgreSQL database... 3 1.1. PostgreSQL tietokannasta / About the PostgreSQL database...
FinFamily PostgreSQL 1 Sisällys / Contents FinFamily PostgreSQL... 1 1. Asenna PostgreSQL tietokanta / Install PostgreSQL database... 3 1.1. PostgreSQL tietokannasta / About the PostgreSQL database...
Tampere-Pirkkala airport Survey on noise
 Tampere-Pirkkala airport Survey on noise Satu Routama Presentation in N-ALM/Copenhagen May 206, Mikko Viinikainen Tampere-Pirkkala airport In 204 400 000 pax (4th biggest in Finland) 5 000 ops (3rd biggest
S Sähkön jakelu ja markkinat S Electricity Distribution and Markets
 S-18.3153 Sähkön jakelu ja markkinat S-18.3154 Electricity Distribution and Markets Voltage Sag 1) Kolmivaiheinen vastukseton oikosulku tapahtuu 20 kv lähdöllä etäisyydellä 1 km, 3 km, 5 km, 8 km, 10 km
Hankkeen toiminnot työsuunnitelman laatiminen
 Hankkeen toiminnot työsuunnitelman laatiminen Hanketyöpaja LLP-ohjelman keskitettyjä hankkeita (Leonardo & Poikittaisohjelma) valmisteleville11.11.2011 Työsuunnitelma Vastaa kysymykseen mitä projektissa
Supplies
 Supplies - 239236-2018 05/06/2018 S105 - - Supplies - Contract notice - Open procedure I. II. III. IV. VI. Finland-Seinäjoki: Wheelchairs 2018/S 105-239236 Contract notice Supplies Directive 2014/24/EU
Windows Phone. Module Descriptions. Opiframe Oy puh. +358 44 7220800 eero.huusko@opiframe.com. 02600 Espoo
 Windows Phone Module Descriptions Mikä on RekryKoulutus? Harvassa ovat ne työnantajat, jotka löytävät juuri heidän alansa hallitsevat ammatti-ihmiset valmiina. Fiksuinta on tunnustaa tosiasiat ja hankkia
Supplies
 Supplies - 239150-2018 05/06/2018 S105 - - Supplies - Contract notice - Open procedure I. II. III. IV. VI. Finland-Oulu: Medical equipments 2018/S 105-239150 Contract notice Supplies Directive 2014/24/EU
Choose Finland-Helsinki Valitse Finland-Helsinki
 Write down the Temporary Application ID. If you do not manage to complete the form you can continue where you stopped with this ID no. Muista Temporary Application ID. Jos et onnistu täyttää lomake loppuun