Results of Monitoring at Olkiluoto in 2017 Environment
|
|
|
- Aurora Tarja Lehtonen
- 6 vuotta sitten
- Katselukertoja:
Transkriptio
1 Working Report Results of Monitoring at Olkiluoto in 2017 Environment Tiina Sojakka, Kirsi Weckman, Taavet Lipping Fiia Haavisto, Antti Rinne August 2019 POSIVA OY Olkiluoto FI EURAJOKI, FINLAND Phone (02) (nat.), ( ) (int.) Fax (02) (nat.), ( ) (int.)
2
3 Working Report Results of Monitoring at Olkiluoto in 2017 Environment Tiina Sojakka Posiva Oy Kirsi Weckman Teollisuuden Voima Oyj Taavet Lipping Tampere University of Technology Fiia Haavisto, Antti Rinne FM Meri&Erä August 2019 ONKALO is a registered trademark of Posiva Oy Working Reports contain information on work in progress or pending completion.
4
5 RESULTS OF MONITORING AT OLKILUOTO IN 2017 ENVIRONMENT ABSTRACT In 2003, Posiva Oy presented a programme for monitoring at Olkiluoto during construction and operation of ONKALO. In 2012 the monitoring programme was updated to concern the years In 2016 the monitoring programme was updated again to concern years The need to the update the programme came from the timing of the data-lock in safety case for operating license application. The surface environment monitoring programme has been producing initial data for the biosphere modelling. Because the data-lock for the biosphere modelling for safety case was set in the end of 2016, could the production of data needed in the biosphere modelling be ceased by the end of The current surface environment monitoring programme is focusing on the traditional environmental impacts of contruction and operation works of the final disposal project. Part of the monitoring is performed by the company running the nuclear power plants on the island, Teollisuuden Voima Oy. This Working Report presents the main results of Posiva s environmental monitoring programme on Olkiluoto Island in Results are presented under three topics: 1. Interaction between surface environment and groundwater in bedrock, 2. Environmental impact and 3. Baseline of monitoring of radioactive releases. Interaction between surface environment and groundwater in bedrock included e.g. weather and surface water monitoring data. During 2017 the land use of Olkiluoto was monitored by taking aerial photographies of the area. From the aerial images the increase of industrial areas and growth of new forest on shore-area can be observed. In the monitoring of surface runoff no events deviating from previous years were observed. The sulphate level in the ditch running south of ONKALO-site remains clearly higher than in other monitored ditches. Environmental impact monitoring included e.g. monitoring of noise, effluent waters, nearby freshwater systems and private drilled wells. Noise monitoring in the vicinity of ONKALO showed that in the case of raised noise levels the main source is the traffic on the Olkiluodontie road. In the monitoring of the outlet waters of ONKALO the action limit set for ph (9.5) was not exceeded in 2017 and the action limit set for suspended solids (50 mg/l) in the rock piling area drainage waters was not exceeded either. During 2017 the nitrate levels in the outlet ditch remained higher compared to background levels. The origin of the nitrate is the explosives used in underground mining work. The sulphate levels of outlet waters remains in the same level than in previous year. High suspended solid value were observed occasionally in the sedimentation pool but not in the outlet waters. The water quality of the monitored private wells is poor or good depended on the well in case. Water quality is affected by the natural properties of the area. Water levels and water qualities of the drilled wells are not affected by the construction of ONKALO. In 2017, Posiva s environmental radioactivity baseline study had not yet been started, but the results of radiological monitoring of the environment of TVO s nuclear facilities are presented in Chapter 5 as background information for Posiva's study. Keywords: environmental monitoring, ecosystem, baseline condition, change.
6
7 YMPÄRISTÖN MONITOROINTIOHJELMA OLKILUODOSSA VUONNA 2017 TIIVISTELMÄ Vuonna 2003 Posiva Oy esitti Olkiluodon ympäristön monitorointiohjelman ONKALO:n rakentamisen ja käytön ajalle. Ohjelma päivitettiin vuonna 2012 koskemaan vuosia Pintaympäristön monitoroinnin ohjelma päivitettiin vuonna 2016 uudestaan vuosille Syy päivitykseen oli turvallisuusperustelun biosfäärimallinnuksen datalukituksen ajankohta. Pintaympäristön monitorointiohjelma on tuottanut lähtöaineistoa biosfäärimallinnukselle, mutta koska datalukituksen ajankohta oli asetettu vuoden 2016 loppuun, ei uutta aineistoa ei oteta enää mukaan ja useiden tutkimusten teettäminen saatettiin lopettaa toistaiseksi. Nykyinen monitorointiohjelma keskittyy erityisesti loppusijoitustyömaan ympäristövaikutuksiin. Osa monitoroinnin tuloksista saadaan Teollisuuden Voima Oy:n ohjelmasta. Tämä työraportti esittää päätulokset Posivan ympäristönmonitoroinnin tuloksista vuonna Tulokset on jaettu kolmen otsakkeen alle: 1 Yhteydet pintaympäristön sekä kalliopohjaveden välillä., 2. Vaikutukset ympäristöön. sekä 3. Perustila radioaktiivisten päästöjen monitoroinnin pohjaksi. Pintaympäristön sekä kalliopohjaveden välisistä yhteyksistä kertovat esim. sään ja pintavesien seurannan rekisterit. Vuoden 2017 aikana Olkiluodon alueen maankäyttöä seurattiin ilmakuvaamalla alue ja tekemällä tulkinta alueen maankäytöstä. Ilmakuvista voidaan havaita teolliseen käyttöön tarkoitetun alueen kasvua ja uuden metsän muodostumista ranta-alueille. Pintavalunnan seurannassa ei havaittu edellisistä vuosista poikkeavia tapahtumia. Sulfaattipitoisuus Onkalo-alueen eteläpuolella virtaavassa ojassa on edelleen selkeästi korkeampi kuin muissa seurattavissa ojissa. Ympäristövaikutusten tutkimusohjelmassa oli mm. melun, vesipäästöjen, läheisten vesistöjen sekä yksityisten porakaivojen seurantaa. Liikenne nostattaa lähialueidensa melutasoja ja ONKALO:n työmaalta kuuluu satunnaisesti voimakkaita ääniä. ONKALO:n poistovesissä ei vuonna 2017 ylitetty seurantaohjelmassa asetettua ph:n toimenpiderajaa (9.5) eikä läjitysalueen valumavesissä ylitetty kiintoainekselle asetettua 50 mg/l toimenpiderajaa. Onkalon poistovesiojan nitraattipitoisuudet pysyivät taustaarvoihin verrattuna korkealla tasolla vuoden 2017 aikana. Poistoveden nitraatti on peräisin maanalaisten tilojen louhinnan räjäystysaineista. Poistoveden sulfaattipitoisuus pysyi viime vuoden tasossa. Poistoveden selkeytysaltaan näytteissä havaittiin ajoittain korkeita kiintoainespitoisuuksia, mutta poistovesiojassa kiintoainespitoisuudet olivat alhaisia. Louheen läjitysalueen näytteissä ei havaittu edellisistä vuosista poikkeavia arvoja. Yksityisten kaivojen vesi on hyvä- tai huonolaatuista riippuen kaivosta. Veden laatuun vaikuttavat alueen luonnolliset syyt. ONKALO:n rakennustyöt eivät ole vaikuttaneet niiden vedenlaatuun tai pinnankorkeuksiin. Posivan ympäristön radioaktiivisuuden perustilaselvitys ei alkanut vuoden 2017 aikana, joten kappalessa 5 esitellään TVO:n ympäristön säteilyvalvonnan näytteiden tuloksia Olkiluodosta taustatiedoksi Posivan perustilaselvitystä varten. Avainsanat: ympäristön seuranta, ekosysteemi, perustilanne, muutos.
8
9 1 TABLE OF CONTENTS ABSTRACT TIIVISTELMÄ 1 INTRODUCTION MONITORING SYSTEM AND SCHEDULE RESULTS I: INTERACTION BETWEEN SURFACE ENVIRONMENT AND GROUNDWATER IN BEDROCK LANDSCAPE PROPERTIES AND LAND USE METEOROLOGY Description of the monitoring system Weather conditions Surface runoff RESULTS II: ENVIRONMENTAL IMPACT NOISE EFFLUENT WATER Water quality of surface runoff (automated measuring weirs) Outlet waters of ONKALO site Drainage water from rock heaps LIMNIC SYSTEMS Description of the monitoring system Chemical analyses of Korvensuo fresh-water reservoir and the River Eurajoki Water quality and discharges of the River Eurajoki (and Eurajoensalmi Bay) MARINE/BRACKISH ECOSYSTEMS Description of the monitoring system Fishery monitoring results FLORA AND FAUNA Situation in general Liiklanperä Natura 2000/Old forest conservation area Terrestrial animals PRIVATE DRILLED WELLS RESULTS III: BASELINE OF MONITORING OF RADIOACTIVE RELEASES SUMMARY...65 REFERENCES...67 APPENDIX A. LIST OF CHANGES IN SURFACE ENVIRONMENT MONITORING PROGRAMME...75 APPENDIX B. LIST OF MONITORING LOCATIONS...85 APPENDIX C. RESULTS OF THE MONITORING OF LIMNIC SYSTEMS IN APPENDIX D. RESULTS OF THE HYDROGEOCHEMICAL CHARACTERIZATION OF SEAWATER...99 APPENDIX E. REMOTE SENSING DATA ACQUIRED FOR MONITORING & RESEARCH PURPOSES
10 2 APPENDIX F. WEATHER MONITORING RESULTS IN APPENDIX G. CHEMICAL ANALYSES OF SURFACE WATERS IN APPENDIX H. CHEMICAL ANALYSES OF PRIVATE DRILLED WELLS IN APPENDIX I. RESULTS OF RADIONUCLIDE MONITORING IN APPENDIX K. CHANGES IN LAND USE
11 3 1 INTRODUCTION In July 2004, Posiva Oy began to construct an underground rock characterisation facility called ONKALO at the island of Olkiluoto, located in the municipality of Eurajoki, Finland (Figure 1-1). In February 2012, excavation of the ONKALO access tunnel reached 455 m b.s.l., which is the deepest location as per the existing plans. During 2012 the main emphasis also shifted from excavation to building and structural work. Since 2013 the emphasis remained on building and structural works, both underground and above ground. During 2016 aboveground works started on encapsulation plant. The construction of ONKALO and subsequently the construction of the repository for spent nuclear fuel will affect the surrounding rock mass and the groundwater flow system as well as the environment. In December 2003, a programme for monitoring at Olkiluoto during construction and operation of ONKALO was presented (Posiva 2003b). In 2012 the monitoring programme was updated to concern the years (Posiva 2013a). In 2016 the monitoring programme was updated again to concern years Changes concerning the environmental monitoring programme are presented in internal memo (POS ) and are presented in this report in Chapter 2. A summary of the observations and measurements is reported annually for each discipline: rock mechanics, hydrology, hydrogeochemistry, environment, and, since 2012, engineered barrier system. Previously monitoring of foreign material was also one of the disciplines, but since 2016 it has been implemented as a separate work to be done in connection with the construction activities. The environmental measurements and observations carried out in 2017 are presented here. The results are divided into following three parts, according to the arrangement of the updated (in 2016) monitoring programme: Interaction between surface environment and groundwater in bedrock Environmental impact Baseline of monitoring of radioactive releases Naturally, the data presented in the various parts partly overlap. Extent of presented results and tables varies according to the type of original material: data presented in memos is generally presented in more detail than those presented in easily obtainable Posiva Working Reports. Major points of the monitoring design as well as maps of monitoring locations are presented at the beginning of each result sector. A list of monitoring locations is presented in Appendix B. Earlier results and progress of the environmental monitoring have been presented by Haapanen & 2014, Pere et al & 2017 and Sojakka et al. 2018a & 2018b. This report is based partly on the structure of the previous reports. Chapters Results I: Evolution of geosphere and Results II: Biosphere modelling input data existing in earlier reports have been removed from this report since current monitoring programme does not include studies related to these sections.tiina Sojakka (Posiva Oy) has been the main writer and editor of the report. Taavet Lipping (Tampere University of Technology) has been responsible for the weather data processing and reporting. Fiia Haavisto and Antti Rinne (FM Meri&Erä) have been responsible for interpreting the aerial images for section concerning changes in land use (Appendix K). Kirsi Weckman (Teollisuuden Voima Oy) has been responsible for analyzing the results of seawater sampling at Olkiluoto site (Appendix D). In addition
12 4 Jani Helin and Tuomas Pere (Posiva Oy) are acknowledged for having produced most of the maps used in the report. Figure 1-1. Olkiluoto site. Map data: Topographic database by the National Land Survey of Finland and Posiva Oy. Coordinate system: KKJ1. Map layout by Jani Helin / Posiva Oy.
13 5 2 MONITORING SYSTEM AND SCHEDULE The monitoring system up to year 2012 was described in Posiva Report (Posiva 2003b). Improvements to the system were done based on experiences. The aims of the monitoring have been to observe changes in the host rock and surface environment that may affect the long-term safety of final disposal of spent nuclear fuel, or the assessment of it, to obtain data on the properties of the site and the environmental impact of the project, and to obtain information on the response of the host rock to the excavation for the benefit of further planning of construction, operation, and eventual closure of the disposal facility. An updated monitoring programme was prepared to be implemented from the year 2012 until ca The programme was expanding because of new objectives for monitoring: the performance of the engineered barriers and radioacative releases into environment. The updated programme is described in Posiva Report (Posiva 2013a). Monitoring of the surface environment have served several purposes, providing data on the conventional environmental impacts of the project, changes in land use and weather conditions. It has also produced input data for biosphere modelling on the storage and transport of radionuclides in the overburden, groundwater, surface water bodies and organisms, as well as data relevant for the performance of the disposal system on the interaction between the deep groundwater and the surface environment. In 2016 monitoring programme was updated again for the years and some notable changes were made for surface environment monitoring programme (see Appendix A). The need to the update the programme came from the timing of the datalock in safety case for operating license application. The surface environment monitoring programme presented in Posiva Report has been producing initial data for the biosphere modelling. Because the data-lock for the biosphere modelling for safety case was set in the end of 2016, it was possible to cease the production of data needed in the biosphere modelling at the end of In addition, sufficient datasets has been acquired for certain studies (like studies related to infiltration of groundwater) and there is no need continues these studies at the moment. The investigations ceased in the end of 2016 include several studies implemented in the forest intensive monitoring plots, like: vegetation inventories, tree growth measurements, sampling of deposition, percolation water, litterfall and soil water for chemical analyses. Also update of game statatics and sea water sampling ended in the end of In the end of 2016 also the analyses package (Class 1) for surface waters could be changed since there was no longer need to analyse certain key elements from the samples for biosphere modelling. The updated set of analysis parameters serves interests of the environmental impact monitoring and is focused especially on those metals that could be released from the minerals of Olkiluoto bedrock to the surface waters. The updated analyses package is presented in Table 2-2. During the update in 2016, the monitoring of ONKALO-outlet waters in sedimentation pool was moved from the monitoring programme of foreign materials to the monitoring programme of surface environment. Results of the samples from sedimentation pool are presented in section 4.2 Effluent water.
14 6 The radiological baseline study of the environment was removed from the monitoring programme in the end of 2016 since it was decided that a separate project will be established for the baseline study. Annual results from the Posiva's radiological baseline study as well as annual from results of environmental radioactivity monitoring programme of Teollisuuden Voima's (TVO) nuclear power plants are to be reported in annual environmental monitoring reports. When entering the operational phase of the repository, the radioactivity monitoring will continue, as modified based on the results and experiments from the baseline period. The current surface environment monitoring programme is focusing on the traditional environmental impacts of contruction and operation works of the final disposal project. The list of all changes made to the monitoring programme during the latest update are presented in Appendix A. Because of the changes made to monitoring programme the chapters Results I: Evolution of geosphere and Results II: Biosphere modelling input data existing in earlier reports have been removed from this report. The list of changes made to the current monitoring programme is presented in Table 2-3. The monitoring programme will be updated again in the near future for the operational phase. Monitoring activities on Olkiluoto Island have been started by the company running the nuclear power plants on the island, TVO, long before the tasks carried out by Posiva Oy; some originate from the 1970 s. TVO s radionuclide sampling system is comprehensively described by Ikonen (2003) and Roivainen (2005) and TVO s marine environment monitoring system, for example, by Ikonen et al. (2003). Studies carried out by Posiva Oy before the actual Olkiluoto Monitoring Programme have been summarised in the Baseline Condition Report (Posiva 2003a); these aimed mainly at fulfilling the requirements of the environmental impact assessment process towards the end of the 1990s.
15 7 Table 2-1. Monitoring schedule of the surface environment, The number of sampling occasions per year are presented by numbers and continuous (hourly weekly) monitoring by shaded cells (S, summer season; W, winter season). X denotes a single campaign in the year. TVO = monitoring carried out by Teollisuuden Voima Oy Input data for modelling Aquatic ecosystems Sea water quality Hydrogeochemical characterisation 1989 X started Background data on water quality 1972 TVO TVO TVO River discharge and water quality Water quality monitoring 1977 TVO TVO TVO River discharge by environ. authorities 1969 Background data 1975 TVO TVO TVO Bottom fauna background data 1973 TVO TVO TVO Test and account fishing, interviews 1975 TVO TVO TVO Interaction between surface environment and groundwater in bedrock Aerial photographs 1946 X X Records of changes in infrastructure and other land use 2004 X X X Update of land use grid 2004 X Records of forest and aquatic management 2009 X X X Surface water discharge (automated weirs) 2008 Weather observations 1993 Precipitation 2003 Snow cover 1991 W W W Ground frost 2001 W W W Environmental impact Noise late 90's Effluent water Online-measurements of surface runoff 2008 Water quality of drainage water (weirs) ONKALO outlet waters, ditch (Class 1) ONKALO outlet waters, Ditch 2004 ONKALO process water (Sedimentation pool) (Class A) ONKALO process water (Sedimentation pool) 2005 Leaching from rock spoil Fishing conditions 1975 TVO TVO TVO Household water quality in drilled wells Household water yield in drilled wells
16 8 Table 2-2. Classification of chemical and physical parameters in the surface environment monitoring programme. Part 1. Class 1 (surface, rain and ground water) Key elements Carbon speciation Hydrogeochemistry Class 2 (soil and sediment ) Class 3 (terrestrial vegetation) Class 4 (terrestrial fauna) Class 5 (sea, lake and river water) Class 6 (aquatic vegetation) Ag Ag Ag Ag Ag Ag Class 7 (aquatic fauna) Be Be Be Be Be Be C tot C tot C tot 3 C tot C tot C tot Cl Cl Cl Cl Cl Cl Cl Cs Cs Cs Cs Cs Cs I I I I I I Mo Mo Mo Mo Mo Mo Nb Nb Nb Nb Nb Nb Ni Ni Ni Ni Ni Ni Ni Pb Pb Pb Pb Pb Pb Pb Pd Pd Pd Pd Pd Pd Ru Ru Ru Ru Ru Ru Sb Sb Sb Sb Sb Sb Se Se Se Se Se Se Sn Sn Sn Sn Sn Sn Sr Sr Sr Sr Sr Sr Th Th Th Th Th Th U U U U U U U Y Y Y Y Y Y DIC DIC DIC DOC/ NPOC DOC DOC TIC TOC Alkalinity EC EC ph ph ph Sodium fluorecein 2 NH 4 NO 3 NO 3 PO 4 PO 4 SO 4 SO 4
17 9 Part 2. Class 1 (surface, rain and ground water) Auxiliary parameters Suspended matter Class 2 (soil and sediment) Dry matter Class 3 (terrestrial vegetation) Dry matter Class 4 (terrestri al fauna) Dry matter Class 5 (sea, lake and river water) Suspended matter Class 6 (aquatic vegetation) Dry matter Class 7 (aquatic fauna) Bulk density Grain size LOI Al Al Al Al B B B Ca Ca Ca Ca Ca Ca Ca Cd Cd Cd Cd Cd Cu Cu Cu Cu Cu Cu Cu Fe Fe Fe Fe K K K K K K K Mg Mg Mg Mg Mg Mg Mg Mn Mn Mn Mn Mn Mn Mn N tot N tot N tot N tot N tot N tot Na Na Na Na Na Na Na P tot P tot P tot P tot P tot P tot S S S S S S Si Zn Zn Zn Zn Zn Zn Zn 1 These elements are analysed several times per year from selected samples of wet deposition, soil solution and the ditch (measuring weir OL-MP4) running from ONKALO site to the southern side of Olkiluoto Island and collecting the runoff from the three forest intensive plots not having direct runoff to the sea 2 Sodium florecein analysis for ONKALO outlet ditch (code OL-DI1) only 3 The total C is calculated as DIC+DOC+TIC+TOC Dry matter
18 10 Table 2-3. Deviations from the current monitoring programme Activity Type of change Reason Household water quality in drilled wells In the programme it was stated that radon will be analysed from the water samples but in 2017 no radon analyses were implemented. Due to human error Household water yield in drilled wells Analysis of ditch waters Water surface level measurements have been used as a number to estimate household water yield in drilled wells. Based on the programme, the measurements should be done 4 times a year, the amount of measurements in a year has however varied from 1 to 3 in practice, depending on the well. The annual sample amounts have not always been the same as described in Posiva for all observation points. Practical reasons Practical reasons Environmental noise measurements In the programme it was stated that noise measurements will be done twice a year but during 2017 measurements were done only once. Due to human error
19 11 3 RESULTS I: INTERACTION BETWEEN SURFACE ENVIRONMENT AND GROUNDWATER IN BEDROCK 3.1 Landscape properties and land use The landscape of Olkiluoto Island has been under rapid changes during the time of Posiva s environmental monitoring programme (Table 3-1). The changes are partially related to power production and partially to nuclear waste disposal: in addition to Posiva s activities, construction of the third nuclear power plant on Olkiluoto (OL3) started in 2003, with corresponding infrastructure. Landscape properties can be monitored through maps and remotely sensed data. Topographic database by the National Land Survey of Finland has been added into Posiva s GIS database. Earlier, the database was updated at 5 10 year intervals, and changes in between were digitized manually based on aerial photographs. Nowadays, the database is freely available at the open data file download service of the National Land Survey of Finland. A summary of all remotely sensed data acquired by Posiva until 2017 with key properties listed is presented in Appendix E. Remote sensing data analysis of material collected from Olkiluoto and so called reference areas are presented in Working Report (Kumpumäki et al. 2018). The lastest regular aerial RGB and CIR orthoimages were taken from the Olkiluoto area in The images were taken in July to catch the full biomass of vegetation. A land use interpretation for the time period is presented in Appendix K.
20 12 Table 3-1. Construction activities since 2003 on Olkiluoto Island. A register of activities is maintained as Posiva document POS Infrastructure Construction time ONKALO area 2003 OL Rock piling and crushing area (OL3+ONKALO) 2004 Main road (reparation, paving) Wind generator 2004 Gas turbine reserve power plant Main power lines Roads, pipelines, parking areas etc New gatehouse and extension to main office New visitor centre Accommodation village Concrete station Laboratory extension New boat landing stage (by parking area) Extension of accomodation village 2008 New dumping place 2007 Gas turbine safety pool by the main gate 2007 Training simulator 2007 Dockyard extension 2008 An area of approx. 2 ha cleared for storage (north of the concrete station) 2009 Extension of ONKALO area and building of new warehouses 2009 Alignments for the road and pedestrian/bicycle way to ONKALO Construction of ventilation building in the ONKALO area Warehouse for explosives north of ONKALO 2010 District heating pipe from power plant area to visitor centre and ONKALO area 2010 Eastern extension of rock piling area 2011 Water conduit to the dockyard 2012 Clearing of the ditch running north from ONKALO 2012 Excavation and construction work of the basis for the hoist building Clearing of ditches in the vicinity of the measuring weirs 2013 Extension of the ONKALO-project office Construction of a testing hall in the ONKALO area Road- and parking area construction in the western part of the ONKALO site Construction of a logistics center Enbankment road build between Olkiluoto and Kuusisenmaa-island 2015 Works started in encapsulation plant (removal of vegetation and surface soil, start of excavations to prepare the ground for the encapsulation plant) Excavations continued on the encapsulation plant site 2017 Transferring of drillcore sample storage 2017 Building a new parking place next to logistics center 2017 Works started for building a new switchyard for OL The vegetation and forest inventories by homogeneous polygons in 2002 and 2003 describe the vegetated landscape at those time points (Miettinen & Haapanen 2002, Rautio et al. 2004). A register of silvicultural activities carried out in these polygons is maintained and was presented for the first time concerning felling year 2009/10 (Haapanen 2010; a felling year is a period of 12 months, starting in the beginning of July and ending in the end of June). During the felling year 2012/13, an area of ca. 15 ha was thinned/clear-cut in Tyrniemi. In 2015 some clear-cutting was done in Ilavainen area and in 2017 in the north side of TVO's accommodation village.
21 13 The monitoring of forests and mires on the island is based on a systematic grid with a density of 1 plot/ha, called OL-FET. The first rounds of measurements on OL-FET grid in 2004 and its subset in 2005 provide a statistical basis for the monitoring of forested parts of the landscape (Saramäki & Korhonen 2005, Huhta & Korpela 2006, Tamminen et al. 2007). A new control inventory done using a sparser version of the grid took place in 2014 (Korhonen et al. 2016). To estimate the extent of all current land-use types, the OL-FET network was extended to cover all land-use/land-cover classes and intermediate plots were added between the plots to create a m grid. The land-use/land-cover of each plot was visually interpreted from the aerial photographs taken between 1946 and 2007 (Haapanen 2009). After this land-use statistics has been updated in 2013 (Pere et al. 2015) and 2017 (this report, Appendix K). The latest land-use statistics were updated by using the aerial photographs taken in 1946, 1957, 1974, 1987, 1995, 2002, 2007, 2009, 2013, 2015 & 2017.
22 Meteorology Description of the monitoring system The information on weather and climate conditions gives boundary conditions to the hydrogeological and hydrogeochemical modelling of the site and provides background information for the modelling of radionuclide transport in the biosphere regarding postclosure safety assessments. Typical conditions of temperature, precipitation and humidity can be seen as especially important background information. Meteorological observations are mandatory for a nuclear power plant, thus a comprehensive database of major meteorological parameters is available from a weather mast OL-WOM1 (Figure 3-1). Until 2016 meteorological measurements were also made on four weather stations (OL-WOM2-5) locating on the forest intensive monitoring plots (OL-FIP) in Olkiluoto. When the forest investigations on OL-FIP's ceased also the weather measurements were discontinued in all plots except in weather mast OL-WOM2. From the OL-WOM2 meteorological measurements are recorded once an hour. The parameters are: air temperature, minimum and maximum temperature inside the crown layer and above the canopy relative humidity, precipitation (1 m above ground level), soil moisture content, soil temperature, photosynthetically active radiation (PAR), solar radiation, air pressure, wind speed and its direction. During 2017 the temperature sensor at the height of 2 meters as well as the soil temperature sensor at the depth of 10 cm were not functioning and because of this some meteorological values could not be calculated. Figure 3-1. Locations of Olkiluoto weather stations OL-WOM1 5. Measurements on weather stations OL-WOM3-5 ceased by the end of Map data: Topographic database by the National Land Survey of Finland and Posiva Oy. Coordinate system: KKJ1. Map layout Tuomas Pere/Posiva Oy.
, and on Olkiluodonjärvi (1 ground frost point) (Figure 3-2).")

23 15 Depth of ground frost and the thickness of the snow cover are measured manually on former forest intensive monitoring plot, OL-FIP4 (2 ground frost measuring points), on a snow monitoring transect OL-LL2 (20 snow and 7 ground frost measuring points), and on Olkiluodonjärvi (1 ground frost point) (Figure 3-2). Ground frost measurements on Liiklansuo mire were ceased in 2013 when construction works on the area destroyed the measuring tube (tube no. 8). On OL-FIP4, an automatic snow depth measuring station was tested during springs 2011 and Based on the results, measuring station seemed to work properly but so far a permanent installation of such a station has not taken place. Since 2007, measurements, analyses and results of meteorological monitoring have been presented in this report (Haapanen & 2014, Pere et al & 2017, Sojakka et al. 2018a & b). Earlier data have been reported by Ikonen (2002, 2005, 2007a). Figure 3-2. Locations of snow monitoring transect and ground frost measurement points in Olkiluoto Map data: Topographic database by the National Land Survey of Finland and Posiva Oy. Coordinate system: KKJ1. Map layout Tuomas Pere & Tiina Sojakka/Posiva Oy.


24 Weather conditions Annual means of key meteorological parameters are given in Table 3-2, along with reference data from nearby locations Kuuskajaskari Island and Pori airport. Monthly mean and extreme temperatures and monthly total precipitation at Olkiluoto for the period of are shown in Figure 3-3. Long-term monthly temperature and precipitation statistics at Olkiluoto station OL-WOM1 are presented in Table 3-3. Annual growth conditions at Olkiluoto in based on the data of stations OL-WOM1 2 are presented in Tables 3-4 to 3-5. Examples of data recorded by the automated weather masts are given in Figures 3-4 to 3-7. Detailed weather monitoring results are presented in Appendix F Figure 3-3. Monthly mean and extreme temperatures (left) and monthly total precipitation (right) at Olkiluoto for the period of The black lines represent the monthly mean temperature and total precipitation in 2017, dashed black the month s lowest and highest temperature in 2017, gray line the long-term monthly mean, purple lines the long-term mean low/high, the blue lines long-term low/high, the bars lowest and highest monthly precipitation recorded and the green section in the bars the long-term monthly mean precipitation.
25 17 Table 3-2. Long-term average temperature, annual precipitation and average wind speed at Olkiluoto station OL-WOM1 ( ), at Kuuskajaskari Island 13 km SSW ( )(Drebs et al. 2002) and at Pori Airport 30 km NE ( ) (Pirinen et al. 2012). The station on Kuuskajaskari Island has not been in use since Olkiluoto, OL-WOM1 Kuuskajaskari Pori Airport Climate class Dsc(lk)/DC(lk) Dfb(lo)/DC(lo) 2 Dfc(lo)/DC(lo) 2 (Køppen/Trewartha classification 1 ) subarctic 3 / temperate continental; mild summer and cool winter humid continental 4 / temperate continental; mild summer and cold winter subarctic 3 / temperate continental; mild summer and cold winter Average temperature, C coldest month 3.9 (Feb) 5.0 (Feb) 5.4 (Feb) - warmest month 17.3 (Jul) 15.9 (Jul) 16.8 (Jul) Extreme temperature, C - lowest observed 27.2 (Jan 99) 33.0 (Dec 78) 34.5 (Jan 87) - highest observed 32.6 (Jul 10) 31.3 (Jul 99) 33.3 (Jul 10) Average number of - heat-wave days ice days frost days cold days Annual precipitation, mm (avg) Max. monthly precip 163 (Oct 12) 149 (Aug 87) 157 (Oct 06) Min. monthly precip. 0.0 (Feb 94, Dec (Jul 94) 0.4 (Jul 94), Jan 12) Max. daily precipitation 60 (Jul 11) Precipitation days (avg.) 0.1 mm mm mm Avg. relative humidity, % Prevailing wind direction SW 9 SE S SW SE Average wind speed, m/s Marked as Kvv(nn)/KQ(nn) were Kvv is the three-letter code of the Køppen system, KQ is the Trewartha class, and nn describes the temperature during the summer and winter months. 2 Based on statistics given in (Drebs et al. 2002) omitting some detailed values; instead more averaged input values are used in classification and the climate classes for the reference sites are to be considered only illustrative. 3 Severe winter, no dry season, cool summer 4 Humid continental: humid with severe winter, no dry season, warm summer 5 Daily maximum temperature > 25 C 6 Daily maximum temperature < 0 C 7 Daily minimum temperature < 0 C 8 Daily minimum temperature < 10 C 9 Measured from 100 m from the ground. Wind speed measured from 20 m. Measurement height for Kuuskajaskari and Pori Airport is unknown. 10 The yearly values have been calculated taking into account all yearly values in this time period. Data integrity for these years have been over 95% with the following exceptions: Temperature: 2009 (92.65%); Precipitation: 2004 (90.88%), 2010 (87.68%), 2011 (90.50%), 2012 (80.33%), 2013 (88.68%); Relative humidity: 2012 (87.40%), 2013 (74.92%), 2014 (88.56%), 2015 (91.51%), 2016 (93.37%), 2017 (91.63%).
26 18 Table 3-3. Long-term monthly temperature and precipitation statistics at OL-WOM1 ( ). Mean minimum/maximum is the typical variation as the mean of the monthly minimum/maximum values. Extreme minimum/maximum is the largest variation within each month during the period. Monthly temperature ( C) Monthly precipit. sum (mm) Mean Mean Mean Extr. Extr. min. max. min. max. Mean Min. Max. January February March April a May June July August September October November December a Data integrity for the date of measurement for April s extreme maximum temperature (30 Apr 2008) was 79.17%. The next maximum with over 95% data integrity was 23.4 C on 19 Apr 1998.
27 19 Table 3-4. Annual growth conditions at Olkiluoto in based on the data of station OL-WOM1 (influenced by its coastline position). Year Beginning date Ending date Duration (days) Sum of effective temperature (ºCd) Precipitation sum of season (mm) 1992 a 27 Apr 9 Oct a 23 Apr 13 Oct Apr 15 Oct May 30 Oct May 7 Nov May 11 Oct Apr 27 Oct b 14 May 13 Nov c 17 Apr 25 Oct Apr 4 Nov Apr 3 Oct May 18 Oct Apr 15 Nov d 27 Apr 22 Oct Apr 9 Oct e 24 Apr 9 Nov Apr 28 Oct h g 24 Apr 10 Oct 169 g May 20 Oct May 18 Nov Apr 24 Oct May 19 Nov Apr 19 Oct Apr 5 Oct Apr 9 Oct May 20 Oct Mean 28 Apr 24 Oct Minimum 15 Apr 3 Oct Maximum 14 May 19 Nov FMI avg. f Apr Oct a For 1992 and 1993, daily precipitation values of 8 and 2 days are missing, respectively, and not accounted for in here. b Growth period started first time already 18 Apr, but ended 10 days later; starting from 18 Apr the length would be 209 d, the temperature sum 1551 Cd and the precipitation sum 255 mm c Ending to a period of just 5 days <5 C; that ignored, the end date would be 14 Dec, the length 241 d, the temperature sum 1458 Cd, and the precipitation sum 465 mm d Ending to a period of just 6 days <5 C; that ignored, the end date would be 15 Nov, the length 202 d, the temperature sum 1521 Cd, and precipitation sum 472 mm e There was a 5-day period meeting the criteria for thermal growth season in April, one week before the on-set of the longer period starting with 3 and 2 days of regression, separated by one warmer day, during the first two weeks f For , estimated regional value (Kersalo, J. & Pirinen, P Suomen maakuntien ilmasto (in Finnish: The climate of Finnish regions) g The temperature data from 28 days in Sep 09 is missing, and thus the sum of effective temperature has not been calculated. h The annual report of 2011 presents an erroneous value, which has been corrected here.
28 20 Table 3-5. Annual growth conditions at Olkiluoto in based on the data of station OL-WOM2 (Scots pine forest). Year Beginning date Ending date Duration (days) Sum of effective temperature (ºCd) Precipitation sum of season (mm) a Apr 22 Oct Apr 27 Oct May 6 Nov c 25 Apr 28 Oct Apr 10 Oct May 14 Oct May 18 Nov May 24 Oct May 19 Nov May 19 Oct Apr 24 Apr -- d -- e -- d -- e -- d -- e -- d -- e f -- f -- f -- f -- f Mean 1 May 28 Oct Minimum 24 Apr 10 Oct Maximum 10 May 19 Nov FMI avg. b Apr Oct a precipitation under the forest canopy b For , estimated regional value (Kersalo, J. & Pirinen, P Suomen maakuntien ilmasto (in Finnish: The climate of Finnish regions) c The annual report of 2011 presents an erroneous value, which has been corrected here. d Data from 2015 has a gap from 5 Sep to 20 Nov. These values will not be used in calculating means or searching for minimums or maximums. e Temperature data from 2016 has a gap from 29 Sep to 6 Oct, cutting the growth season short. Only the beginning date is reliable, other values will not be presented. f Temperature data at 2 m is missing for the whole year 2017, so the growth season can not be calculated. Counted according to the temperature at 9 m inside canopy the growth period would have lasted for 156 days, from 17 May to 19 Oct with a sum of effective temperature of 1101 and a precipitation sum of 39.
29 21 Figure 3-4. Examples of data from meteorological measurements on OL-WOM2: temperature at 9 m and PAR at 24 m. Daily averages between January 1, 2006 and December 31, The lowering trend in the maximum PAR before 2013 was due to the fact that the sensors need to be calibrated at 2 3 year intervals. New sensors were installed in November Data is missing from 5. September to 20. November in 2015 and is marked here as zeroes.
30 22 Figure 3-5. Examples of data from meteorological measurements on OL-WOM1 5: relative humidity at 2 m, %. Monthly averages between January 2008 and December 2017 (OL-WOM5 from November 2009 on). Gaps in the data are due to low data integrity. Between March and August of 2014 data integrity regarding measurements of relative humidity drops below 95% for data from all observation masts. OL-WOM3 5 stations are not in use after year 2016.
31 23 Figure 3-6. Examples of data from meteorological measurements on OL-WOM1 5: temperature at 2 m, C. Monthly averages between January 2008 and December 2017 (OL-WOM5 from November 2009 on). Gaps in the data are due to low data integrity. OLWOM3 5 stations are not in use after year All data from OLWOM2 for temperature at 2 m is missing for the year 2017 and has been replaced with temperature data at 9 m inside canopy.
32 24 Figure 3-7. Examples of data from meteorological measurements on OL-WOM2: ground temperature at depths of 10, 50 and 90 cm, C. Monthly averages between September 1, 2004 and December 31, Data is missing from all sensors of OL-WOM2 between 5. September and 20. November in Data is missing from sensor -10 cm for the whole year 2017.
33 Surface runoff Monitoring of surface runoff produces data for surface hydrology modelling and environmental impact monitoring. Earlier, runoff was measured manually, but automated measuring weirs (Figure 3-9) have produced data as of the following dates: OL-MP1 3 April 26, 2008, and OL-MP4 April 28, Measurements in the OL-MP3 were ceased in and these measurements were replaced by installing a new measuring weir (OL-MP5) at the same day in the downstream of ONKALO outlet ditch. The weirs are maintained and data provided by EHP Environment Oy. Measured parameters include water level, discharge, conductivity, temperature and ph. In Posiva s monitoring programme (Posiva 2013a), element analyses at the weirs are to be done according to Class 1 (also called Suite 1 in earlier reports). The first samplings of this new type (plan POS ) took place in Class 1 for surface waters was updated in the end of 2016 (see Table 2-2 & Chapter 2) and samples are taken according working guideline POS In 2017 the analyses were carried out by TVO s Laboratory and ALS Scandinavia AB. The results of chemical analyses of surface waters in 2016 are presented in Appendix G. Locations of the automatic measuring weirs are shown in Figure 3-8. By analyzing the long-term sulphate concentrations in general surface runoff at the weirs located in the monitored ditches in the central part of the Olkiluoto island, it was observed that a 2-4 fold increase of sulphate levels in surface runoff has occurred in the fall of 2013 on the island in general. According the Bachelor's thesis by Bohm (2017) the interaction between crushed rock and water in aerobic conditions seems to be apparent reason for the observed exceptionally high sulphate levels in groundwater samples taken from near the surface and surface water samples. The high SO4-levels generally decreased during the spring of 2014 but were re-elevated during the end of During 2015 sulphate concentrations in surface waters of MP1-MP2 declined back to the level where they were before fall of 2013 and remained on this level (Figures 3-13). In samples from measuring weir OL-MP4 (located between ONKALO-area and the nature reserve) sulphate levels have fluctuated over the years, but it seems that SO4 levels are generally higher in autumn than in spring or summer (Figure 3-13). This phenomenon can be explained by the higher surface runoff in autumn when more soil materials are flushed to surface waters. During 2017 sulphate levels in all measuring weirs were slowly rising again. Sulphate concentration in OL-MP4 are clearly higher than in other measuring weirs; for instance in sample taken from OL-MP4 SO4 level was 255 mg/l and at same time in OL- MP2 31 mg/l. Between elevated nitrate concentrations were observed in the surface runoff at the weir OL-MP4. It was found that during the changing of road alignment to ONKALO, some rock material from ONKALO, containing remnants from explosives, had been left on the roadside. This is assumed to be the reason for the raised nitrate concentrations (Haapanen 2012). After this nitrate concentrations in the surface runoff have remained low (less than 10 mg/l) (Figure 3-14).
34 26 The concentrations of some the most common metals, that could be found in fresh waters, were analysed from the samples from the measuring weirs. Aluminium levels were clearly higher in measuring points OL-MP1 & -MP2 than in OL-MP4 & -5 and alternatively the chloride, strontium and sodium levels are clearly higher in measuring points OL-MP4 & -MP5 than in OL-MP1 & -2. Otherwise there were no notable differences between different ditches and no harmful amounts of metals like cadmium, nickel or lead have been found. Examples of some results are presented in Figure 3-15 and all the results are presented in Appendix G. In 2017, the measuring weirs worked reasonably well but several problems were also encountered. The dirtying of the sensors caused erroneous data. The results of ph and conductivity measurements were occasionally unreliable. The reason for this could be that measuring ranges of ph and conductivity sensors are not completely suitable for these measurements. The periods of missing or erroneous data are presented in Table 3-6 below. Monitoring results from 2017 are shown in Figures 3-10 to In situations of low water level, deviations may be caused to the produced data since the sensors are located approximately cm beneath the 0-level (the tip of the "V" of the V-shaped dam); in cases of no flow the parameters are measured in still water, and no useful results are produced.
35 27 Table 3-6. Problems in the data produced by measuring weirs OL-MP1, -MP2, -MP4 & -MP5 in Data for this table is collected from the technical operation report of the measuring weirs for the year 2017 (POS ) compiled by the data provider. OL-MP1 OL-MP2 OL-MP4 OL-MP5 General Temperature ph Conductivity Water level and discharge Short break in March due to connection problems with server. Short break in March due to connection problems with server. One month break in data transmitting in March due to broken datalogger. Short break in March due to connection problems with server. Temperature has been measured with thermistor which has not worked properly. Since October temperature has been measured with different sensor. Normal function through the whole year. Proper function through the whole year (except problems with datalogger). Proper function. Sensor has worked through the whole year but the function has not been reliable (measured values differ from buffer solution). Measurement s have not worked in the beginning of the year due to broken sensor. New sensor was installed in May. Proper function through the whole year (except problems with datalogger). Dirtying of the sensor affects to the results. Proper function. Unstable function through the whole year. No measurement s from July to September due to low discharge. Unstable function through the whole year. The measuring range of the sensor is not completely suitable for these measurement s Unstable measurement until through the whole year. Sensor was changed in October but unstable measurement continued. Proper function. Proper function through the whole year, no discharge in beginning of the year and from July to September. Proper function through the whole year, no discharge from in February and from July to September. Proper function through the whole year (except problems with datalogger). Proper function.


36 28 Figure 3-8. Locations of measuring weirs OL-MP1 MP5. OL-MP3 has not been in use since Map data: Topographic database by the National Land Survey of Finland and Posiva Oy. Coordinate system: KKJ1. Map layout by Tiina Sojakka / Posiva Oy. Figure 3-9. Measuring weir OL-MP4. Sensors and the measuring weir are located inside a cylinder shaped well. Solar panel is used for charging the accumulator. (photo: Tiina Sojakka/Posiva Oy)
37 29 Figure Measured flows (discharge) in the measuring weirs OL-MP1, -MP2, -MP4 & -MP5 in Contains all original data, periods of erroneus data listed in Table 3-6 have been removed. Figure Measured ph in the measuring weirs OL-MP1, -MP2, -MP4 & -MP5 in Contains all original data, periods of erroneus data listed in Table 3-6 have been removed.
38 30 Figure Measured conductivity (ms/m) in the measuring weirs OL-MP1, -MP2, - MP4 & -MP5 in Contains all original data, periods of erroneus data listed in Table 3-6 have been removed OL-MP1 OL-MP2 OL-MP4 OL-MP5 Sulphate (mg/l) Figure Sulphate (SO4) values measured in ditch water in the measuring weirs OL- MP1, -MP2, -MP4 & -MP5 in Measurements from OL-MP5 started in 2017.
39 31 OL-MP1 OL-MP2 OL-MP4 OL-MP Nitrate (mg/l) Figure Nitrate (NO3) values measured in ditch water in the measuring weirs OL- MP1, -MP2, -MP4 & -MP5 in Measurements from OL-MP5 started in 2017.
40 32 0,3 0,9 0,25 0,8 0,7 Cadmium (µg/l) 0,2 0,15 0, Iron (mg/l) 0,6 0,5 0,4 0, ,05 0,2 0,1 0 OL-MP1 OL-MP2 OL-MP4 OL-MP5 0 OL-MP1 OL-MP2 OL-MP4 OL-MP Nickel (µg/l) Copper (µg/l) OL-MP1 OL-MP2 OL-MP4 OL-MP5 0 OL-MP1 OL-MP2 OL-MP4 OL-MP5 0, ,2 50 Lead (µg/l) 0,15 0, Zinc (µg/l) , OL-MP1 OL-MP2 OL-MP4 OL-MP5 Figure Cadmium (Cd), iron (Fe), nickel (Ni), copper (Cu), lead (Pb) and zinc (Zn) values measured in ditch water in the measuring weirs OL-MP1, -MP2, -MP4 & -MP5 in From measuring weirs OL-MP1 & -2 two samples were taken in Lead-values that are not shown in bars were >0,01 µg/l (e.g. Pb-values for OL-MP4). 0 OL-MP1 OL-MP2 OL-MP4 OL-MP5
41 33 4 RESULTS II: ENVIRONMENTAL IMPACT 4.1 Noise Noise has been monitored once a year during the winter by TVO using direct measurements, in recent years on ten locations. Additionally, in 2005 a more comprehensive survey was performed by Insinööritoimisto Paavo Ristola Oy (on three occasions and 45 locations). Since 2011, additional noise level monitoring has also been made for Posiva in the vicinity of ONKALO two times a year. During 2017 only one noise level measurement was done instead of two due to human error. In 2017, TVO staff recorded noise on December 11. The ground was mostly free of frost and snow cover. The measuring device was CESVA model SC-160 type 2 recording digital device (Figure 4-2). LAT (continuous mean noise level) was recorded at one second intervals with a recording time of ten minutes at one spot. The power plants were operating at full power, it was however noted that this had no significant effect on the noise levels in the area (only "humming" sound can be heard from the power plants). In the vicinity of roads, traffic had significant effect on the noise levels in the environment. It was also noted that wind direction and speed affect the measurement results. During measuring day wind was blowing in gusts and sound of waves could be heard. Compared with the results of 2016, the biggest decrease in noise level (-6,0 db LAT) was observed at OL3 harbour (OL-NMP48). Reason for this measured difference is that in 2016 some machines were used next to the measuring device. Compared with the results of 2016, the biggest increase in noise level (+11,6 db LAT) was observed at monitoring point OL- NMP03 (island of Leppäkarta). This increase to noise level was caused by wind blown directly towards the measuring device. Posiva's own monitoring was carried out on one occasion (May 11) at four sites, with the same device and method. The ground was free of frost and snow cover. The noise level close to the the drill hole OL-L15, at the border of the nature conservation area (OL- NMP55) was affected by the sound of heavy traffic from the Olkiluodontie road and work done (battering sounds) at Posiva's encapsulation plant site. The noise levels at drill hole OL-L15 and at the visitor centre parking lot (OL-NMP56) have increased from the previous measurement (+11,6 db LAT in OL-NMP55 and +5,0 db LAT in OL-NMP56). At Rummintie 50 (OL-NMP57) and at Korvensuo reservoir (OL-NMP58) noise levels have decreased compared to the measurements done in 2016 (-4,9 db LAT in OL-NMP57 and -3,7 db LAT in OL-NMP58). Traffic noises were heard at Rummintie and visitor centre parking lot. Some measurement work was done at Korvensuo reservoir and sound of winch could be heard. Bird singing was observed at all measuring sites. The monitoring locations are shown in Figure 4-1, the measurement conditions in Table 4-1 and the results in Tables 4-2 to 4-3 and in Figure 4-3.


42 34 Figure 4-1. Noise measuring locations in Map data: Topographic database by the National Land Survey of Finland and Posiva Oy. Figure 4-2. Noise measurements done at Posiva's monitoring location OL-NMP55 (drill hole OL-L15). (photo: Tiina Sojakka/Posiva Oy)
43 35 Table 4-1. Noise measurement conditions in Weather prameters from TVO s weather mast (OL-WOM1). May 11 Dec.11 Measurements done for Posiva TVO Temperature, ºC +1,1 +0,5 Wind spread direction, º Wind speed, m/s 2.5 3,2 Weather Sunshine, no rain, no snow or frost on the ground Fair and cloudy, no rain, the ground partly covered with snow Time 08:00-09:00 10:00-15:00 Table 4-2. Noise levels (LAT, db) at TVO's monitoring locations. Location 7.12., 8.12.* & ** , 5.12.* & 7.12.** , * & ** & * OL-NMP ** 36.6** OL-NMP ** 38.1** OL-NMP * OL-NMP * 61.9* 55.2* OL-NMP OL-NMP * OL-NMP OL-NMP OL-NMP ** OL-NMP * 46.5* 45.3* Location & & * * 2016 OL-NMP * OL-NMP * OL-NMP * 50.1 OL-NMP * 46.1 OL-NMP OL-NMP OL-NMP OL-NMP * 57.6 OL-NMP OL-NMP * 48.7
44 36 Table 4-3. Noise levels (LAT, db) at Posiva's monitoring locations. Location OL-NMP OL-NMP OL-NMP OL-NMP OL-NMP Location OL-NMP OL-NMP OL-NMP OL-NMP db (A) OL-NMP52 OL-NMP55 OL-NMP56 OL-NMP57 OL-NMP Figure 4-3. Noise measurement at Posiva's monitoring locations in (LAT, db).
45 Effluent water Water quality of surface runoff (automated measuring weirs) Results, including also chemical analyses, of samples taken from automated measuring weirs have been presented in the connection of weather data in Section Outlet waters of ONKALO site All waters used during the excavation of ONKALO are pumped up to the surface into a sedimentation pool after the removal of residue oil from the water. From the sedimentation pool (OL-PO1) the water flows through an outlet pipe to the outlet ditch. In 2017, weekly sampling of OL-PO1, OL-DI (the end of the discharge tube) and OL- DI15 (the intersection of Satamatie road and the ditch flowing from ONKALO to the sea) was carried out by RTK Palvelu Oy. The samples are taken according working guideline POS and POS The locations of the sedimentation pool, the discharge tube (outlet pipe) and the outlet ditch are presented in Figure 4-4. Before year 2012 the results of outlet ditch have been presented in the reports concerning foreign materials (e.g. Salo 2013). The monitoring of sedimentation pool have been transferred from monitoring programme of foreign materials to programme of surface environment in Sampling points OL-PO1 and OL-DI1 are analysed for ph, sodium fluorescein and electrical conductivity (EC) and OL-DI15 for ph (Figures 4-5 to 4-8). In 2017 a more comprehensive analysis was carried out four times for OL-PO1 (analyses package Class A,), OL-DI1 & OL-DI15 (analyses package Class 1). The lists of analysed parameters for both analyses packages are described in inner memo POS The results of these analyses are presented in Appendix G, Tables G-1 to G-3 and G-10 for metal analyses. The analyses have been carried out by TVO s laboratory and ALS Scandinavia AB. Posiva monitors the ph of the outlet waters pumped out from the underground facilities. The action limit set for ph at the measuring point OL-DI15 is 9.5 (POS , v.2). This value has not been exceeded during the year 2017 (Figure 4-5). Sodium fluorecein is added into the water used in the works in ONKALO and its concentration in the outlet waters can be used to get a view of the relative proportion of human-induced waters in the total amount of outlet waters. The EC value of outlet waters can also indicate the origin of water (groundwater vs. tap water). In general the sodium fluorescein values of the samples in 2017 varied between µg/l. The EC values of outlet waters in 2017 varied between ms/cm, with few values over and under these values. Nitrate and sulphate concentrations in the sedimentation pool and along the outlet ditch are presented in Figures 4-9 & In the end of 2016 elevated nitrate levels were observed in all measuring points. Nitrate levels were still high during Reason for Elevated NO3 levels in outlet waters of ONKALO are caused by explosives used in the underground excavation works. Sulphate concentrations in outlet waters have been slowly rising since During 2017 samples from measuring points OL-PO1 and OL-


 used for")
46 38 DI1 indicated descending trend in SO4 levels. Suspended solid levels in outlet ditch are usually less than 50 mg/l (Figure 4-11). During 2017 high values of suspended solids were detected in sedimentation pool but not in the outlet ditch. The amount of some most common metals, that could be found in fresh waters, were analysed also from the ONKALO outlet ditch samples. During 2017 no metals were analysed from the measuring point OL-PO1. The results of Onkalo outlet waters are presented together with the results of the ditch running from the rock heaps (See 4.2.3). Chloride, sodium and strontium level were clearly higher in measuring points OL-DI15 than in OL-DI1 and OL-DI14 and alternatively the zinc and nickel levels are clearly higher in measuring points OL-DI14 than in outlet waters of Onkalo. Otherwise there were no notable differences between different ditches and no harmful amount of metals like cadmium, nickel or lead was found. Examples of some results are presented in Figure 4-12 and all the results are presented in Appendix G. Figure 4-4. Locations of the sedimentation pool, the discharge tube and the outlet ditch, as well as locations OL-DI1 and OL-DI15 (red dots) used for monitoring in Measuring weir OL-MP5, located in the outlet ditch, is also shown in the figure with green triangle. Map data: Topographic database by the National Land Survey of Finland and Posiva Oy. Coordinate system: KKJ1. Map layout by Tuomas Pere / Posiva Oy.
47 ph ,5 OL-DI1 OL-DI Figure 4-5. ph at measuring points OL-DI1 and OL-DI15 in Action limit for ph of outlet waters in measuring point OL-DI15 is ph OL-DI1 OL-DI15 OL-PO Figure 4-6. ph at measuring points OL-DI, OL-DI15 and OL-PO1 between
48 40 5 4,5 Electrical conductivity (ms/cm) 4 3,5 3 2,5 2 1,5 1 OL-DI1 OL-PO1 0,5 0 Figure 4-7. Electrical conductivity at measuring point OL-DI1 and OL-PO1 in Sodium fluorescein (µg/l) OL-DI1 OL-PO Figure 4-8. Sodium fluorescein at measuring point OL-DI1 and OL-PO1 in 2017.
49 41 OL-DI1 OL-DI15 OL-PO Nitrate (mg/l) Figure 4-9. Nitrate (NO3) values at measuring points OL-DI1, OL-DI15 and OL-PO1 in Regular sampling in OL-DI15 started during OL-DI1 OL-DI15 OL-PO1 Sulphate (mg/l) Figure Sulphate (SO4) values at measuring points OL-DI1, OL-DI15 and OL-PO1 in Regular sampling in OL-DI15 started during 2012.
50 42 Figure Suspended solid values (mg/l) at measuring points OL-DI1, OL-DI15 and OL-PO1 in Gaps in lines are due to sampling happened at different times.
51 43 Figure Cadmium (Cd), iron (Fe), nickel (Ni), copper (Cu), lead (Pb) and zinc (Zn) values measured in ditch water in the measuring points OL-DI, -DI15 (outlet waters of Onkalo) & OL-DI14 (drainage water from the rock heaps) in From the ditch OL- DI14 two samples were taken in Lead-values that are not shown in bars were >0,01 µg/l (e.g. Pb-values for OL-DI1) Drainage water from rock heaps Obligatory monitoring of the waters running from the rock and earth piling area to Flutanperä area in the southern side of the Olkiluoto Island are monitored by Posiva. Monitoring of the ditch running by the rock piling and crushing areas (OL-DI14) was started in autumn The ditch water is sampled at least twice a year. Posiva also monitors the possible effects of the rock and earth piling area to the groundwater quality from a nearby shallow groundwater hole OL-EP5. Locations of OL-DI14 and OL-EP5 are presented in Figure Samples are analysed for heavy metals, the amount of suspended solids and other basic parameters. Since it has proved problematic to obtain samples from the OL-EP5 and OL-DI14 simultaneously, the samples are now taken on different days if necessary. Furthermore, the amount of water in the ditch has often been insufficient for getting a sample from running water. The analyses have been carried out by TVO s laboratory and ALS Scandinavia AB and the results of 2017 are summarised
 (POS- 008123, v.2) was not exceeded in 2017 (Figure 4-14).")
. In 2017 the highest SO4 level was measured in November: 789 mg/l.")
.")
52 44 here (results from earlier years have been summarised by Haapanen & 2014, Pere et al & 2017 and Sojakka et al. 2018a & b). The action limit set for suspended solids at the measuring point OL-DI14 (50 mg/l) (POS , v.2) was not exceeded in 2017 (Figure 4-14). The sulphate levels in OL-DI14 have fluctuated heavily during the whole monitoring period ( ). It seems that SO4 levels are generally higher in autumn than in spring or summer (See Section 3.2.3). In 2017 the highest SO4 level was measured in November: 789 mg/l. Nitrate concentrations in OL-DI14 have been on average below 100 mg/l (excluding period of high values in , see Haapanen 2014). During 2017 NO3 started to rise again in autumn. Sulphate and nitrate levels in OL-EP5 have remained on the same level during the whole monitoring period ( ). Element analyses were also done on these samples but notable leaching of heavy metals from the rock piling area has not been observed during from the samples taken 2017 (See results for OL-DI14 in Figure 4-12). Analysis results of OL-DI14 and OL-EP5 are presented in Appendix G Tables G-4 and G-5 and G-10 for metal analyses. Nitrate, sulphate, suspended solid and ph results are presented also in Figures 4-14 to Figure Location of groundwater hole OL-EP5 (multilevel piezometer), ditch running rfom rock heaps (in red) and outlet ditch of Onkalo (in blue).map layout Jani Helin/Posiva Oy.
53 45 Figure Nitrate (NO3)and Sulphate (SO4) values (mg/l) measured in the water of the ditch by the rock piling and crushing area (OL-DI14) in Additional nitrate analyses were taken in 2012 while sulphate sampling continued normally, thus the apparent break in sulphate data in No samples were taken at point OL-DI14 during Figure Nitrate (NO3)and Sulphate (SO4) values (mg/l) measured in the water of the shallow groundwater hole by the rock piling and crushing area (OL-EP5) in
54 46 Figure Suspended solids results from the ditch by the rock piling and crushing area (OL-DI14) and the shallow groundwater hole OL-EP5 in Action limit for suspended solids of rock piling area ditch in measuring point OL-DI14 is 50 mg/l.. Figure ph-results from the ditch by the rock piling and crushing area (OL-DI14) and the shallow groundwater hole OL-EP5 in
55 Limnic systems Description of the monitoring system There are few limnic systems in Olkiluoto at the moment. The Korvensuo fresh-water reservoir (OL-RS1) is the most important, but it is artificial and heavily controlled. Water of the reservoir is pumped from river Eurajoki. Hydrogeochemistry of the reservoir is monitored weekly by TVO, and the results of the analyses are submitted to the water works. No further summary of the findings is compiled. In addition to the monitoring activity by TVO, Posiva started to monitor the reservoir in From 2009 onwards the sampling has generally been carried out three times a year. The River Eurajoki is monitored by industrial companies operating on its upper course. The results are published in an annual public report "Eurajoen ja Eurajoensalmen Tarkkailututkimus" (in finnish) by Lounais-Suomen vesi- ja ympäristötutkimus Oy (Koivunen 2018). Also the River Köyliönjoki, running to River Eurajoki, is sampled, but results are omitted from the summary report. In addition to the aforementioned monitoring data published by external companies, Posiva has also started to monitor the chemical characteristics at one location (OL-RWS04) along the river in See the location of Posiva s monitoring point and those of the mandatory monitoring by other industrial companies mentioned in the following text in Figure Chemical analyses of Korvensuo fresh-water reservoir and the River Eurajoki In 2017, water samples were taken from Korvensuo fresh-water reservoir (OL-RS1) and River Eurajoki (OL-RWS04) in April and June to be analysed for isotopes by the subcontractors of TVO's laboratory. In addition, basic water chemistry parameters were analyzed in April. Results are presented in Appendix C Tables C-1 and C Water quality and discharges of the River Eurajoki (and Eurajoensalmi Bay) Results of the mandatory monitoring of the River Eurajoki (carried out for other organisations than Posiva) have been presented by Koivunen (2018). Before 2013 the aforementioned annual report has also been discussed in this report but beginning from the environmental monitoring report of 2013 (Pere et al. 2015), the reader is referred to the original reports instead (Koivunen 2014, 2015, 2017 & 2018, Koivunen & Saarikari 2016).
56 48 Figure River monitoring stations including the ones mentioned in the text. OLRWS04 is river monitoring point of Posiva. Coordinate system: ERTS-TM35FIN. Map data: free 1: background map by the National Land Survey of Finland. Coordinate system: ERTS-TM35FIN. Map layout by Reija Haapanen / Haapanen Forest Consulting.
57 Marine/brackish ecosystems Description of the monitoring system The marine ecosystem has been part of TVO s mandatory monitoring programme since the 1970s. Physical and chemical properties are sampled several times a year on seven plots by Lounais-Suomen vesi- ja ympäristötutkimus Oy (LSVSY). Some more detailed monitoring is performed on sub-sets of these plots. Phytoplankton is analysed with a comprehensive quantitative method (Lepistö et al. 2006) on four sites. Bottom fauna samples are taken once a year on the seawater quality monitoring sites. The main findings of the studies have previously also been summarised in Posiva's annual environmental monitoring reports but starting from the environmental monitoring report of 2013 (Pere et al. 2015), the reader is referred to the original reports instead (Turkki , KVVY 2018). The reports are publicly available through the Centre for Economic Development, Transport and the Environment (ELY-Keskus). Earlier Posiva monitored water quality parameters at three locations three times a year. Monitoring of quality parameters ended during 2016 (See Chapter 2 and Appendix A). Hydrogeochemical characterisation of seawater samples is still in the monitoring programme and these samples were taken in August 2017 from four locations. The results of hydrogeochemical characterisation are presented in Appendix D. Locations of sea sampling sites are presented in Figure Figure Locations of sea sampling sites including the ones used in Coordinate system: ERTS-TM35FIN. Map data: free 1: background map by the National Land Survey of Finland. Coordinate system: ERTS-TM35FIN. Map layout by Reija Haapanen / Haapanen Forest Consulting.
58 50 TVO monitors fish stocks by test fishing every four years. Results of the previous test fishing in 2014 were presented by Peltonen (2015) and are summarised in WR (Pere et al. 2017). Fishing activities are followed up by interviewing professional fishermen every other year. The fishery survey concerning year 2017 was made by Sami Ojala/KVVY Oy (Ojala 2018). The report is originally written in Finnish and has been freely translated to this report in English (in Section 4.4.2). The report is available through the Centre for Economics Development, Transport and the Environment (ELY-Keskus). The variation of sea water level affects some of the results presented in this report, and is shown in Figure Figure Sea level fluctuations at Rauma mareograph in 2017, difference from the N60 system sea level. Data by Finnish Meteorological Institute.
59 Fishery monitoring results In 2017 only one professional fisherman was active in the marine areas surrounding Olkiluoto (same situation as in survey done in 2015). Other professional fishermen who have worked earlier in the Olkiluoto sea area have reported to discontinue their profession. In 2017 fisherman used different kind of fishing nets (fishing nets for herring and bottom set gillnets), trap nets and fyke nets. The most effective fishing net was fyke net (7,8 kg fish/day) and the most used fishing equipment was bottom set gillnet (87.8% use). (Ojala 2018) In 2017 the fishing in the Olkiluoto sea area continued year-round. The fishing area is located in the front of Olkiluoto in shallow waters and in the shelter of the islands. The fishing effort (the number of fishing traps used in month) stayed in the same level around the year, February and March being the exeptions, when the number of fishing times dropped. (Ojala 2018) The size of total fish catch in the Olkiluoto sea area in 2017 was 23,1 tons (double as match as in 2015). In 2017 the most significant prey species in Olkiluoto area in 2017 was roach (Rutilus rutilus). The amount of roach catch was 10,9 tons (47 % of the total catch). Other prey species abundant in total catch were perch (Perca fluviatilis) and bream (Abramis brama). Compared to year 2015 the size of the Baltic herring (Clupea harengus), bream and roach catches have increased and pike (Esox lucius) catch have decreased (Table 4-4). (Ojala 2018) According the fishermen all the fish species have decreased in the area and fishes have moved from deep waters to shallow waters. Fishermen mentioned that seals (Halichoerus grypus) and great cormorants (Phalacrocorax carbo) are affecting negatively to fishing. (Ojala 2018) Casual fishing in Olkiluoto area was also surveyd. The size of fish catch for casual fishermen in 2017 was 11,2 tons. The most common fishing equipmement used were different kind of fishing nets. Fishing hooks, spinners and fish traps were also used. The most abundant prey species were perch (26 % of total catch), pike (16 %) and roach (10 %). According casual fishermen algal blooms, turbidity of the water and animals, like seals, are distracting the fishing activities.(ojala 2018)
60 52 Table 4-4. Catch of domestic and recreational fishing by species in the sea area near the Olkiluoto in (after Roikonen 2016 & Ojala 2018). Fish species kg % kg % kg % kg % kg % kg kg % kg % Baltic herring Whitefish Salmon, Trout Northern pike Bream Ide Roach Burbot Zander European perch European flounder Rainbow trout Others * Total * Others including Smelt, Crucian carp, European eel, Tench 4.5 Flora and fauna Situation in general During the update of surface environment monitoring programme it was decided that the environmental impact of Posiva's actions to the biodiversity of local flora and fauna will be monitored in future every ten years with a general biodivesity study instead of making several different species specific investigations. Next time this wide-range biodiversity study will be carried out around Before this no vegetation (including edibles, like berries) or animal-related surveys will be implemented within the monitoring programme. Section lists the terrestrial animal related studies done earlier. The results concerning the berry and mushroom sampling between 2009 and 2015 were reported by Helin (2013a), Pere et al. (2017) and Sojakka et al. (2018). Forest areas on Olkiluoto island has earlier been monitored and investigated on several plots (FIP=Forest Intensive monitoring Plot, MRK=Wet deposition sampling plot). The result of these studies were published in annual monitoring reports (e.g. Aro et al. 2010, 2011, 2013, 2014 & 2016). The last forest monitoring report is for the year 2016 (Aro et al b). Commissioned by TVO, Fieldworks of a general biodiversity study were carried out in Olkiluoto in 2013 and the results were compiled in 2014 by Ramboll (Lehvola & Ojala 2014). A short summary of the study was presented in WR (Pere et al. 2017) Liiklanperä Natura 2000/Old forest conservation area The Liiklanperä old forest conservation area is situated in the southern part of the island. The area has been established in 1993 and it has a high conservation status on a national level (Asetus vanhojen metsien suojelusta 1115/1993). This area and some areas around it have later also been included in the Natura 2000 programme. The construction of ONKALO could theoretically affect the vegetation within this area if major and longterm changes in the groundwater level would occur. Some plants are depended on the soil
61 53 water of the capillary fringe which is locating just above the groundwater level. Subsidence of groundwater level would mean that capillary suction couldn t move water upward to these plants. These plants would suffer from drought and eventually die out. Results yet suggest that subsidence of groundwater level has usually only minor effects on vegetation on sites were groundwater level is normally below the depth of 2,5 meters. (Ahokas & Sallasmaa 1998) Waters accumulated to the encapsulation plant construction site are mainly pumped to Korvensuo direction (north) but natural direction of surface runoff is towards Liiklankari (south). Surface waters running from construction site could contain some substances that are harmful to environment (e.g. cement due to its high phvalue). Furthermore, the dust from construction activities and rock piling area, as well as noise from the construction and operating of ONKALO could also reach this area. Posiva's activities shall not cause any harmful effects to the nature of the conserved area, noise conditions are also regulated. Earlier the potential effects of Posiva s activities were monitored in the FIP-areas. Three of the FIP-areas (OL-FIP4, -10 & -11) were located in or near the Natura 2000-area. Researches in the FIP-areas included e.g. understorey vegetation surveying and dust monitoring. No dramatic changes in vegetation coverage have been noticed on the FIPplots. Concerning the dust effects, most of the analysed elements had not accumulated on the needle surfaces along the monitoring network. In conclusion, no harmful effect of the human activities were observed in the nature concervation area during (Aro et al. 2018a & b, Sojakka et al. 2018). Today the condition of nature conservation area is monitored by sampling the ditch running trough the area (Figure 4-21) and making noise measurements. The measuring weir OL-MP4 is located in the nature conservation area ditch. According the samples taken from OL-MP the sulphate levels in the ditch are clearly higher than in other measuring weirs but no harmful amount of metals like cadmium, nickel or lead have been found. (Section earlier in this report). At the borderline of the Natura 2000 area, closest to Olkiluodontie road, noise is mainly caused by the traffic and not related to ONKALO. On some occasions, noises from the ONKALO construction site can also be heard. (Section 4.1 earlier in this report). In addition the groundwater in or near the nature conservation is monitored annually. The salinity (TDS) of the groundwater in monitoring holes near the conservation area has rised since 2001 possibly due to road salting but this phenomenon has not been observed in the groundwater monitoring hole that is located inside the nature conservation area. Results of these groundwater analyses are presented in annual Hydrogeochemistry monitoring reports of Olkiluoto (e.g. Vuorio et al. 2018).

62 54 Figure Liiklanperä nature conservation area (light green area). Ditch running trough Liiklanperä marked with blue and measuring weir located in ditch with red triangle. Map data: Topographic database by the National Land Survey of Finland and Posiva Oy. Coordinate system: KKJ1. Map layout by Tiina Sojakka / Posiva Oy Terrestrial animals The latest Working Report on game populations in hunting season was prepared by Faunatica Oy (Niemi & Nieminen 2018). No report was been written since, but the list of hunted animals in Olkiluoto by local hunting club (Olkiluodon Metsästyseura ry) is presented in Table 4-5 (game birds) and 4-6 (game mammals). Small mammal studies have been carried out by Nieminen et al. (2009), Nieminen & Saarikivi (2008) and Ranta et al. (2005). The radioecological study by Roivainen (2006) also contained some data on small mammals. Reptiles and amphibians (Nieminen & Saarikivi 2008) and ground beetles and ants (Santaharju et al. 2009) were surveyed in In 2009, a line transect sampling of ants and snails was conducted (Nieminen et al. 2009). Earthworms were sampled in 2009 as well (Nieminen et al. 2009). Carabid beetles were sampled in 2014 from Olkiluoto and ants sampled in 2010 and 2012 from Olkiluoto and reference areas. Results of these studies are reported by Haavisto et al (2018). Bird inventories on Olkiluoto Island have been carried out by Yrjölä (1997, 2009). Monitoring of birds on the sea areas near Olkiluoto during the breeding season has been reported by by Haapanen (2010) and Alho & Sojakka (2018).
63 55 Table 4-5. Hunted game birds in Olkiluoto between Statistics for the the years 2016 & 2017 are based on the annual action report of local hunting club (Olkiluodon Metsästysseura ry). Other data from Nieminen (2010), Niemi et al. (2011 & 2012), Niemi & Nieminen ( , 2018); some earlier years taken from Haapanen (2010). In the following, only the number of hunted individuals is presented: a 2017 a Mallard Teal Hazel grouse Black grouse Woodcock Hooded crow Greylag goose c Goldeneye b c Common eider b Common wood pigeon European - herring gull Common pochard Eurasian wigeon Common pheasant a) Statistics for years 2016 & 2017 are based on the annual action reports which announce bag per calendar year. Earlier statics are based on game statiscs reports (like Niemi & Nieminen 2018) which announce bag per hunting year. b) In and around Olkiluoto Island c) Altogether seven individuals of greylag goose and goldeneye were mentioned to be hunted, but no division was given

, Niemi et al.")
64 56 Table 4-6. Hunted game mammals in Olkiluoto between Statistics for the the years 2016 & 2017 are based on the annual action report of local hunting club (Olkiluodon Metsästysseura ry). Other data from Nieminen (2010), Niemi et al. (2011 & 2012), Niemi & Nieminen ( , 2018); some earlier years taken from Haapanen (2010).
65 Private drilled wells The private drilled wells (OL-DWH2, OL-DWH3, OL-DWH5) in active use are sampled once a year for chemical composition. In 2017, the water tables of wells were measured in (OL-DHW2, -3, 5) and (OL-DHW2, -5). The results are presented in Figure Generally it can be concluded that in 2017 the groundwater tables in the wells were a little lower than in 2017 but fluctuation follows reference data from Olkiluoto area (OL-PP1, -9 & -10; shallow wells in bedrock that are not affected by ONKALO). No unexplained changes or effects of ONKALO were observed. The chemical contents were sampled and analysed by the Water Protection Association of the River Kokemäenjoki (KVVY). Chloride, iron, manganese and ph results from are presented in Figures 4-23 to Other results are presented in Appendix H. In general, the water quality parameters were in the same orders of magnitude as in the previous years. Compared to last years results, the sulphate levels in OL-DHW2 have decreased highly (210 mg/l <0,5 mg/l) and manganese levels in OL- DHW5 have increased highly (32 µg/l 260 µg/l). In the well OL-DHW2 colour index, electrical conductivity, chloride, manganese, sodium and cloudiness values exceeded highly the quality recommendation limits for drinking water set by the Ministry of Social Affairs and Health (Decision 401/2001). High colour index is typically caused by metals or colourful organic compounds, like humic acids. High value in electrical conductivity expresses high amount of dissolved salts (like NaCl) in water. Chloride does not have known adverse health effects but it is known to affect the taste of the water and cause corrosion in the water system, even with low concentrations. (Oravainen 1999) Based on research done by the Finnish National Institute for Health and Welfare (THL) it has been concluded that having manganese concentrations higher than 100 µg/l in the drinking water could cause harmful health effects (Komulainen 2013). In the well OL-DHW2 water was clear and smelled mouldy. The quality recommendation limits for drinking water were exceeded for colour index and cloudiness in the well OL-DHW3 and for colour index and manganese in the well OL-DHW5. Of the analysed bacteria Escherichia coli (3 cfu 1 /100 ml) and Coliform bacteria (9 cfu/100 ml) were found from the sample from OL-DHW5. Quality recommendations for E.coli are < 1 cfu/100 ml and for Coliform bacteria < 100 cfu/100 ml in drinking water. Other parameters, if not mentioned above, are considered to fulfill the requiremets set for household drinking water. 1) In microbiology, a colony-forming unit (cfu) is a unit used to estimate the number of viable bacteria or fungal cells in a sample.
66 58 Figure The water tables in wells OL-DWH2 and DWH3 in , OL-DWH5 in and in shallow core drilled holes in bedrock OL-PP1, -9 & -10 in DWH measurements give difference to the top of the well. Figure Chloride contents of the water in monitored private wells in The limit for drinking water set by the Ministry of Social Affairs and Health is 100 mg/l.
67 59 Figure Iron contents of the water in monitored private wells in The limit for drinking water set by the Ministry of Social Affairs and Health is 400 μg/l. Iron content in OL-DWH2 in 2008 and 2009 was under the quantification limit. Figure Manganese contents of the water in monitored private wells in Manganese content in OL-DWH3 in 2009 <30 μg/l. The recommended limit for drinking water set by the Ministry of Social Affairs and Health is 100 μg/l.
68 Figure ph of the water in monitored private wells in
69 61 5 RESULTS III: BASELINE OF MONITORING OF RADIOACTIVE RELEASES Radioactivity in the environment is currently being monitored by the nuclear power plant operated by TVO. Samples from air, terrestrial environment, terrestrial foodstuffs and marine environment are however relevant for Posiva as well. In 2014 Posiva also established a plan for defining the radiological baseline before the operation phase of the repository. Posiva's own baseline studies are due to begin in The major anthropogenic sources of radionuclides in the area originate from the Chernobyl fallout in April 1986 and from authorised effluents and air emissions from the nuclear power plant. The most common nuclides clearly originating from the power plant include, for example, Mn-54, Co-60 and Ag-110m (not exclusively). During 2017 small amounts of Ru-106 were found in autumn from several samples in Olkiluoto (air, deposition, landfill runoff water and suspended matter). At the same time Ru-106 observation were made also in other European countries. Origin of Ru-106 isotope remains unknown. (Julin 2018) Naturally abundant nuclides, such as Be-7 and K-40 are found in every sample if determined. Their concentrations represent natural variations in the ecosystem and also reflect the quality of the measurement. In addition, the behaviour of these elements and nuclides is relatively well known enabling, for example, model adjustments against the measurements. The current radioactivity monitoring locations used by TVO are shown in Figure 5-1. The results of radionuclide analyses in 2017 are shown in Appendix I. When Posiva's own monitoring for radioactivity in the environment is started in 2018, new observation points will be established in addition to the current monitoring locations used by the power plant to fulfill the environmental radioactivity monitoring requirements set for the repository and the encapsulation plant. Some examples of radionuclides in terrestrial environment are given in Figure 5-2. Radionuclides in terrestrial and aquatic environments and in food chain were sampled in National scale comparison values can be obtained from publications of the Finnish Radiation and Nuclear Safety Authority (STUK). Since 2010, Posiva has carried out sampling of crop plants, aquatic macrophytes, and bottom fauna, as well as soil and water in order to obtain more data on site-specific concentration ratios (e.g. Helin et al. 2011, Kangasniemi et al. 2011, Helin 2013b, Kangasniemi & Helin 2014). In addition to the Olkiluoto Island, some of the reference lakes and mires (e.g. Haapanen et al. 2009, 2010, 2013, Aro et al. 2018c) have been included in the sampling program. These, however are not done as part of the monitoring program but long-term safety case studies instead. Results of the reference area studies are used in the long-term safety Biosphere assessment work (e.g., Posiva 2013b, 2013c). The studies are mentioned because the aforementioned sampling locations in Olkiluoto and its surroundings can be also used in the baseline monitoring for radioactivity in the environment. During 2017 no sampling campaigns for elemental analyses took place in Olkiluoto or the reference areas due to data-lock for biosphere modelling (See Chapter 2).


70 62 Figure 5-1. The radioactivity monitoring locations (coding according to TVO s sampling place codes) in Map data: Topographic database by the National Land Survey of Finland (permission 41/MYY/13) and Posiva Oy. Coordinate system: KKJ1. Map layout by Jani Helin / Posiva Oy.
, Pere et al. (2015 & 2017) and Sojakka et al. (2018a & b).")
71 63 Figure 5-2. Radionuclides in terrestrial environment in the vicinity of the weather mast OL-WOM1 (see location in Fig. 3-1) in , Bq/kgDW. Earlier results have been taken from Haapanen ( ), Pere et al. (2015 & 2017) and Sojakka et al. (2018a & b). The orange columns show averages for the whole monitoring period ( ) and the error bars show the standard deviation during the monitoring period. The grey column shows the value of 2017 only.
72 64
73 65 6 SUMMARY This report presents the results of Posiva s environmental monitoring of Olkiluoto Island for the year In 2016 the monitoring programme was updated to concern years This current surface environment monitoring programme is described in inner memo (POS ). The need to the update the programme came from the timing of the data-lock in safety case for operating license application. The surface environment monitoring programme has been producing initial data for the biosphere modelling. Because the data-lock for the biosphere modelling for safety case was set in the end of 2016, could the production of data needed in the biosphere modelling be ceased by the end of The current surface environment monitoring programme is focusing on the traditional environmental impacts of contruction and operation works of the final disposal project. Part of the monitoring is performed by the company running the nuclear power plants on the island, Teollisuuden Voima Oy (TVO). This Working Report presents the main results of Posiva s environmental monitoring programme on Olkiluoto Island in Results are presented under three topics: 1. Interaction between surface environment and groundwater in bedrock, 2. Environmental impact and 3. Baseline of monitoring of radioactive releases. The main findings of topics 1-2 are summarised below. Monitoring of topic 3 has not begun yet, and thus far, only result tables from TVO s mandatory monitoring have been added to these summary reports. Concerning monitoring sections not producing data in 2017, the reader is referred to the summaries of the previous reports (e.g. Pere et al. 2017). Concerning interaction between surface environment and groundwater in bedrock, records were maintained e.g. on changes in infrastructure and other land use. During 2017 the land use of Olkiluoto was monitored by taking aerial photographies of the area. From the aerial images the increase of industrial areas and growth of new forest on shore-area can be observed. Annual meteorolocigal statistics were derived from weather mast data, and automated measuring weirs produced data on surface runoff. In the monitoring of surface runoff no events deviating from previous years were observed. The sulphate level in the ditch running south of Onkalo-site remains clearly higher than in other monitored ditches. According the Bachelor's thesis by Bohm (2017) the interaction between crushed rock and water in aerobic conditions seems to be apparent reason for the observed exceptionally high sulphate levels in groundwater samples taken from near the surface and surface water samples. Environmental impact analyses included e.g. monitoring of noise, effluent waters, nearby fresh water systems and private drilled wells. The noise level at drill hole OL-L15 and at the visitor centre parking lot have increased from the previous measurement. At Rummintie 50 and at Korvensuo reservoir noise levels have decreased compared to the measurements done in Traffic noises were heard at Rummintie, by the drill hole and visitor centre parking lot. Some measurement work was done at Korvensuo reservoir and sound of winch could be heard. Battering sounds were heard from encapsulation plant construction site. Bird singing was observed at all measuring sites.
74 66 The outlet waters of ONKALO site are monitored by a weekly sampling. During 2017, the action limit for ph (9.5) was not exceeded at the measuring point OL-DI15 close to the sea. Sulphate concentrations in OL-DI1 have stayed in about in the same level (approximately 200 mg/l) since In the end of 2016 nitrate levels (originating from residues of explosives) in OL-DI1 started to rise and stayed high during High suspended solid values were observed occasionally in the sedimentation pool but not in the outlet water. Nitrate and sulphate contents in the ditches running from the rock heaps started to rise in the end of 2017.The action limit for suspended solids in the ditch water at OL-DI14 (50 mg/l) was not exceeded in The Korvensuo reservoir and sample point in Eurajoki-river were sampled once during The local professional fishermen were interviewed and results of these interviews were reported by TVO. Harmful effects on the nature conservation area of old forests or the Natura 2000 area in the southern part of the island were not observed in the surface environment. The water quality of the monitored private drilled wells was good or poor depended on the well in case. Water quality is affected by the natural properties of the area. The water level fluctuations follow the fluctuations observed at the reference sites (shallow wells in bedrock, which are not affected by ONKALO).
75 67 REFERENCES Ahokas, H. & Sallasmaa, O Kalliotilojen vaikutus pohjaveden pinnankorkeuteen ja kasvillisuuteen (in Finnish: Effect of underground facility on groundwater table and vegetation). Posiva Oy, Working Report p. + App. Alho, P., Sojakka, T Summary of breeding bird counts in the Olkiluoto archipelago. Posiva Oy, Working Report p. Aro, L., Derome, J., Helmisaari, H.-S., Hökkä, H., Lindroos, A.-J. & Rautio, P Results of Forest Monitoring on Olkiluoto Island in Posiva Oy, Working Report p. Aro, L., Helmisaari, H.-S., Huhta, A-P., Hökkä, H., Lindroos, A.-J. & Rautio, P Results of Forest Monitoring on Olkiluoto Island in Posiva Oy, Working Report p. Aro, L., Hökkä, H., Lindroos, A.-J., Rautio, P., Salemaa, M., Helmisaari, H.-S. & Leppälammi-Kujansuu, J Results of forest monitoring on Olkiluoto Island in Posiva Oy, Working Report p. Aro, L., Hökkä, H., Lindroos, A.-J. & Rautio, P Results of forest monitoring on Olkiluoto Island in Posiva Oy, Working Report p. Aro, L., Lindroos, A.-J., Rautio, P. & Ryynänen, A Results of forest monitoring on Olkiluoto Island in Posiva Oy, Working Report p. Aro, L., Lindroos, A.-J., Rautio, P., Ryynänen, A., Korpela, L., Mäkinen, V., Viherä- Aarnio, A. & Salemaa, M. 2018a. Results of forest monitoring on Olkiluoto Island in Posiva Oy, Working Report p. Aro, L., Lindroos, A.-J., Rautio, P., Ryynänen, A., Korpela, L., Viherä-Aarnio, A. & Salemaa, M. 2018b. Results of forest monitoring on Olkiluoto Island in Posiva Oy, Working Report p. Aro, L., Lahdenperä, A.-M., Korpela, L., Mäkinen, V., Salemaa, M., Saarinen, M., Parviainen, L. & Kuusisto, J. 2018c. Studies on reference mires: 2. Lastensuo, Pesänsuo and Häädetkeidas in Posiva oy, Working Report p. Asetus vanhojen metsien suojelusta (in Finnish: A decree on conservation of old forests) /1115. Finlex. [Referred ] Bohm, L Korkeat sulfaattipitoisuudet Olkiluodon pohjavesissä (in Finnish: High sulphate levels in groundwater of Olkiluoto). Bachelor's thesis. Turku University of Applied Sciences p. Drebs, A., Nordlund, A., Karlsson, P., Helminen, J. & Rissanen, P Climatological statistics of Finland Helsinki: Finnish Meteorological Institute, Climatic statistics of Finland. Vol. 2002, no. 1, 99 p.
76 68 Haapanen, A. (ed.) Results of monitoring at Olkiluoto in Environment. Posiva Oy, Working Report p. Haapanen, A. (ed.) Results of Monitoring at Olkiluoto in Environment. Posiva Oy, Working Report p. Haapanen, A. (ed.) Results of Monitoring at Olkiluoto in Environment. Posiva Oy, Working Report p. Haapanen, A. (ed.) Results of Monitoring at Olkiluoto in Environment. Posiva Oy, Working Report p. Haapanen, A. (ed.) Results of Monitoring at Olkiluoto in Environment. Posiva Oy, Working Report p. Haapanen, R. (ed.) Results of monitoring at Olkiluoto in Environment. Posiva Oy, Working Report p. Haapanen, R. (ed.) Results of monitoring at Olkiluoto in Environment. Posiva Oy, Working Report p. Haapanen, R. (ed.) Results of monitoring at Olkiluoto in Environment. Posiva Oy, Working Report p. Haapanen, R. (ed.) Results of monitoring at Olkiluoto in Environment. Posiva Oy, Working Report p. Haavisto, F., Kotze, J., Venn, S. & Nieminen, M Studies on insect fauna in Olkiluoto and Lastensuo mire in Posiva Oy, Working Report p. Helin, J. 2013a. Study notes on berry and mushroom monitoring on Olkiluoto Island in Posiva Oy, Working Report p. Helin, J. 2013b. Study notes on chemical analyses of fauna on Olkiluoto Island in Posiva Oy, Working Report p. Helin, J., Ikonen, A.T.K. & Salo, T Crops and garden products near Olkiluoto repository site. Full paper, International Conference on Radioecology & Environmental Radioactivity: Environment & Nuclear Renaissance, June 2011, Hamilton, Ontario. Radioprotection 46 (6/2011): S35-S41. Huhta, A-P. & Korpela, L Permanent vegetation quadrats on Olkiluoto Island. Establishment and results from the first inventory. Posiva Oy, Working Report p. Ikonen, A.T.K Meteorological data of Olkiluoto in period of Posiva Oy, Working Report p.
77 69 Ikonen, A.T.K Environmental radioactivity data of Olkiluoto in Posiva Oy, Working Report p. Ikonen, A.T.K Meteorological data of Olkiluoto in period of Posiva Oy, Working Report p. Ikonen, A.T.K. 2007a. Meteorological data and update of climate statistics of Olkiluoto, Posiva Oy, Working report p. Ikonen, A.T.K., Kaapu, J., Lehtonen, K., Mattila, J., Räisänen, R., Sauvonsaari, J. & Turkki, H Environment studies in the Olkiluoto area. Posiva Oy, Working Report p. Julin, S. (ed.) Varautuminen säteilytilanteisiin ja poikkeavat tapahtumat. Kolmannesvuosiraportti 3/2017 (in Finnish: Preparation for radiation situations and deviating incidents. Report for 3/2017). Radiation and Safety Authority. STUK-B 221, 11 p. Kangasniemi, V., Helin, J., Kirkkala, T. & Ikonen, A.T.K Concentration ratios to aquatic plants at and near Olkiluoto repository site. Full paper, International Conference on Radioecology & Environmental Radioactivity: Environment & Nuclear Renaissance, June 2011, Hamilton, Ontario. Radioprotection 46 (6/2011): S29-S34. Kangasniemi, V. & Helin, J Studies on the Aquatic Environment at Olkiluoto and Reference Area:1. Olkiluoto, Reference Lakes and Eurajoki and Lapijoki Rivers in Posiva Oy, Working Report p. Kersalo, J. & Pirinen, P Suomen maakuntien ilmasto (in Finnish: The climate of Finnish regions). Ilmatieteenlaitos. Raportteja 2009: p. Koivunen, S Eurajoen ja Eurajoensalmen tarkkailututkimus. Vuosiraportti (in Finnish: Monitoring of the River Eurajoki and Eurajoensalmi Bay. Annual report 2014). Lounais-Suomen vesi- ja ympäristötutkimus Oy. No p. + App. Koivunen, S Eurajoen ja Eurajoensalmen tarkkailututkimus. Vuosiraportti (in Finnish: Monitoring of the River Eurajoki and Eurajoensalmi Bay. Annual report 2014). Lounais-Suomen vesi- ja ympäristötutkimus Oy. No p. + App. Koivunen, S. & Saarikari, V Eurajoen ja Eurajoensalmen tarkkailututkimus. Vuosiraportti (in Finnish: Monitoring of the River Eurajoki and Eurajoensalmi Bay. Annual report 2015). Lounais-Suomen vesi- ja ympäristötutkimus Oy. No p. + App. Koivunen, S Eurajoen ja Eurajoensalmen tarkkailututkimus. Vuosiraportti (in Finnish: Monitoring of the River Eurajoki and Eurajoensalmi Bay. Annual report 2016). Lounais-Suomen vesi- ja ympäristötutkimus Oy. No p. + App.
78 70 Koivunen, S Eurajoen ja Eurajoensalmen tarkkailututkimus. Vuosiraportti (in Finnish: Monitoring of the River Eurajoki and Eurajoensalmi Bay. Annual report 2017). Lounais-Suomen vesi- ja ympäristötutkimus Oy. No p. + App. Komulainen, H Mangaani on terveysriski juomavedessä. Terveyden ja Hyvinvoinnin Laitoksen tiedote, Korhonen, K.T., Hirvelä, H., Lehtonen, A., Tuominen, S., Hyvönen, P., Balázs, A. & Aro, L State of forests on Olkiluoto island in Posiva Oy, Working Report , 82 p. Kumpumäki, T., Tuominen, J. & Lipping, T Remote sensing data analysis of the materials collected between Posiva Oy, Working Report , 110 p. KVVY Olkiluodon edustan merialueen fysikaalis-kemiallinen ja biologinen tarkkailu vuonna Vuosiraportti 2014 (in Finnish: The physiochemical and biological monitoring of nearby sea-area of Olkiluoto in 2017). Kokemäenjoen vesistön vesiensuojeluyhdistys ry, kirjenumero 173/18. Lehvola, H. & Ojala, T Olkiluodon biodiversiteettiselvitys. Teollisuuden Voima Oyj (in Finnish: Biodiversity survey of the Olkiluoto Island. Teollisuuden Voima Oyj). Ramboll Finland Oyj. 18 p. + App. Lepistö, L. (ed.) Kasviplanktonin tutkimusmenetelmät (in Finnish: Study methods of phytoplankton). Vesitalous. Vol. 2006, nro 1, p Miettinen, T. & Haapanen, R Vegetation types on Olkiluoto Island. Posiva Oy, Working Report p. Niemi, M. & Nieminen, M Game Statistics for the Island of Olkiluoto in Posiva Oy, Working Report p. Niemi, M. & Nieminen, M Game Statistics for the Island of Olkiluoto in Posiva Oy, Working Report p. Niemi, M. & Nieminen, M Game Statistics for the Island of Olkiluoto in Posiva Oy, Working Report p. Niemi, M. & Nieminen, M Game Statistics for the Island of Olkiluoto in Posiva Oy, Working Report p. Niemi, M., Nieminen, M. & Jussila, I Game Statistics for the Island of Olkiluoto in Posiva Oy, Working Report p. Niemi, M., Nieminen, M. & Jussila, I Game Statistics for the Island of Olkiluoto in Posiva Oy, Working Report p.
79 71 Nieminen, M Game statistics for the island of Olkiluoto in Posiva Oy, Working Report p. Nieminen, M. & Saarikivi, J Herpetofauna and small mammals on the island of Olkiluoto in Posiva Oy, Working Report p. Nieminen, M., Ikonen, H. & Koivunen, A Small mammals, ants, snails and earthworms on the island of Olkiluoto in Posiva Oy, Working Report p. Peltonen, H Olkiluodon edustan kalataloudellinen tarkkailu Teollisuuden voima Oyj. (in Finnish: Monitoring of the fishery on Olkiluoto offshore in Teollisuuden voima Oyj). Ramboll Finland Oy. 24 p. + App. Pere, T. (ed), Aro, L. & Tuohimaa, M Results of monitoring at Olkiluoto in Environment. Posiva Oy, Working Report p. Pere, T. (ed), Sojakka, T., Aro, L. & Lipping, T Results of monitoring at Olkiluoto in Environment. Posiva Oy, Working Report p. Pirinen, P., Simola, H., Aalto, J., Kaukoranta, J-P., Karlsson, P., & Ruuhela, R Climatological statistics of Finland Helsinki: Finnish Meteorological Institute, Climatic Statistics of Finland. Vol. 2012, no. 1, 96 p. Posiva 2003a. Baseline conditions at Olkiluoto. Posiva Oy. Posiva Report p. Posiva 2003b. Programme of monitoring at Olkiluoto during construction and operation of the ONKALO. Posiva Oy. Posiva Report p. Posiva 2013a. Monitoring at Olkiluoto a programme for the period before repository operation. Posiva Oy, Report p. Posiva 2013b. Olkiluoto Biosphere Description Posiva Oy, Report p. Posiva 2013c. Safety Case for the Disposal of Spent Nuclear Fuel at Olkiluoto - Biosphere Assessment Posiva Oy, Report p. Rautio, P., Latvajärvi, H., Jokela, A. & Kangas-Korhonen, P Forest resources on Olkiluoto Island. Posiva Oy, Working Report p. Ojala, S Olkiluodon edustan meri-alueen ammattikalastus ja vapaa-ajankalastajien kalastustiedustelu vuonna 2017 (in Finnish: Monitoring of the professional fishing in the sea areas near Olkiluoto in 2017). KVVY Tutkimus Oy. Tutkimusraportti nro 541/ p. Oravainen, R Vesistötulosten tulkinta Opasvihkonen (in Finnish: Interpretation of water sample results Guidebook). Kokemäenjoen Vesistön Vesiensuojeluyhdistys ry, 32 p.
80 72 Roikonen, T Olkiluodon alueen meri-alueen ammattikalastus vuonna 2015 (in Finnish: Monitoring of the professional fishing in the sea areas near Olkiluoto in 2015). Ramboll Finland Oy. 9 p. Roivainen, P Environmental radioactivity data of Olkiluoto in and Posiva Oy, Working Report p. Roivainen, P Stable elements and radionuclides in shoreline alder stands at Olkiluoto in Posiva Oy, Working Report p. Salo, V Results of Monitoring at Olkiluoto in 2011, Foreign materials. Posiva Oy, Working Report p. Santaharju, J., Helminen, S-L. & Yrjölä, R Eurajoki Olkiluoto study on species of ground beetles and ants Posiva Oy, Working Report p. Saramäki, J. & Korhonen, K State of the forests on Olkiluoto in Comparisons between Olkiluoto and the rest of Southwest Finland. Posiva Oy, Working Report p. Sojakka, T., Aro, L. & Lipping, T. 2018a. Results of monitoring at Olkiluoto in Environment. Posiva Oy, Working Report p. Sojakka, T., Aro, L. & Lipping, T. 2018b. Results of monitoring at Olkiluoto in Environment. Posiva Oy, Working Report p. Sosiaali- ja terveysministeriön asetus pienten yksiköiden talousveden laatuvaatimuksista ja valvontatutkimuksista (in Finnish: A decree on quality parameters and inspections of householdwater of small units) /401. Finlex. [Referred ] Turkki, H Olkiluodon lähivesien fysikaalis-kemiallinen ja biologinen tarkkailutukimus. Vuosiraportti 2013 (in Finnish: The physiochemical and biological monitoring of nearby waters of Olkiluoto. Annual report 2013). Lounais-Suomen vesija ympäristötutkimus Oy. No Turkki, H Olkiluodon lähivesien fysikaalis-kemiallinen ja biologinen tarkkailututkimus. Vuosiraportti 2014 (in Finnish: The physiochemical and biological monitoring of nearby waters of Olkiluoto. Annual report 2014). Lounais-Suomen vesija ympäristötutkimus Oy. No Turkki, H Olkiluodon lähivesien fysikaalis-kemiallinen ja biologinen tarkkailututkimus. Vuosiraportti 2015 (in Finnish: The physiochemical and biological monitoring of nearby waters of Olkiluoto. Annual report 2015). Lounais-Suomen vesija ympäristötutkimus Oy. No
81 73 Turkki, H Olkiluodon lähivesien fysikaalis-kemiallinen ja biologinen tarkkailututkimus. Vuosiraportti 2016 (in Finnish: The physiochemical and biological monitoring of nearby waters of Olkiluoto. Annual report 2016). Lounais-Suomen vesija ympäristötutkimus Oy. No Vuorio, M., Lamminmäki, T., Pitkänen, P., Penttinen, T., Komulainen, J., Loimula, K., Wendling, L., Partamies, S., Ahokas, T Results of Monitoring at Olkiluoto in 2016 Hydrogeochemistry. Posiva Oy, Working Report , 400 p. Yrjölä, R Birdstudies at Olkiluoto in Eurajoki, Romuvaara in Kuhmo, Hästholmen in Loviisa and Kivetty in Äänekoski in 1997 (in Finnish with an English abstract). Posiva Oy, Working Report p. Yrjölä, R Eurajoki Olkiluoto birdlife survey Posiva Oy, Working Report p.
82 74
83 75 APPENDIX A. LIST OF CHANGES IN SURFACE ENVIRONMENT MONITORING PROGRAMME In this appendix the list of all changes made to the surface environment monitoring programme is presented. Changes are derived to four tables according the main subjects of earlier reports (A-1.Evolution of geosphere, A-2. Biosphere modelling input data, A-3. Interaction between surface environment and groundwater in bedrock, A-4. Environmental impact). Table A-1. List of changes for geosphere related monitoring studies. Target Target parameters Timescale Change Reason for change Amount of water infiltrating into bedrock Amount of percolation water collected with lysimeters Continuous collection with sampling every 4 weeks during the nonfreezing period of each year Amount of collected percolation water removed from the program starting from Hydrological modelling does not need new data on amount of percolation water collected with lysimeters. Environmental regulations do not compel Posiva to monitor this parameter. In 2016 Posiva interprets that sufficient dataset has been acquired. Effects of final disposal to infiltrating percolation water are insignificant. Quality of water infiltrating into bedrock Analytical suite 1 (Table 7 2 in POSIVA ) from soil solution collected with lysimeters Chemistry of collected percolation water removed from the program starting from Hydrogeochemical modelling does not need new data on chemistry of percolation water collected with lysimeters. Environmental regulations do not compel Posiva to monitor this parameter. In 2016 Posiva interprets that sufficient dataset has been acquired. Effects of final disposal to infiltrating percolation water are insignificant.
84 76 Table A-2. List of changes for biosphere modelling related monitoring studies. Target Target parameters Timescale Change Reason for change Overburden Sorption properties of soil and sediment types Forests and mires Kd (Class G ) in occasion of CR sampling from each corresponding terrestrial and aquatic sampling plot Biomass and growth - trees tree measurements about every 10 (FET) or 5 (FIP) years tree growth measurement - litterfall amount (mass) and type - understorey plants coverage-% about every 10 (FET) or 5 (FIP) years - fine roots biomass distribution in soil layers continuous (hourly logging) Removed from the program starting from Removed from the program starting from Removed from the program starting from continuous, sampling Removed from the every 4 weeks (summer) program starting from or over the winter once from 3 plots per biotope class during the monitoring programme period - berries productivity Every two weeks during the season - mushrooms productivity weekly during the season Passive uptake sap flow continuous (hourly (transpiration) logging) Removed from the program starting from Removed from the program starting from Moved and changed. Moved and changed. Removed from the program starting from Data lock for biosphere modelling related to operational licence application at the end of Data lock for biosphere modelling related to operational licence application at the end of Data lock for biosphere modelling related to operational licence application at the end of Data lock for biosphere modelling related to operational licence application at the end of Data lock for biosphere modelling related to operational licence application at the end of Data lock for biosphere modelling related to operational licence application at the end of Moved to environmental impact from 2017 on. Moved to environmental impact from 2017 on. Used for calibrating the surface hydrological model, in 2016 Posiva interprets that sufficient dataset has been acquired.
85 77 Table A-2. continued Target Target parameters Timescale Change Reason for change Forests and mires Active uptake to forest and mire plants Translocation to wild berries and mushrooms Terrestrial and avian fauna CR to tree trunks, branches and twigs (Suite 3 ) CR to litter (Suite 3 ) CR to berries and fungal fruit bodies (Suite 3 ) on availability (falling of suitable trees for other reasons) combined samples from intensive monitoring to plots meet (seasonal the database - annual) target size by Removed from the program starting from Removed from the program starting from Removed from the program starting from Moved to the section "Environmental impact". - game catch game bag statistics annual Moved to the section "Environmental impact". - bird, rodent, invertebrate, amphibian and reptile populations - transport to food web CR in animal samples (human-edible, bones, liver, kidney, the rest) (Suite 4 ) Agriculture Uptake to crop plants CR to tree foliage, twigs and population size about every 10 years Moved to the section "Environmental impact". CR in edible and other parts of crop plants (Suite 3 ) to meet the database target size by to meet the database target size by in occasion of sampling for the other monitoring objectives Removed from the program starting from Removed from the program starting from Removed from the program starting from Data lock for biosphere modelling related to operational licence application at the end of Data lock for biosphere modelling related to operational licence application at the end of Data lock for biosphere modelling related to operational licence application at the end of Data lock for biosphere modelling related to operational licence application at the end of Data lock for biosphere modelling related to operational licence application at the end of Data lock for biosphere modelling related to operational licence application at the end of Data lock for biosphere modelling related to operational licence application at the end of Data lock for biosphere modelling related to operational licence application at the end of Data lock for biosphere modelling related to operational licence application at the end of 2016.
86 78 Table A-2. continued Target Target parameters Timescale Change Reason for change Aquatic ecosystems Sea water quality - hydrogeochemical characterisation Class C (hydrogeochem., Section ) every 3 years - sea water quality Key elements (Suite 5 ) 3 times during the open water season - suspended solids Kd (Suite 2 ) occasions during the monitoring period River discharge and water quality - basic water chemistry EC, ph, P tot, Al, Fe, Mn, NH 4, SiO 4, humus, TDS, turbidity, colour, hardness every 1 week to 3 months depending on parameter (by the nuclear power plant) - suspended solids Kd (Suite 2 ) occasions during the monitoring period Erosion and sedimentation Aquatic vegetation biomass changes in bottom topography green laser scanning about every 10 years No changes No changes Removed from the program starting from No changes No changes Removed from the program starting from Removed from the program starting from Data lock for biosphere modelling related to operational licence application at the end of The data is acquired by TVO anyway, it does not need further actions from Posiva. The data is acquired by TVO anyway, it does not need further actions from Posiva. Data lock for biosphere modelling related to operational licence application at the end of Data lock for biosphere modelling related to operational licence application at the end of primary production primary production, phytoplankton species and biomass about every 3 5 years Removed from the program starting from aquatic plants biomass about every 5 10 years Removed from the program starting from Data lock for biosphere modelling related to operational licence application at the end of Data lock for biosphere modelling related to operational licence application at the end of 2016.
87 79 Table A-2. continued Target Target parameters Timescale Change Reason for change Aquatic ecosystems Uptake to aquatic vegetation CR to phytoplankton and macrophytes Aquatic fauna - bottom fauna populations biomass, number of individuals - fish catch test fishing and interviews with fishermen - transport to plankton CR to plankton (Suite 6 ) - transport to bottom fauna CR to bottom fauna and plankton (Suite 7 ) - transport to fish CR to edible and other parts of fish (Suite 7 ) about every 5 10 years every 5 10 years every 2 5 years according to the nuclear power plant programme every 3 5 years every 5 10 years every 3 5 years Removed from the program starting from Moved to the section "Environmental impact". Data lock for biosphere modelling related to operational licence application at the end of No changes Removed from the program starting from Removed from the program starting from Removed from the program starting from Data lock for biosphere modelling related to operational licence application at the end of Data lock for biosphere modelling related to operational licence application at the end of Data lock for biosphere modelling related to operational licence application at the end of Data lock for biosphere modelling related to operational licence application at the end of 2016.
88 80 Table A-3. List of changes for groundwater and surface environment related monitoring studies. Target Target parameters Timescale Change Reason for change Interaction between surface environment and groundwater in bedrock Changes in infrastructure and other land use Aerial photograph Bi-annually Changed from annually to Biannually. In the timetable of POSIVA this was set to be done bi-annually, however in the tables it was said that it was annually, now in this memo this is locked to every second year. Forest management actions; dredging and reed cutting Information on planned and ongoing changes Recording on occasion, authority registries and interview annually No changes Surface water runoff Discharge in ditches Hourly No changes Weather observations Snow cover Ground frost Those in Table 6 of this Appendix. Nuclear power plant's weather observations Precipitation throughfall and interception Thickness, water content Depth of top and bottom of frost layer See Table 6 in this Appendix. Hourly Continuous collection, analysed in 2- or 4-week batches (summer/winter) Weekly during the season Weekly during the season See Table 6 in this Appendix. No changes Removed from the program starting from No changes No changes Rainwater isotopes 18 O, 2 H, 3 H Monthly Removed from the program already in Transpiration Information on planned and ongoing changes Land use grid Recording on occasion, interview annually Bi-annual update See Biosphere modelling input data (Section in POSIVA ), Passive uptake No changes Changed from See above. annual to Bi-annual. Removed from the program starting from In 2016 Posiva interprets that sufficient dataset has been acquired and further monitoring of this parameter is not seen to serve any purpose. Described in Working Report Used for calibrating the surface hydrological model, in 2016 Posiva interprets that sufficient dataset has been acquired.
89 81 Table A-3. continued (weather parameters) Target Target parameter Positioning Frequency Change Reason for change Weather monitoring Air temperature, relative humidity, pressure Soil temperature 2 m (ground level), temperature also under and over the tree canopy on a Several depths covering expected variation of ground frost No changes. Removed from the program starting from from 10-minute Precipitation Under tree canopy No changes. observations Wind speed and Above tree canopy No changes. direction on a single plot Solar radiation and Photosyntetically active radiation Above tree canopy on a single plot Hourly mean, minimum and maximum values No changes. In 2016 Posiva interprets that sufficient dataset has been acquired.
90 82 Table A-4. List of changes for environmental impact related monitoring studies. Target Target parameters Timescale Change Reason for change Environmental impact physical environment Noise Dust from rock crushing and piling Noise level (db A, 10- minute average) 2 times a year No changes Wet deposition: Suite 1 Suite 2 Automated weirs: discharge, ph, EC, water temperature Continuous collection with sampling 1 2 times a month (summer winter) Every 2 nd year Hourly sensor observations Removed from the program starting from Removed from the program starting from See above. Redox monitoring removed from 2017 on. In 2016 Posiva interprets that sufficient information on insignificant level of effects caused by the rock dust from Posiva's activities has been acquired in order to cease regular monitoring of this parameter. In future all effects to biota will be monitored through biodiversity studies done on 10 year intervals. It is seen in 2016 that measuring redox-values from the surface ditches does not offer any data that would be of Posiva's interest. Effluent water Automated weirs: Suite 1 Water samples 3 times a year No changes Ditch OL-DI14 from the rock and earth piling area and OL-EP5 shallow groundwater hole: Suite 1, suspended solids ONKALO outlet water, sedimentation pool (OL- PO) (Class A) Water samples 3 times a year No changes Water samples 4 times a year, weekly surveillance of ph and EC. Moved from "Foreign materials". Outlet ditch for ONKALO process water: Suite 1 (OL- DI1 & 15) Water samples 4 times a year No changes Discharge tube for ONKALO process water (OL- DI1): the weekly set of EC, ph, sodium fluorescein Weekly No changes Reorganization of tasks.
91 83 Table A-4. continued Target Target parameters Timescale Change Reason for change Environmental impact nature and natural resources Vegetation cover Vegetation biodiversity Once in 10 years Natural resources (berries, mushroom) Vegetation biodiversity Annually Game catch Game bag statistics Annually Animals Fauna biodiversity Once in 10 years Several earlier vegetation related separate studies combined to a vegetation biodiversity study done once in 10 years. Reorganization of tasks. Removed from the program as such and switched to be done in connection with the biodiversity studies done on 10 year intervals. Reorganization of tasks. Changed from Biosphere modelling input data to Environmental impact data Several earlier faunarelated separate studies combined to a fauna biodiversity study done once in 10 years. Reorganization of tasks. Reorganization of tasks. Household water quality Standard household water quality parameters, radon Once a year No changes Changed because of practical reasons. Household water yield Water level in the well Three times a year Baseline of radiation effects on the environment To be developed - see the text Methodological study at the beginning of the monitoring period; later possible sampling based on the outcome of the study Changed from 4 to 3 times a year. Removed from the program starting from Literature study already written on monitoring possibilities concerning radiation effects in the environment (WR ). Based on the study, it is not possible to monitor radiation effects even with the maximum expected levels of radioactive release from Posiva's facilities during operation.
92 84
93 85 APPENDIX B. LIST OF MONITORING LOCATIONS In this appendix, the monitoring locations and Posiva s codes for them are presented. Prefix OL- is to be used of the locations situated in Olkiluoto, but omitted here for readability. Table B-1. Monitoring sites, their codes and descriptions. Sampling site type(s) Code Former code Name Water quality DI1 ONK-DITCH ONKALO discharge tube DI02 Ditch, MP1 upper side DI03 Ditch, MP2 upper side DI04 TMA58 MP3, ditch DI05 TMA60 MP4, ditch DI06 TMA08 OL, waste dump, northernmost ditch DI07 TMA09 OL, waste dump, ditch DI08 TMA57 Rummintie, ditch DI09 TMA62 Puulunkulma, ditch DI10 TMA61 FIP10, ditch DI11 TMA63 Puulu, ditch DI12 TMA64 Nurmi, ditch DI13 TMA65 Myllysalmi, ditch DI14 EP5 ditch Ditch running from rock piling and crushing area DI15 Point 4 Downstream from DI1, intersection of Satamatie road DI16 Point 3 Downstream from DI1 DI17 Point 2 Downstream from DI1 DI18 3 meters downstream from DI1 DI19 North of rock piling area DI20 Ditch running to Flutanperä, at Olkiluoto road crossing Drilled well (private) DWH1 W1 Tyrniranta DWH2 W2 Majahamina DWH3 W3 Hirvikallio DWH4 W4 Hilakari (Not in use any longer) DWH5 Laakso Waterfowl counting point 1997 FAL01 Shore of accommodation village and 2008 FAL02 End of outlet ditch near wastedump FAL03 Tyrniemi FAL04 Shore between Munakari and Mäntykari FAL05 Marinkarinnokka FAL06 Harbour FAL07 Shore opposite of Kornamaa FAL08 Syöpävesi FAL09 Santalahti FAL10 Southern end of Liiklankari FAL11 Shore of Liiklankallio Waterfowl counting point of 1997 FAL12 Currently shore of OL3 Carabid beetles inventory FAL13 Nature conservation area 2004 FAL14 Commercial conifer forest FAL15 Cutting area with birches standing FAL16 Luxuriant black alder forest at Rumminperä
94 86 Table B-1 cont d. Monitoring sites, their codes and descriptions. Sampling site type(s) Code Former code Name Small animal quatrat 2004 FAL17 Old Norway spruce forest 1 FAL18 Old Norway spruce forest 2 FAL19 Coniferous forest near the old forest FAL20 Cutting area FAL21 Commercial forest 1 FAL22 Commercial forest 2 FAL23 Luxuriant black alder forest at Rumminperä FAL24 Seashore meadow FAL25 Abandoned field FAL26 Hayfield FAL27 Commercial forest near shore Waterfowl counting point of 2008 FAL28 FAL12 moved, shore of central office Waterfowl counting point of 1997 FAL29 Southeast of Kornamaa and 2008 FAL30 Itäranta, landfill northern side FAL31 Itäranta, landfill southern side FAL32 Ilavainen bridge, northern side FAL33 Ilavainen bridge, southern side FAL34 Small animal quatrat 2008 FAL35 Clear-cut area on the eastern side FAL36 Field of Olkiluoto farm FAL37 Field of drilling site FAL38 Western field in Korpi FAL39 Birch stand at Rumminperä FAL40 Birch stand at Itäranta FAL41 Norway spruce stand by the end of the road in Santalahti FAL42 Western Norway spruce stand by the conservation area FAL43 Norway spruce stand by the road in Santalahti FAL44 Norway spruce stand by Satamatie FAL45 Crossing of Rummintie road FAL46 Alder stand at Rumminperä FAL47 Scots pine stand next to the western field of Korpi FAL48 Scots pine stand in Korpi FAL49 Shore meadow by the Olkiluoto bridge FAL50 Shore meadow in Savilahti FAL51 Mixed stand by the road of Santalahti FAL52 Mixed stand close to MRK1 Carabid beetles inventory 2008 FAL53 Birch stand in Rumminperä FAL54 Birch stand by Satamatie FAL55 Between fallow fields FAL56 Mixed stand by the road in Santalahti FAL57 Norway spruce stand by the road in Santalahti FAL58 Norway spruce stand by Satamatie FAL59 Ulkopää FAL60 Alder stand in Rumminperä FAL61 Fallow field FAL62 Eastern field of Raunela Bird inventory transect of FAT01 Ulkopää 1997 and 2008 FAT02 Flutanperä Selkänummenharju FAT03 Selkänummenharju FAT04 Olkiluoto FAT05 Liiklankallio FAT06 Korpi
95 87 Table B-1 cont d. Monitoring sites, their codes and descriptions. Sampling site type(s) Code Former code Name Bat inventory transect of FAT07 Ulkopää 2004 and 2008 FAT08 Outlet channel FAT09 Selkänummenharju FAT10 Munakari FAT11 Flutanperä FAT12 Liiklankallio FAT13 Itäranta (road to Kornamaa) FAT14 Satamatie road FAT15 Karhunkarinrauma reedbeds Bird inventory transect of 2008 FAT16 Kangas FAT17 Ilavainen FET sampling plot FEH FEH Forest inventory, sampling, FEH Liiklanperä radioactivity (vegetation, soil, FEH Black alder plot at switchyard small fauna, earthworm 2005) FEH Tyrniemi Base grid for sampling/forest inventory 2005 FET FET Radioactivity (fish) FIA01 Fishing area F1 ( ) FIA02 Fishing area F2 ( ) FIA03 Fishing area F1 (1980) FIA04 Fishing area F2 (1980) FIA05 Lippo fishing area FIA06 Susikari southern shore FIA07 F1 Fishing area F1 (before 1993) FIA08 F2 Fishing area F2 (before 1993) FIA09 F1r Reserve fishing area 1 FIA10 F2r Reserve fishing area 2 FIA11 FI Fishing area FI (Iso Kaalonperä) FIA12 FII Fishing area FII (Munakari) Fishery survey FIA13 Account fishing sub-area A FIA14 Account fishing sub-area B FIA15 Account fishing sub-area C FIA16 FIA17 FIA18 Test fishing FIA19 Test fishing area 1 (1997, 2006, 2010) FIA20 Test fishing area 2 (1997, 2006, 2010) FIA21 Test fishing area 3 (1997, 2006, 2010) Radioactivity (fish) FIA22 Fishing area 0 3 km (2008 ) FIA23 Fishing area 3 10 km (2008 ) Forest intensive FIP04 IP4 Liiklankallio Scots pine stand Monitoring FIP10 IP10 Liiklanperä Norway spruce stand FIP11 Liiklanoja seedling stand FIP14 Ulkopää FIP15 Ilavainen pine mire FIP16 Ilavainen rocky forest Quaternary deposit studies KK1 KK24 Deep excavator pit Snow line LL1(old) LL2 (present) Ground frost measurement LM1 LM2 LM3 LM4 LM5 LM6 LM7 LM8 LM9 LM10 LM11 Water quality MP1 MP4 Measuring weirs
96 88 Table B-1 cont d. Monitoring sites, their codes and descriptions. Sampling site type(s) Code Former code Name Forest deposition MRK01 MRK02 MRK03 MRK04 (inside FIP04) MRK05 MRK06 MRK07 MRK08 MRK09 MRK10 (inside FIP10) MRK11 (inside FIP11) MRK12 MRK13 MRK14 (inside FIP14) MRK15 (inside FIP15) MRK16 (inside FIP16) MRK93 MRK3 Old location MRK94 MRK4 Old location MRK95 MRK5 Old location MRK96 MRK6 Old location Environmental noise, NMP01 Nousiainen, northern shore NMP02 Kuusisenmaa, eastern end NMP03 Leppäkarta NMP04 NMP05 OL3 support area inside power plant area NMP06 OL3 constr. site / gate to guest sauna NMP07 NMP08 OL3 support area inside power plant area NMP09 NMP15 OL3 construction site NMP16 NMP18 Power plant area NMP19 NMP01 Inlet channel of OL1, trash rack NMP20 NMP23 Power plant area NMP24 NMP02 Middle of training centre and swicthyard NMP25 NMP30 Power plant area NMP31 NMP04 Between OL1/OL2, waterworks level NMP32 NMP35 Power plant area NMP36 NMP41 Rock piling and crushing area NMP42 NMP45 ONKALO excavation site NMP46 NMP03 Raunela/Luoto crossroads NMP47 Green ice buoy at Olkiluodonvesi NMP48 OL3 harbour NMP49 OL3 parking lot NMP50 near OL3 truck gate NMP51 West end of the main gatehouse NMP52 Satamatie road, opposite to ONKALO NMP53 Outer patio of Visitor Centre NMP54 OL1 harbour bank NMP55 Northern border of Natura area, hole L15 NMP56 Parking area of Visitor Centre Nature survey 1997 NSS01 NSS49 Survey square Precip. chemistry (1990s) PCC01 Snow chemistry (1990s) PCC02 Precipitation chemistry PCC03 Precipitation sampler for isotope studies Quaternary deposit studies RK1 RK5 Shallow grain size pit
97 89 Table B-1 cont d. Monitoring sites, their codes and descriptions. Sampling site type(s) Code Former code Name Radioactivity Soil gamma RNM01 AH Ahtola Aerosol RNM02-AS1 KU (KUa) Kuivalahti aerosol sampler Deposition RNM02-DC1 KU (KUa) Kuivalahti Aerosol RNM03-AS1 HA Hankkila aerosol sampler Deposition RNM03-DC1 HA Hankkila deposition collector 1 Deposition RNM03-DC2 HA Hankkila deposition collector 2 (rain water) Aerosol RNM04-AS1 HS Haapasaari aerosol collector Deposition RNM04-DC1 HS Haapasaari deposition collector Drinking water RNM05-DW1 RA Rauma waterworks Deposition RNM06-DC1 WM Weather mast collector 1 Deposition RNM06-DC2 WM Weather mast collector 2 (rain water) Aerosol RNM07-AS1 KO Korvensuo aerosol sampler Drinking water RNM07-DW1 KO Korvensuo drinking water Sea biota RNM08 Kpb, SBP01 Kalliopöllä (now OL-SEA53) Sea biota RNM09 KA, SBP02 Kaalonpuhti shoal (now OL-SEA52) Bladderwrack RNM10 IP, SBP03 Iso-Pietari (now OL-SEA54) Bladderwrack RNM11 VE, SBP04 Vähäkrunnit (now OL-SEA56) Water sampling/reservoir RS1 TMA06 Korvensuo reservoir River Eurajoki monitoring RWS01 Bridge of Pori Rauma main road River Lapinjoki monitoring RWS02 Ylinenkoski discharge River Eurajoki monitoring RWS03 Bridge of Vuojoki manor RWS04 Hanging bridge, Tiironkoski RWS05 Bridge, centre of Eurajoki RWS06 Bridge, River Eurajoki River Lapinjoki monitoring RWS07 Museum bridge, River Lapinjoki RWS08 Bridge, River Lapinjoki, Hankkila RWS09 Bridge, River Lapinjoki, Heinilä Other river monitoring RWS10 Sorkka, big outlet ditch to Sorkanlahti bay River Lapinjoki monitoring RWS11 Bridge, River Lapinjoki, Orjansaari River Eurajoki monitoring RWS12 RWS13 Laukola RWS14 RWS15 Panelia RWS16 Huhta RWS17 Lavila RWS18 Tuiskula RWS19 RWS20 Eura 12 Kautt yp va670 River Lapinjoki monitoring RWS21 Lapi 8 Uki Eura RWS22 Lapi 16 Murtamo RWS23 Lapi 26 r-r dam River Eurajoki monitoring RWS24 Pappilankoski Discharge RWS25 Pyhäjärvi discharge site River Lapinjoki monitoring RWS26 Myllysilta River Eurajoki monitoring RWS27 Kauttua rapid RWS28 Eura 16 Rauma-Lkylä RWS29 Eura 22, Kuurnamäentie road RWS30 Eura24, leather factory RWS31 Eura 34, Vänni bridge RWS32 Eura 32, downstream of Köyliönjoki RWS33 Eurakoski rapid RWS34 Paneliankoski rapid (electrofishing location) RWS35 Saharinkoski rapid RWS36 Irjanteenkoski rapid RSW37 Suutalankoski rapid RWS38 Nolponkoski rapid
98 90 Table B-1 cont d. Monitoring sites, their codes and descriptions. Sampling site type(s) Code Former code Name Sea bottom vegetation SBT01 Pier, transect A Transect SBT02 Otpää, transect B SBT03 Shoal, transect C SBT04 Kuusinen, transect D SBT05 Susikari, transect E SBT06 Reimargrund, transect F SBT07 Pihlavakari, transect G SBT08 Puolivesikarta northern shore SBT09 Iso-Susikari inner bay SBT10 Kalla southern shore SBT11 Kalla northern shore SBT12 Iso-Pyrekari Sea bottom vegetation and SBT13 Alleco sediment transect SBT14 Alleco SBT15 Alleco SBT16 Alleco SBT17 Alleco SBT18 Alleco 5B 2008 Sea water quality transect SBT19 Luode Verkkokari Kalla SBT20 Luode Laukkari Rannankulma SBT21 Luode Marikarinnokka Vähäniemi Sea bottom vegetation transect SBT22 Pohjan Bokreivi SBT23 Puumaskali southern shore SBT24 Iso Pihlavakari SBT25 Kylmä Santakari SBT26 Pihluksen Säikkä SBT27 Nurmes SBT28 Isokrunni SBT29 Islet of Etelän Bokreivi, west Shoreline vegetation and SBT30 Munakari sediment transect SBT31 Kornamaa Water chemistry SEA01 ER Eteläriutta SEA02 PK Puskakari SEA03 RK, SU, 525 Susikari (Rääpinkivet) SEA04 ES, 490 Pitkäkarinkulma Water quality etc. SEA Liiklankari SEA Kuusinen SEA Puskkari SEA Ulkopää SEA Mouth of Eurajoensalmi Bay SEA Pyrekari Radioactivity Seawater SEA11 IKa Iso Kaalonperä A Seawater, sediment, SEA12 LL Lippo (Liponluoto) suspended, sea biota Seawater SEA13 KPa Kalliopöllä (Pussikari) Sediment SEA14 OV Olkiluodonvesi Sediment SEA15 TA Tankarit Seawater, sea biota SEA16 IS Iso-Siiliö Sediment, sea biota SEA17 IKb Iso Kaalonperä B Sediment, suspended SEA18 VK Vähä Kivikkokari Sediment SEA19 PF Piskerfäärti Seawater, suspended SEA20 SA Santakari Sediment SEA21 KK Kaksoiskivet Sediment SEA22 HV Haapasaarenvesi Sediment SEA23 KJ Kuuskajaskari
99 91 Table B-1 cont d. Monitoring sites, their codes and descriptions. Sampling site type(s) Code Former code Name Water quality SEA24 SEA25 Kaunissaari north SEA26 Sorkanlahti SEA27 SEA28 SEA29 Haapasaarenvesi SEA30 SEA31 Water quality shore SEA32 Ulkopää bird tower SEA33 Olkiluodontie, bridge SEA34 Olkiluoto east, under powerlines SEA35 Mustalahti SEA36 Siikluomantie, pier SEA37 Bridge, Varttikarinsuntti Test fishing SEA38 SBP05 Fyke net, Iso-Siiliö SEA39 SBP06 Fyke net, Susikari N SEA40 SBP07 Fyke net, Susikari SE SEA41 SBP08 Fyke net, Pyrekari SEA42 SBP09 Fyke net, Uskalinmaa SEA43 SBP10 Fyke net, Pujonsärkkä SEA44 SBP11 Fyke net, Marskinkarit Radioactivity Sea water SEA45 SEA11 Iso Kaalonperä 13 Sea water SEA46 SEA12 Liponluoto 2 Sea water, suspended SEA47 Rääpinkivet 3 sediment Sea water, suspended SEA48 SEA20 Santakari 15 sediment Sea water SEA49 Viikari 16 Sea water SEA50 Kylmäpihlaja 17 Perifyton SEA51 Iso Kaalonperä Bladderwrack, blue mussel, sediment SEA52 SBP02, KA A Kaalonpuhti shoal Bladderwrack SEA53 SEA13, SBP01, B Kalliopöllä KPb Bladderwrack SEA54 SBP03, IP C Iso-Pietari Bladderwrack SEA55 SEA16 D Iso-Siiliö Bladderwrack SEA56 SBP04, VE E Vähäkrunnit Bladderwrack SEA57 F Kylmäpihlaja Bladderwrack SEA58 G Viikari Fennel pondweed, Spiked SEA59 Iso Kaalonperä water mil-foil Bladderwrack SEA60 Olkiluoto 9 Macoma balthica SEA61 A Kaalonpuhti shoal Suspended sediment SEA62 SEA16 Tankarit 4 Suspended sediment SEA63 SEA18 Vähä Kivikkokari 12 Suspended sediment SEA64 Keskivedenkari 18 Suspended sediment, blue SEA65 Lutkloppi 19 mussel Sediment SEA66 Olkiluoto 1 Sediment SEA67 Olkiluoto 2 Sediment SEA68 Olkiluoto 4 Sediment SEA69 Olkiluoto 5 Sediment SEA70 Olkiluoto 9 Sediment SEA71 Olkiluoto 12 Sediment SEA72 Olkiluoto S5 Sediment SEA73 Olkiluoto S6 Sediment SEA74 Olkiluoto S8 Spiked water-milfoil SEA75 Kaunissaari
100 92 Table B-1 cont d. Monitoring sites, their codes and descriptions. Sampling site type(s) Code Former code Name GTK 2008 Sediment SEA76 MGGN SEA77 MGGN SEA78 MGGN SEA79 MGGN SEA80 MGGN SEA81 MGGN SEA82 MGGN SEA83 MGGN SEA84 MGGN SEA85 MGGN SEA86 MGBC SEA87 MGBC SEA88 MGBC Radioactivity (blue mussel) SEA89 Rihtniemi Luode Oy, automatic monitoring SEA90 Olkiluoto dockyard, breakwater (suspension, wave power) SEA91 Verkkokari, breakwater Water quality SEA92 Marskinkarit (N) Test fishing SEA93 Levätys SEA94 Leppäkari Bottom fauna sampling SEA95 Rauma (reference area) SEA96 Pyhämaa SEA97 Pyhämaa SEA98 Pyhämaa Water quality SEA99 Rauma (reference area) SEA100 Pyhämaa Bottom fauna sampling SEA101 Eurajoensalmi Bay SEA A Puskkari (SEA07 shifted) Water quality SEA103 Kornamaa (bridge) SEA104 Munakari (bridge) SEA105 ONKALO end of outlet ditch SEA106 Southern side of the bridge of Olkiluoto SEA107 Southern side of the bridge of Olkiluoto SEA108 South of Vähäkari Ilavainen bridge SEA109 Syöpävesi/Liaskari SEA110 Flutanperä bridge Luode Oy, automatic monitoring current meter SEA111 Eurajoensalmi Bay, sea station Suspension SEA112 Kaunissaari Island Radioactivity Sediment SEA113 Keskivedenkari 18B Spiked water mil-foil SEA114 Aikonmaa Blue mussel SEA115 Vähä-Pihlavakari Bladderwrack SEA116 Isokrunnit Bladderwrack SEA117 Porhovare NE Bottom fauna SEA121 Moved location of SEA09 for bottom fauna Seawater SEA122 Halkokari A Bladderwrack SEA123 Reimargrund Study on baseline condition of SMA66 Olkiluoto nearby sea area fish fauna 1975; flow-through study by Luode 2008 Fish reproduction SMA66-OA# Fish reproduction counting sector Fish SMA66-OP# Fyke/net Bedrock properties TK 1 19 Investigation trench Spring TMA01 Pistola TMA02 Kaukenpieli Well TMA03 Varvinnokka TMA04 Helmiranta Bat inventory area of TMA05 Nature conservation area others Spring TMA07 Koivukari TMA10 Infiltration test area
101 93 Table B-1 cont d. Monitoring sites, their codes and descriptions. Sampling site type(s) Code Former code Name Waterfowl counting sector 1997 TMA11 Associated to FAL01 TMA12 Associated to FAL02 TMA13 Associated to FAL03 TMA14 Associated to FAL04 TMA15 Associated to FAL05 TMA16 Associated to FAL06 TMA17 Associated to FAL07 TMA18 Associated to FAL08 TMA19 Associated to FAL09 TMA20 Associated to FAL10 TMA21 Associated to FAL11 TMA22 Associated to FAL12 Radioactivity Milk TMA23 Zone I (0 5 km from NPP) Milk TMA24 Zone II (5 10 km from NPP) Milk TMA25 Zone III (10 20 km from NPP) Grazing grass, milk, hair moss, TMA km from NPP garden products, mushrooms, wild berries, game Grazing grass, cereals, milk TMA km from NPP Milk, beef TMA km from NPP Hair moss TMA29 HA Hankkila forest Soil TMA30 Hankkila, soil sampling site Blackcurrant, lettuce, grass TMA31 HA Hankkila, Laaksonen farm Garden products TMA32 HA Hankkila, farm at Olkiluodontie crossing Garden products TMA33 LM Linnamaa farm Cereals TMA34 Vuojoki farm Fauna TMA34-DF Dead fauna Vuojoki Radioactivity Birch leaves/c-14 TMA35 LJ Lapijoki Wild berries TMA36 KS Kaalonpuhti N shore Needles, wild berries, TMA37 WM Weather mast area mushrooms Lichen, wild berries, TMA38 WN Weather mast N area mushrooms Soil, wild berries TMA39 MU Munakari Soil, wild berries TMA40 MU Munakari Mushrooms TMA41 MR Munakari road junction Soil TMA42 FL Flutanperä Wild berries, mushrooms TMA43 SR Santalahti road side Soil TMA44 LU Luonto farm Soil TMA45 IR Itäranta Radioactivity TMA46 OA Otpää area Hair moss TMA47 LK Liiklankari area Hair moss TMA48 SL Santalahti area Soil gamma, suppl. aerosol, TMA49 IL Ilavainen area birch leaves/c-14 TMA50 OL Olkiluoto Fauna TMA50-DF Dead fauna sample Olkiluoto TMA50-TR Finnish Forest Research Institute sample tree Olkiluoto Radioactivity (soil) TMA51 Maaselkä TMA52 Flutanperä N Radioactivity TMA53 Kaalonpuhti N shore, line 1 (shore transects 2005) TMA54 Kaalonpuhti N shore, line 3 TMA55 Kuusisenmaa, line 2 Radioactivity Mushrooms, blueberry TMA57 Kuusisenmaa Mushrooms TMA58 Korpi Water quality TMA59 Near OL harbour
102 94 Table B-1 cont d. Monitoring sites, their codes and descriptions. Sampling site type(s) Code Former code Name Radioactivity Berries TMA60 Powerplant parking area Moose meat TMA61 Marikari Deer meat TMA kw powerline Soil TMA63 Flutanperä 2 Others, for example TMA67 Reference area hyperspectral imaging in 2008 TMA68 Lake Suomenperänjärvi TMA69 Lake Koskeljärvi Vegetation (biomass, elements, TMA69-OA1 Reed bed area dimensions) TMA69-OA2 Yellow water lily area TMA69-OA3 Sparganium gramineum area TMA69-OA4 Sedge area TMA70 Lake Lutanjärvi Vegetation (biomass, elements, TMA70-OA1 Reed bed area dimensions) TMA70-OA2 Yellow water lily area TMA70-OA3 Sparganium gramineum area TMA70-OA4 Broad-leaved pondweed area TMA70-OA5 Bulrush area TMA71 Lake Poosjärvi Vegetation (biomass, elements, TMA71-OA1 Sedge dimensions) TMA71-OA2 Bulrush TMA71-OA3 Water horsetail TMA71-OA4 Yellow water lily TMA71-OA5 Common reed TMA71-OA6 Broad-leaved pondweed TMA71-OA7 Water horsetail TMA71-OA8 Yellow water lily TMA71-OA9 Yellow water lily TMA71-OA10 Bulrush TMA71-OA11 Sedge (reserve area) TMA71-OA12 Common reed (reserve area) TMA72 Lake Lampinjärvi TMA73 Lake Kivijärvi Vegetation (biomass, elements, TMA73-OA1 Yellow water lily area dimensions) TMA73-OA2 Yellow water lily area TMA73-OA3 Reed bed area TMA73-OA4 Bulrush area TMA73-OA5 Yellow water lily area TMA73-OA6 Sedge area TMA73-OA7 Sedge area TMA73-OA8 Sedge area TMA74 Lake Valkjärvi Vegetation (biomass, elements, TMA75 Western reed bed area at Kornamaa dimensions) TMA76 Western reed bed area at Munakari TMA77 Yellow water lily area at Olkiluoto TMA78 Club-rush area at Olkiluoto (northern) TMA79 TMA80 Lastensuo mire in Eurajoki Pesänsuo mire in Mellilä (Loimaa)
103 95 Table B-1 cont d. Monitoring sites, their codes and descriptions. Sampling site type(s) Code Former code Name Vegetation (biomass, elements, TMA81 Kontolanrahka mire dimensions) TMA82 Korkeakoski farm (Rikantila) TMA82-OA1 Carrot area TMA82-OA2 Barley area TMA82-OA3 Potato area TMA82-OA4 Turnip area TMA82-OA5 Summer squash area TMA83 Laaksonen farm (Hankkila) TMA83-OA1 Lettuce area TMA83-OA2 Blackcurrant area TMA83-OA4 Redcurrant area TMA84 Eastern reed bed area at Kornamaa TMA85 Eastern reed bed area at Munakari TMA86 Reed bed area east of the harbour, near outlet of the ditch running from ONKALO TMA87 Reed bed area at Flutanperä TMA88 Area of water lilies at Olkiluoto TMA89 Club-rush area at Olkiluoto (southern) TMA90 Najas marina area at Olkiluoto TMA91 Aquatic plant area/diving study at Olkiluoto TMA92 Aquatic plant area/diving study at Olkiluoto TMA93 Aquatic plant area/diving study at Olkiluoto TMA94 Aquatic plant area/diving study at Olkiluoto TMA95 Puskakari TMA96 Häädetkeidas (Parkano) TMA97 Poosjoki TMA98 Lake Säkylän Pyhäjärvi TMA99 Lake Narvijärvi Radioactivity Berries TMA100 Kuusinen Radioactivity (exposure rate) TVO01 PI Pier TVO02 WM Weather mast dosemeter TVO03 KO Korvensuo dosemeter TVO04 PN Pujonnokka (Pujo) TVO05 KUb Kuivalahti dosemeter (Ellilä) TVO06 LM Linnamaa TVO07 HA Hankkila dosemeter TVO08 TM Taipalmaa (Hummatus) TVO09 RE Reksaari TVO09 old AI Aikko TVO10 RA Rauma TVO11 OP Otpää Vegetation survey 2002 VCP Vegetation compartment polygon Nature survey TVO 5/05 VCP Nat. survey compartment polygon 1 13 Nature survey TVO 6/05 VCP Nat. survey compartment polygon 1 11 Weather WOM1 Weather mast, TVO WOM2 Weather mast next to FIP04 WOM3 Weather station at FIP10 WOM4 Weather station at FIP11 WOM5 Weather station at FIP14 Luode Oy, weather station WOM6 Olkiluoto dockyard, breakwater
104 96
105 97 APPENDIX C. RESULTS OF THE MONITORING OF LIMNIC SYSTEMS IN 2017 In this appendix, detailed results of monitoring of limnic systems in 2017 are presented. Table C-1 presents isotopes analysed of the water samples from River Eurajoki (OL- RWS04) and Korvensuo (OL-RS1) water reservoir. Table C-1. Isotope analysis results of water samples taken from Korvensuo water reservoir (OL-RS1) and River Eurajoki (OL-RWS04) in Deuterium and O-18 analyzed by the Geological Survey of Finland, tritium by Hydroisotop GmbH, ph and conductivity by TVO. OL-RWS04 OL-RWS04 OL-RS1 OL-RS1 Analysis unit Deuterium, H-2 o/oo VSMOW Oxygen, O-18 o/oo VSMOW Tritium, H-3 TU
106 98 Table C-2. Analysis results of water samples taken from,and river Eurajoki (OL-RWS04) and Korvensuo water reservoir (OL-RS1), analyzed by TVO and LSVSY. Sampling date: Location Location Analysis unit OL-RWS04 OL-RS1 Acetate mg/l <0.30 <0.30 Ammonium, NH4 mg/l 0.32 <0.02 Bicarbonate, HCO3 mg/l Bromide, Br mg/l 0.3 <0.20 Calc. Dissolved organic carbon mg/l Calcium, Ca mg/l Carbonate alkalinity, HCl uptake mmol/l <0.05 <0.05 Charge balance, calculated from HCO3 % Chloride, Cl mg/l Conductivity ms/cm Dissolved inorg. carbon mg/l Iron, Fe (total) mg/l Magnesium, Mg mg/l Nitrate, NO3 mg/l Nitrite, NO2 mg/l <0.10 <0.10 Nitrogen, (N) total mg/l Non Purgeable Organic Carbon mg/l Potassium, K mg/l Silicate, SiO2 mg/l Sodium fluorescein µg/l <1 <1 Sodium, Na mg/l Strontium, Sr mg/l Sulphate, SO4 mg/l Sulphur, S (total) mg/l Total acidity, NaOH uptake mmol/l 0.07 <0.05 Total alkalinity, HCl uptake mmol/l Total dissolved solids mg/l ph
107 99 APPENDIX D. RESULTS OF THE HYDROGEOCHEMICAL CHARACTERIZATION OF SEAWATER 1 GENERAL Posiva Oy is conducting a multidisciplinary monitoring programme at the Olkiluoto repository site in Eurajoki, Finland (Posiva 2012). As part of the environmental monitoring of the site, seawater samples are also taken. The first sea water samplings were collected from Eteläriutta and Puskakari (Figure D-1) by Posiva in 1989 and In August 2017 four seawater samples were collected from Baltic Sea at Olkiluoto site. The aim of the seawater sampling was to get data for the environmental monitoring of the repository site and for the potential connection between the sea and deep saline groundwater during long term pumping of the drillhole OL-KR6. The outlet waters from the underground research facility ONKALO and the future repository are pumped into the sea through a pipeline and a ditch. 2 SEAWATER SAMPLING Seawater samples were collected from four different sampling points (Eteläriutta, Puskakari, Susikari and Pitkäkarinkulma) in the front of Olkiluoto's island. Sampling points are the same from which the samples were collected in 2002 (Paaso 2003), in 2005 (Hirvonen 2006), in 2008 (Lamminmäki 2008), in 2011 (Lamminmäki 2011) and in 2014 (Weckman 2014). Locations of these sampling points are presented in Figure D-1 and coordinates as well as sampling depths in Table D-1.
 depths (m) OL-SEA01 Eteläriutta 6792500-1518400 10 OL-SEA02 Puskakari 6791400-1520970 10 OL-SEA03 Susikari")
108 100 Figure D-1. Seawater sampling points in Table D-1. Coordinates and sampling depths of sampling points. Sampling Sampling point Coordinates (KKJ1) depths (m) OL-SEA01 Eteläriutta OL-SEA02 Puskakari OL-SEA03 Susikari OL-SEA04 Pitkäkarinkulma
109 Sampling method Seawater samples were collected by POSIVA. Seawater is penetrating to the bedrock through bed sediment, and so the samples were collected with Limnos water sampler as near to the sea bottom as possible (approx. 1 m from sea bottom). 2.2 Analysed parameters and pretreatment of seawater samples The water samples were delivered directly to TVO s laboratory from the sampling sites. Most water analyses were carried out in TVO's laboratory in Olkiluoto according to the Posiva water sampling guide (Alho et al. 2017) or TVO's instructions and parameters specified in Posiva's monitoring programme (Posiva 2012). All the laboratory methods are based on standard methods or other generally accepted methods (Appendix 1). Isotope analyses were performed in several subcontractor laboratories. All the analysis methods, detection limits and the uncertainty of the measurements are shown in Appendix 1. 3 ANALYSIS RESULTS The ph values of seawater samples were slightly alkaline and varied from 7.6 to 7.9. The electrical conductivity of the samples varied from 970 to 990 ms/m. According to the Davis's and De Wiest's (1967) classification system water type was Na- Cl for all seawater samples as expected. The salinity of the seawater samples (Total Dissolved Solids, TDS) varied between 5510 mg/l and 5630 mg/l (Table D-2), and according to the TDS-classification (Davis 1964) water was brackish (1000 mg/l < TDS < mg/l). Temperature of seawater at sampling depth varied between 7.3 and 16 C (Table D-2). Similar temperatures was observed in sea water temperature monitoring during August Table D-2. TDS-values of seawater samples and temperature of sea water at sampling depth. Sampling point TDS (mg/l) OL-SEA01 Eteläriutta OL-SEA02 Puskakari OL-SEA03 Susikari OL-SEA04 Pitkäkarinkulma Temperature ( C) The analysis results of seawater samples, together with the calculated TDS value and the charge balance, are presented in Table D-3. The analysis methods and their accuracies are presented in Appendix 1. Analysis reports for each sampling point are presented in Appendix 2. The isotope results from earlier samplings are presented in Appendix 3.
110 102 Table D-3. Analysis results of seawater samples. Parameter Units OL-SEA01 OL-SEA02 OL-SEA03 OL-SEA04 Eteläriutta Puskakari Susikari Pitkäk. kulma POTTI-ID Sampling date TDS mg/l Charge balance % ph Conductivity ms/m Carbonate alkalinity, mmol/ HCl uptake L <0.05 <0.05 <0.05 <0.05 Total alkalinity, HCl mmol/ uptake L Total acidity, NaOH mmol/ uptake L 0.06 <0.05 <0.05 <0.05 Dissolved inorganic carbon mg/l Non purgeable organic carbon mg/l Ammonium, NH4 mg/l <0.02 Bicarbonate, HCO3 - mg/l Bromide, Br mg/l Calcium, Ca mg/l Chloride, Cl mg/l Fluoride, F mg/l Iron, Fe 2+ mg/l <0.01 <0.01 <0.01 <0.01 Iron, Fetot GFAAS mg/l <0.01 <0.01 <0.01 <0.01 Magnesium, Mg mg/l Manganese, Mn µg/l <0.006 <0.006 <0.006 <0.006 Nitrate, NO3 - mg/l <0.2 <0.2 <0.2 <0.2 Nitrite, NO2 - mg/l <0.1 <0.1 <0.1 <0.1 Nitrogen, Ntot mg/l Phosphate, PO4 mg/l <0.1 <0.1 <0.1 <0.1 Potassium, K mg/l Silicate, SiO2 mg/l Sodium, Na mg/l Strontium, Sr mg/l Sulphate, SO4 mg/l Sulphide, S 2- mg/l <0.02 <0.02 <0.02 <0.02 Sulphur, Stot mg/l
111 103 4 REPRESENTATIVITY OF LABORATORY ANALYSES 4.1 Charge balance The representativeness of the analyses can be estimated by the charge balance (CB) calculation. The charge balances of the groundwater samples were calculated as a percentage, using the equation 1: CB(%) = (Cations - Anions) / (Cations + Anions) x 100 (1) For this, concentration mg/l, has to be converted into meq/l with the equation 2: meq/l = c charge (1/M) (2) Where c = the concentration of the ion, mg/l, charge = the absolute valence number of ion, meq/mmol and M = the molecular weight of the ion, mg/mmol. The charge balance may vary a lot in dilute waters with low ph and no constant limit can be set for determination of acceptable CB values (Pitkänen et al. 2007). Therefore, converging CB value with increasing chloride concentration is in use for evaluation of Olkiluoto groundwater samples. Acceptable CB is from 10% to 5%, when chloride concentration is between 0 and 355 mg/l, then from 5% to 3%, when chloride concentration is between 355 and 3550 mg/l and 2%, when chloride concentration is over mg/l (Figure D-2). According to criteria all charge balance values were acceptable. Charge balance (%) OL-SEA Cl concentration (mg/l) Figure D-2. Charge balance values as a function of chloride concentration. Blue lines represent acceptable CB limits for Olkiluoto groundwater samples (Pitkänen et al. 2007).
112 Uncertainties of the laboratory analyses The quality of the analyses is checked with laboratory quality control (QC) samples and reference standard solutions. The assigned relative standard deviation (RSD) values are calculated from at least three parallel results. All RSD values are presented in analysis reports (Appendix 2). The RSD values were under 6% for all analyses in all samples, except for OL-SEA1(Eteläriutta) o Total nitrogen 0.25 mg/l, RSD 9 o Ammonium 0.02 mg/l, RSD 19 OL-SEA2 (Puskakari) o Total nitrogen 0.24 mg/l, RSD 14 OL-SEA3 (Susikari) o Total nitrogen 0.27 mg/l, RSD 8 Reason for all higher RSD values was nearness of detection limit of analysis, when even a small deviation between parallel results increases the RSD value. The dissolved inorganic carbon (DIC) concentrations and inorganic carbon concentrations calculated from alkalinity results are in good accordance, when all calculated values were 16.8 mg/l while measured values were 17 mg/l for all samples. 5 COMPARISON WITH EARLIER RESULTS Most important results from samplings in 1989, 1994, 2002, 2005, 2008, 2011, 2014 and 2017 are presented in Table D-4. The seawater sample from Pitkäkarinkulma was the least saline (TDS, total dissolved solids) (5510 mg/l), whereas the seawater from Puskakari was the most saline (5630 mg/l). Salinity has varied the most in Pitkäkarinkulma, between 5340 mg/l and 5880 mg/l and the least in Susikari, between 5570 mg/l and 5880 mg/l. Salinity has shown upward trend both in Susikari and Pitkäkarinkulma until sampling in 2011 and turned decreasing after that in all sampling points. In Puskakari the salinity was higher (5970 mg/l) in first sampling in 1989, but decreased to 5620 mg/l until 2002, and then again from top value of 5800 mg/l to 5630 mg/l again between 2008 and recent sampling in (Figure D-3a).
113 105 Chloride concentrations follow the changes in TDS. Concentration of chloride has varied the most, between 3020 mg/l and 3390 mg/l in Eteläriutta, whereas the smallest variation has been in Susikari between 3010 mg/l and 3170 mg/l. (Figure D-3b) Sulfate concentration of the Eteläriutta, Susikari and Pitkäkarinkulma decreased notably between 2011 and Also in Puskakari sulfate concentration increased, but more moderately than in other sampling points. In recent sampling sulfate concentration increased in all seawater sampling points. (Figure D-3c) Potassium concentrations had increasing trend in from 2002 until 2011 in all seawater sampling points. Between 2011 and 2014 concentrations decreased notably, but in recent sampling changes were minor (Figure D-3d). Concentration of calcium reached top values in Eteläkari (98 mg/l) in 2005 and in Puskakari (98 mg/l), Susikari (98 mg/l) and Pitkäkarinkulma (97 mg/l) in Since then, the concentrations have been decreasing in all sampling points. (Figure D-3e) Changes have been minor in magnesium, bromide and strontium as well as in sodium concentrations in all seawater sampling points.
114 106 a) b) c) d) e) Figure D-3 a) TDS, b) chloride, c) sulfate d) potassium and e) calcium concentrations of seawater samples during monitoring period.
115 107 Table D-4. Main analysis results of seawater samples during Sampli ng point Date TDS HC O 3 Br Cl SO 4 K Ca Mg Na Sr unit ddmmyy mg/l mg/l mg/l mg/l mg/l mg/l mg/l mg/l mg/l mg/l OL- SEA1 Eteläri utta OL- SEA2 Puskak ari Sampli Date TDS HCO 3 Br Cl SO 4 K Ca Mg Na Sr ng point unit ddmmyy mg/l mg/l mg/l mg/l mg/l mg/l mg/l mg/l mg/l mg/l OL- SEA3 Susikar i OL- SEA4 Pitkäka rinkulma
116 108 6 CONCLUSION Seawater compositions in four different sampling points are similar. The seawater sample from Pitkäkarinkulma was the least saline (5510 mg/l), whereas the seawater from Puskakari was the most saline (5630 mg/l). Water type was Na-Cl for all seawater samples as expected. Samples were slightly alkaline with ph value ranging between 7.6 and 7.9. Salinity has shown upward trend both in Susikari and Pitkäkarinkulma until sampling in 2011 and turned decreasing after that in all sampling points. Similar behavior as in TDS is seen in potassium and chloride concentrations in Pitkäkarinkulma and in Susikari. With the exception of sulfate and strontium concentrations, all other parameters in all sampling points have decreased in recent sampling.
117 109 7 REFERENCES Alho, P., Kontula, A., Lamminmäki, T., Mäkinen, V., Parviainen, L., Uusitorppa, T., Weckman, K. & Yli-Kaila, M Vesinäytteenoton kenttätyöohje -versio 5, Työraportti , Posiva Oy, Eurajoki. Davis, S.N The Chemistry of saline waters. IN: Krieger, R.A. Discussion Groundwater, vol 2 (1), 51. Davis, S.N. & De Wiest, R.J.M Hydrogeology, 2. ed., Wiley, New York. Hirvonen, H Seawater sampling at Olkiluoto site in Memo Hounslow, A.W Water quality data: analysis and interpretation, CRC Lewis Publishers. Lamminmäki, T Seawater sampling at Olkiluoto site in POSIDOC:Memo Weckman, K Seawater sampling at Olkiluoto site in Memo Paaso, N Merivesinäytteiden otto Olkiluodon edustalta Posiva Työraportti (Abstract in english) Pitkänen, P., Ahokas, H., Ylä-Mella, M., Partamies, S., Snellman, M. and Hellä, P. (ed.) Quality Review of Hydrochemical Baseline Data from the Olkiluoto Site. Olkiluoto: Posiva Oy. 134 p. Posiva report ISBN Posiva Oy Monitoring at Olkiluoto a programme for the period before repository operation. Posiva Oy, Report p.
118 110 8 APPENDICES Appendix 1. Parameters and analytical methods. PARAMETER APPARATUS AND METHOD DETECTION LIMIT ph Conductivity Sodium fluorescein Alkalinity Acidity DIC NPOC Al Ca Fetot K Mg Mn Na Si Sr UNCERTAINTY THE MEASUREMENT 0.05 ph units ph meter ISO Conductivity analyser 5 µs/cm 5% SFS-EN Fluorometry 0.7 µg/l 6% at level 15 µg/l 5% at level 200 µg/l 1% at level 275 µg/l Titration SFS 3005 and SFS-EN ISO to the appropriate extent Titration SFS 3005 and SFS-EN ISO to the appropriate extent TOC-LCSH SFS-EN 1484 to the appropriate extent TOC-LCSH SFS-EN 1484 to the appropriate extent ICP-OES OF 0.03 mmol/l 22% at level mmol/l 2% at level 1 12 mmol/l 0.05 mmol/l 20% at level mmol/l 16% at level mmol/l 11% at level >0.5 mmol/l 0.4 mg/l 23% at level mg/l 4% at level mg/l 0.3 mg/l 24% at level mg/l 11% at level 5 40 mg/l 2 µg/l 0.2 mg/l mg/l 0.1 mg/l mg/l mg/l 0.2 mg/l 0.01 mg/l mg/l 18% at level 2-10 µg/l 10% at level µg/l 16% 32% at level mg/l 5% at level mg/l 12% 12% 11% at level 2-20 mg/l 10% at level mg/l 10% at level 2-20 mg/l 12% at level mg/l 15% at level mg/l 6% at level mg/l
119 111 PARAMETER Fe 2+ Co, Pb, Btot, Ba, Cd, Cu, As, Ni, Zn, U APPARATUS AND METHOD Spectrophotometry ASTM E to the appropriate extent ICP-MS resolution) (high DETECTION UNCERTAINTY OF LIMIT THE MEASUREMENT 30% at level mg/l 6% at level mg/l 0.01 mg/l 8% at level mg/l 4% at level mg/l 0.5 µg/l 2 µg/l 5 µg/l 0.2 µg/l 10% Near detection limit 30% Hg CVAAS 0.02 µg/l 20% (0.05 µg/l) * Method or apparatus is used before 1 st of March # Method or apparatus is used since 1 st of March & Method or apparatus is used before 25 th of November 2013 Method or apparatus is used since 25 th of November 2013
120 112 PARAMETER Cl APPARATUS AND METHOD Titration SFS 3006 to the appropriate extent IC, detector conductivity Br IC, conductivity detector F ISE /Metrohm 905, Titrando IC, conductivity detector PO4 IC, conductivity detector S 2- SO4 Spectrophotometer SFS 3038 to the appropriate extent IC, detector conductivity DETECTION LIMIT 50 mg/l 0.2 mg/l 0.2 mg/l 0.05 mg/l UNCERTAINTY OF THE MEASUREMENT 6.5% at level mg/l 10% at level mg/l 4% at level mg/l 22% at level mg/l 4% at level 1 50 mg/l 3.3% at level mg/l 0.05 mg/l 8% at level mg/l 0.1 mg/l 8% at level mg/l 0.02 mg/l % at level mg/l 11.5% at level mg/l 21% at level mg/l 2% at level 1 50 mg/l Stot H2O2 oxidation+ IC 0.2 mg/l 20% at level 1 mg/l 6.8% at level 3 mg/l NH4 Spectrophotometer 0.02 mg/l 9% at level SFS 3032 to the mg/l appropriate extent 6% at level mg/l Total nitrogen, Ntot Nitrate nitrogen, NO3-N TOC-LCSH +TNM-L, SFS-EN to the appropriate extent IC, detector conductivity 0.05 mg/l 50% at level mg/l 7% at level mg/l 0.2 mg/l 8% at level mg/l 4% at level mg/l
121 113 PARAMETER APPARATUS AND METHOD DETECTION UNCERTAINTY OF LIMIT THE MEASUREMENT 0.1 mg/l 10% at level mg/l Nitrite nitrogen, IC, conductivity NO2-N detector 18 O MS < O (SO4) MS H Fluid scintillation 0.2 TU ~ TU spectrometry (LSC) after electrolytic enrichment. measured in Tritium units (TU) 2 H MS 1 13 C (DIC) MS Precision is ~ C (DIC) AMS Precision is ~ 0.5% 87 Sr/ 86 Sr MS S (SO4) MS 0.1 mbq/l 0.2
122 Appendix 2. Analysis results. 114
123 115
124 116
125 117
126 118 Appendix 3. Available isotope results of seawater samplings. OL-SEA1, ETELÄRIUTTA Date (ddm myy) Deuteri um, H-2 ( VS MOW) Oxygen, O-18 ( VS MOW) Triti um, H-3 (TU) Carb on, C-13 ( V PDB) Car bon, C-14 (pm) OL-SEA2, PUSKAKARI Sulph ur. S- 34(S O4) ( V CDT) - - Oxygen. O- 18(SO4) ( VS MOW) Sr87 /Sr Rad on, Rn- 222 Bq/L <1-36Cl/ Cl (*10-12 ) < <1 - < <
127 119 OL-SEA3, SUSIKARI Date (ddm myy) Deuteri um, H-2 ( VS MOW) Oxygen, O-18 ( VS MOW) Triti um, H-3 (TU) Carb on, C-13 ( V PDB) Car bon, C-14 (pm) Sulph ur. S- 34(S O4) ( V CDT) Oxygen. O- 18(SO4) ( VS MOW) Sr87 /Sr86 Rad on, Rn- 222 Bq/L 36Cl/ Cl (*10-12 ) < < < OL-SEA4, PITKÄKARINKULMA < < < Not included in analysis programme # Result not available yet
128 120
129 121 APPENDIX E. REMOTE SENSING DATA ACQUIRED FOR MONITORING & RESEARCH PURPOSES Table E-1. Remote sensing data acquired so far for Posiva s monitoring & research purposes. Data type Time label Scale or resolution Coverage Black and white aerial images July 1, :20000 OL Island + surroundings Black and white aerial images August 17,1957 1:42000 OL Island + surroundings Black and white aerial images May 10, :17500 OL Island + surroundings Visible band aerial images June 9, :18600 OL Island + surroundings Black and white aerial images 1995 OL Island + surroundings False-colour aerial images May 23, : Olkiluoto Island Visible band aerial images May 10, 2003?? Olkiluoto Island False-colour aerial images July 16, :10000 Olkiluoto Island False-colour aerial images June 8, :10000 Olkiluoto Island False-colour aerial images June 17, :10000 Olkiluoto Island False-colour aerial images June 4, :10000 Olkiluoto Island False-colour + VIS aerial images May 26, :10000 Olkiluoto Island + surroundings False-colour + VIS aerial images September 5, 2012 Olkiluoto island Low oblique aerial images July 16, 2004 N/A Olkiluoto Island Low oblique aerial images August 31, 2005 N/A Olkiluoto Island Low oblique aerial images June 7, 2006 N/A Olkiluoto Island Low oblique aerial images August 6, 2007 N/A Olkiluoto Island Low oblique aerial images July 19, 2012 N/A Shoreline areas at Olkiluoto Island IRS P6-LISS June 6, m Most of a larger Reference area Hyperspectral imagery (AISA dual imaging spectrometer) July 4 and 13, m OL Island + surroundings (600 km 2 ) Green LIDAR for aquatic investigations September 25, points m 2 Parts of Olkiluoto offshore Conventional LIDAR for cartogaphic purposes Not known 0.5 points/m 2 OL Island + surroundings Low oblique aerial images of lakes and mires selected as analogues of the future ones in Olkiluoto area (see Haapanen et al. 2010) July 4, 2010 July 4, 2010 July 4, 2010 July 4, 2010 July 4, 2010 July 4, 2010 July 4, 2010 Flying height ca. 950 m Flying height ca. 950 m Flying height ca. 950 m Flying height ca. 800 m Flying height ca. 800 m Flying height ca. 650 m Flying height ca. 800 m Koskeljärvi and Suomenperänjärvi Valkjärvi Poosjärvi, Kivijärvi, Lampinjärvi Lutanjärvi Kontolanrahka Pesänsuo Lastensuo False-colour + RGB aerial images June 10, m Lakes Poosjärvi, Kivijärvi, Lampinjärvi
130 122 Table E-1. continued Data type Time label Scale or resolution Coverage False-colour + RGB aerial images August m OL Island+ surroundings Lake Poosjärvi Lake Kivijärvi Lake Lampinjärvi Lake Lutanjärvi Lake Koskeljärvi Lastensuo mire Häädetkeidas mire Pesänsuo mire False-colour + RGB aerial images August, m Olkiluoto and surroundings False-colour + RGB aerial images July, m Olkiluoto and surroundings SAR-radar images (HH/HV & VV/VH- channels) August m Olkiluoto and surroundings SAR-radar images (HH and VV-channels) August 2014 ~(1.4 x 3.4) m pixels Area of lakes Poosjärvi and Kivijärvi SAR-radar images July, August, October 2015 ~(1.2 x 2.2) m pixels Olkiluoto and surroundings SAR-radar images July, August, October 2015 ~(1.2 x 2.2) m pixels Areas of the Lakes Poosjärvi, Kivijärvi, Haapijärvi and Lampinjärvi WorldView-3 satellite August 2015 Multispectral 200 cm Panchromatic 50 cm Areas of Lakes Poosjärvi and Kivijärvi
131 123 APPENDIX F. WEATHER MONITORING RESULTS IN 2017 In this appendix, weather statistics originating from weather masts OL-WOM 1 2, as well as ground frost and thickness of the snow cover are presented. Measurements on weather stations OL-WOM3-5 were ceased at the end of Table F-1. Summary of weather observations in 2017 at station OL-WOM1 monthly key figures. RH = relative humidity. Temperature ( C) Wind Speed (m/s) Relative Air pressure Humidity (%) (hpa) Precipitation (mm) Precipitation days (#) Temperature days (#) Wind days (#) Month avg. max. min. avg. avg. D.I. avg. total daily max. >0.1 >1.0 >10.0 min.<0 max.<0 min.<-10 max.>25 >10 >20 1-1,2 4,1-16,2 4,2 89 0, ,9 15,2 5, ,6 3,7-14,9 3,5 86 0, ,1 27,1 5, ,1 8,2-8,7 4,2 83 0, ,1 47,0 10, ,6 9,2-6,4 4,0 81 0, ,9 30,0 9, ,5 20,0-1,8 3,3 76 0, ,7 27,6 13, ,0 24,5 3,9 3,3 79 0, ,9 38,9 16, ,9 25,3 9,2 3,2 78 0, ,9 38,3 28, ,1 23,3 5,9 3,7 81 0, ,4 59,4 16, ,5 19,5 3,9 3,0 86 0, ,6 41,0 15, ,9 13,5-2,8 3,7 87 1, ,4 99,8 14, ,7 8,9-1,3 4,1 89 1, ,4 76,2 9, ,6 5,2-2,4 4,4 88 1, ,2 79,6 12, * Values unavailable or unreliable due to low data integrity. D.I. = Data integrity, percentage of values between the value interval not interpreted as erroneous.
132 124 Table F-2. Summary of weather observations in 2017 at station OL-WOM2 monthly key figures. Note that the precipitation is measured under the forest canopy. RH = relative humidity. Temperature ( C) Wind Speed (m/s) Relative Humidity (%) Air pressure (hpa) Precipitation (mm) Precipitation days (#) Temperature days (#) Wind days (#) Month avg. max. min. avg. avg. avg. total daily max. >0.1 >1.0 >10.0 min.<0 max.<0 min.<-10 max.>25 >10 >20 1-2,3 3,6-18,2 3, ,2 7,2 3, ,6 3,3-16,1 3, ,4 2,9 1, ,1 7,6-9,7 3, ,4 38,7 12, ,5 8,7-7,8 3, ,1 10,4 2, ,7 19,3-3,6 3, ,8 0,1 0, ,1 23,2 3,0 3, ,1 18,7 16, ,0 23,6 8,4 3, ,1 16,5 5, ,9 21,9 4,9 3, ,6 28,3 4, ,4 17,6 3,5 2, ,7 31,4 6, ,6 12,2-3,4 3, ,7 18,5 11, ,5 8,2-2,8 3, ,7 29,4 10, ,5 4,3-3,7 3, ,4 25,4 20,
133 125 Table F-3. Summary of average temperature and humidity observations in soil in 2017 at station OL-WOM2 monthly key figures. RH = relative humidity. All data missing from depth 10 cm. Temperature in soil ( C) on average at depth of (cm) Relative humidity at -20 cm Month avg. (%) 1 * 2,4 2,1 3,3 3,7 4,0 3,8 4,0 4, * 1,6 1,2 2,5 2,8 3,1 2,9 3,2 3, * 1,4 1,2 2,2 2,5 2,7 2,5 2,7 2, * 2,3 2,1 3,1 3,3 3,4 3,1 3,2 3, * 4,0 3,9 4,6 4,6 4,6 4,2 4,3 4, * 6,8 7,1 7,5 7,3 7,3 6,7 6,6 6, * 8,8 9,1 9,5 9,2 9,1 8,5 8,4 8, * 10,3 10,8 11,4 11,0 11,0 10,2 10,0 9, * 9,5 10,0 10,9 10,6 10,8 10,2 10,0 9, * 7,5 7,7 9,1 9,0 9,6 8,9 8,9 8, * 5,5 5,5 7,0 6,9 7,9 7,0 7,0 7, * 4,0 3,8 5,5 5,4 6,7 5,5 5,6 5,6 43
134 126 Table F-4. Summary of extreme temperatures and relative humidity observations in soil in 2017 at station OL-WOM2 monthly key figures. RH = relative humidity. All data missing from depth 10 cm. Minimum temperature ( C) in soil at depth (cm) of Maximum temperature ( C) in soil at depth (cm) of Relative humidity at -20 cm Month min. max. 1 * 2,0 1,6 2,9 3,4 3,7 3,5 3,7 3,7 * 3,8 3,6 4,6 4,9 5,1 4,8 5,0 4, * 1,1 0,7 2,0 2,4 2,7 2,5 2,7 2,8 * 2,4 2,1 3,3 3,6 3,8 3,5 3,8 3, * 1,1 0,8 2,0 2,3 2,5 2,3 2,6 2,6 * 1,9 1,8 2,7 2,9 3,1 2,8 2,9 2, * 1,8 1,6 2,6 2,8 3,0 2,7 2,9 2,9 * 2,7 2,5 3,4 3,5 3,6 3,3 3,4 3, * 2,6 2,4 3,3 3,5 3,6 3,3 3,4 3,3 * 5,5 5,7 6,1 6,0 6,0 5,5 5,5 5, * 5,2 5,3 5,9 6,0 6,0 5,5 5,5 5,3 * 7,9 8,3 8,5 8,2 8,2 7,6 7,5 7, * 7,9 8,3 8,5 8,2 8,2 7,6 7,5 7,3 * 10,2 10,7 11,0 10,5 10,3 9,6 9,3 9, * 9,5 10,0 10,9 10,5 10,3 9,6 9,4 9,0 * 10,8 11,3 11,9 11,4 11,3 10,6 10,4 10, * 8,8 9,2 10,3 10,0 10,5 9,9 9,8 9,6 * 10,3 10,7 11,5 11,1 11,1 10,5 10,2 10, * 5,8 5,7 7,4 7,4 8,3 7,5 7,6 7,5 * 8,8 9,2 10,3 10,1 10,5 9,9 9,8 9, * 4,7 4,6 6,3 6,2 7,2 6,3 6,4 6,3 * 6,2 6,3 7,6 7,5 8,4 7,5 7,6 7, * 3,4 3,2 5,0 4,9 6,0 4,9 5,1 5,0 * 4,8 4,7 6,3 6,2 7,4 6,3 6,4 6,
135 127 Table F-5. Summary of weather observations in Olkiluoto annual key figures for station OL-WOM1. Statistics of are taken from Ikonen (2002) and Ikonen (2005) and those of from the earlier annual reports. RH = relative humidity. Temperature ( C), ground level Wind speed RH (%), Air pressure Precipitation (mm) Precipitation days Temperature days Wind days year mean max date min date (m/s), mean mean (hpa), mean total d. max date >0.1 >1 >10 min <0 max<0 min< 10 max>25 >10 > Jun Jan Sep Jul Dec Jul Jul Feb a a May Dec Jun May Dec a a b 0 b Jul Feb Sep Jun Feb Jun Jul Jan Oct Jun Jan Jul Jul Feb Aug May Dec Jul Jul Jan May May Jan c Jul May Mar Aug Jul Jan Sep May Feb Jul Jul Mar Aug d Jun Jan d May Jul Dec e Sep e e e Jul Feb f Jul 164 f 108 f 16 f Jul Feb g g g g g h Jun Jan Jun Aug Jan 3.8 i Jul Aug Jan Sep Jul Jan 3.7 i May Jul Jan 3.7 i Jul a Major uncertainties with automatic precipitation observations in 1994 and Figures given here are from manual precipitation measurements of a lower resolution. b Days 23 Dec and 29 to31 Dec are not included (missing data). c Precipitation sensor out of service 23 Oct to 24 Nov 04; however there was a negligible amount of precipitation during that time period (hourly entries set to 0 mm). d In Sep 09, 644 hourly measurements out of 720 missing. e Precipitation measurements missing from 9 to 23 Jan and from 1 to 28 Feb 10. f Precipitation data missing from 9 to 19 Mar 11. g Includes manual measurements reported by the nuclear power plant for Jan to Feb, and partly based on manual measurements at the bulk deposition monitoring plot OL-MRK2 due to data missing from 14 to 27 Dec. h Due to poor data integrity, January and February 2013 have been excluded from the precipitation day count. I Values omitted due to poor data integrity.
136 128 Table F-6. Summary of weather observations in Olkiluoto annual key figures for station OL-WOM2. Statistics of are taken from the earlier annual reports. RH = relative humidity. Temperature ( C), ground level Wind speed RH (%), Air pressure Precipitation (mm) Precipitation days Temperature days Year mean max Date min date (m/s), mean mean (hpa), avg. total d. max date >0.1 >1 >10 min <0 max<0 min< 10 max> a Aug a a b a Aug a a a a Jul Feb Nov Aug Feb Jul Jul Mar Aug Jun Dec May Jul Dec Sep Jun Feb Aug Jul Feb 3.5 c Sep Jun Mar Jun Aug Jan Sep d Aug Jan d d d d d d d d d d d d d 2016 e Jul Jan 3.2 e Jan e e e e g 23.6 g 1 Jul g g 6 Jan g 3.2 f Dec g 47 g 9 g 0 g a The remaining sensors were installed in 23 May 05 (temperature) and 26 Apr 05 (air pressure). b Sensor at 2 m installed during the year, so the value for the moisture sensor at 9 m is used instead. c Wind speed data missing from 1 Jan to 29 Mar. d Data missing from 5 Sep to 20 Nov 15 e Temperature data missing from 29 Sep to 5 Oct 16 and from 17 Nov to the end of the year. Minimum and maximum temperature typically do not occur during these time periods, thus they are considered reliable. Relative humidity omitted due to low data integrity. f Data integrity below 95% g Temperature data from ground level is missing for Temperature data from 9 m above ground inside canopy is used here instead
137 129 Table F-7. Arithmetic mean snow thickness in centimeters by terrain types in winter 2017/2018. Number of observation points in brackets. Date Open land/ wetland (4) Scots pine forest (4) Norway spruce forest (4) Deciduous forest (4) Overall avg. (4) average* max. of averages min. of averages** *Calculated over the period from the first to the last observation of snow cover (11 th Jan to 5 th Apr 18). 23 th November and 12 th December are excluded from the calculation ** From the period from the first to the last observation of snow cover (11 th Jan to 5 th Apr 18).
138 130 Table F-8. Results of frost measurements in 2017/2018. Stick refers to a meter positioned next to the ground frost tube (frost tubes with smallest index are actually on the snow monitoring line so that the snow observations are mutual). Tube 1, forest Tube 2, forest Tube 3, forest Snow on the frost tube, Lower limit of ground frost, Snow on stick, cm Snow on the frost tube, cm Lower limit of ground frost, Snow on stick, cm Snow on the frost tube, Lower limit of ground frost, Snow on stick, cm Date cm cm cm cm cm The amount of frost melted from the surface of tubes was zero with the following exceptions: Tube 1: 19 Apr 2 cm, 26 Apr 5 cm, and 3 May 7 cm.
139 131 Table F-8 cont d. Results of frost measurements in 2017/2018. Tube 4, forest Tube 5, open terrain Tube 6, open terrain Snow on the frost tube, Lower limit of ground frost, Snow on stick, cm Snow on the frost tube, Lower limit of ground frost, Snow on stick, cm Snow on the frost tube, Lower limit of ground frost, Snow on stick, cm Date cm cm cm cm cm cm The amount of frost melted from the surface of tubes was zero with the following exception: Tube 4: 19 Apr 10 cm, 26 Apr 13 cm, Tube 5: 19 Apr 5 cm, Tube 6: 12 Apr 5 cm and 19 Apr 10 cm.
140 132 Table F-8 cont d. Results of frost measurements in 2017/2018. Tube 8 has been removed in Tube 7, open terrain Tube 9, mire Snow on the frost Lower limit of ground Snow on stick, cm Snow on the frost Lower limit of ground Snow on stick, cm Date tube, cm frost, cm tube, cm frost, cm The amount of frost melted from the surface of tubes was zero with the following exceptions: Tube 7: 5 Apr 3 cm, 12 Apr 7 cm, 19 Apr 12 cm, 26 Apr 18 cm, Tube 9: 5 Apr 5 cm, 26 Apr 10 cm, 3 May 12 cm, 9 May 15 cm.
141 133 Table F-8 cont d. Results of frost measurements in 2017/2018. Tube 10, forest (OL-FIP04) Tube 11, forest (OL-FIP04) Snow on the frost Lower limit of ground Snow on stick, cm Snow on the frost Lower limit of ground Snow on stick, cm Date tube, cm frost, cm tube, cm frost, cm The amount of frost melted from the surface of tubes was zero with the following exceptions: Tube 10: 26 Apr 10cm, Tube 11: 19 Apr 2 cm.
142 134
143 135 APPENDIX G. CHEMICAL ANALYSES OF SURFACE WATERS IN 2017 In this appendix, detailed results of water quality analyses are presented regarding the rock piling area, ONKALO outlet ditch and measuring weirs. Analyses were carried out by TVO's laboratory for basic water parameters and at ALS Scandinavia AB for element concentration of metals. Outlet waters of ONKALO site are monitored by a weekly sampling for ph. A more comprehensive analysis is carried out a few times per year concerning the sedimentation pool (OL-PO1), outset of the ditch at the end of the discharge tube (OL-DI1) and also downstream along the ditch (OL-DI15), close to the location where the ditch discharges into the sea. These results are presented in Tables G-1, G-2 & G-3. Drainage water from rock heaps is normally sampled in observation wells or ditches (OL- DI14) three times per year. The results are compared with the results from a nearby multilevel piezometer (OL-EP5). Results for OL-DI14 are presented in Table G-4 and those of the OL-EP5 in Table G-5. Chemical analyses of the ditchwater of the measuring weirs were carried out in three times a year at locations OL-MP1, OL-MP2, OL-MP4 and OL-MP5. The results are presented in Tables G-6 to G-9. Element concentrations for surface water samples (OL-DI1, OL-DI15, OL-DI14, OL- EP5, OL-MP1, -2, -4 & -5) are presented in Table G-10. Analysis of water samples has been made without dissolution. Filtration has been performed with a filter of 0,45μm. The samples were acidified with 1 ml ultra-high purity nitric acid per 100 ml. The ICP-SFMS analyses were carried out according to SS EN ISO , 2 (modified) and US EPA Method (modified). The ICP-AES analyses were carried out according to SS EN ISO (modified) and US EPA Method (modified). For chloride analyses HLPC was used according SS-EN ISO :2009. The uncertainty of measurement (UOM) is given as extended uncertainty calculated with a coverage factor of 2, which gives a confidence level of approximately 95%. For chloride uncertainty is given in percentages (±%).
144 136 Table G-1. Chemical analyses of OL-PO1 in Analyzed by TVO's laboratory. Analysis unit Acetate 0,3 0,3 0,3 0,3 mg/l Aluminium, Al µg/l Ammonium, NH ,5 6 mg/l Bicarbonate, HCO mg/l Bromide, Br 2,5 1,7 2,5 3,6 mg/l Calc. Dissolved organic carbon mg/l Calcium, Ca mg/l Carbonate alkalinity, HCl uptake 0,05 0,05 1,1 0,05 mmol/l Charge balance, calculated from HCO3-1,18 0,35-7,03 2,1% Chloride, Cl mg/l Conductivity 2,26 1,8 2,18 2,35 ms/cm Dissolved inorg. carbon ,1 14 mg/l Iron, Fe (total) 0,015 0,009 0,005 0,023 mg/l Magnesium, Mg ,8 11 mg/l Nitrate, NO ,2 88,5 mg/l Nitrite, NO2 7,1 6,6 13,5 9 mg/l Nitrogen, (N) total mg/l Non Purgeable Organic Carbon 5, ,2 mg/l ph 7,9 8 10,8 7,8 Potassium, K mg/l Silicate, SiO mg/l Sodium fluorescein µg/l Sodium, Na mg/l Strontium, Sr 0,96 0,87 1,6 1,3 mg/l Sulphate, SO mg/l Sulphur, S (total) mg/l Suspended solids mg/l Total acidity, NaOH uptake 0,05 0,05 0,06 mmol/l Total alkalinity, HCl uptake 1,6 1,2 1,4 1,2 mmol/l Total dissolved solids mg/l
145 137 Table G-2. Chemical analyses of OL-DI1 in Analyzed by TVO's laboratory. Analysis unit Ammonium, NH4 5,9 11 4,8 5,1 mg/l Bicarbonate, HCO mg/l Carbonate alkalinity, HCl uptake 0,05 0,05 0,5 0,05 mmol/l Conductivity 2,26 2,1 2,39 2,41 ms/cm Dissolved inorg. carbon ,7 15 mg/l Nitrate, NO3 96, ,8 mg/l Non Purgeable Organic Carbon 5,3 5,2 9,8 4,3 mg/l Phosphate, PO4 0,1 0,1 0,1 0,1 mg/l Sodium fluorescein µg/l Sulphate, SO mg/l Suspended solids mg/l Total alkalinity, HCl uptake 1,6 1,2 0,77 1,3 mmol/l ph 7,3 7,4 10 7,5 Table G-3. Chemical analyses of OL-DI15 in Analyzed by TVO's laboratory. Analysis unit Ammonium, NH4 0,8 2,1 1,1 0,29 mg/l Bicarbonate, HCO mg/l Carbonate alkalinity, HCl uptake 0,05 0,05 0,05 0,05 mmol/l Conductivity 0,75 0,68 0,96 0,47 ms/cm Dissolved inorg. carbon ,5 6,4 mg/l Nitrate, NO ,9 32,8 9,1 mg/l Non Purgeable Organic Carbon 13 9,2 7,3 30 mg/l Phosphate, PO4 0,1 0,1 0,1 0,1 mg/l Sodium fluorescein 5,6 1,1 6,1 5,8 µg/l Sulphate, SO mg/l Suspended solids 1,7 6,5 4,3 3,5 mg/l Total alkalinity, HCl uptake 1,1 1 0,71 0,56 mmol/l ph 6,9 7,2 7,4 6,6 Table G-4. Chemical analyses of OL-DI14 near the rock piling area in Analyzed by TVO's laboratory. Analysis unit Ammonium, NH4 0,3 0,11 mg/l Bicarbonate, HCO mg/l Carbonate alkalinity, HCl uptake 0,05 0,05 mmol/l Conductivity 1,12 2,24 ms/cm Dissolved inorg. carbon 5 4,9 mg/l Nitrate, NO3 29,6 312 mg/l Non Purgeable Organic Carbon mg/l Phosphate, PO4 0,1 0,1 mg/l Sodium fluorescein 1 1 µg/l Sulphate, SO mg/l Suspended solids 1 16 mg/l Total alkalinity, HCl uptake 0,32 0,33 mmol/l ph 6,2 6
146 138 Table G-5. Chemical analyses of multi-level piezometer OL-EP5 in Analyzed by TVO's laboratory. Analysis unit Ammonium, NH4 0,28 0,21 0,3 mg/l Bicarbonate, HCO mg/l Carbonate alkalinity, HCl uptake 0,05 0,05 0,05 mmol/l Conductivity 0,98 0,98 0,99 ms/cm Dissolved inorg. carbon mg/l Nitrate, NO3 0,2 0,2 0,2 mg/l Non Purgeable Organic Carbon 4,9 4,9 5 mg/l Phosphate, PO4 0,2 0,1 0,2 mg/l Sodium fluorescein µg/l Sulphate, SO mg/l Suspended solids 0,5 2,8 0,5 mg/l Total alkalinity, HCl uptake 8,9 8,9 8,9 mmol/l ph 7,6 7,6 7,5 Table G-6. Chemical analyses of OL-MP1 in Analyzed by TVO's laboratory Analysis unit Ammonium, NH4 0,02 0,06 mg/l Bicarbonate, HCO mg/l Carbonate alkalinity, HCl uptake 0,05 0,05 mmol/l Conductivity 0,2 0,4 ms/cm Dissolved inorg. carbon 3,5 5,9 mg/l Nitrate, NO3 5,7 7,7 mg/l Non Purgeable Organic Carbon mg/l Phosphate, PO4 0,1 0,1 mg/l Sodium fluorescein 1 1 µg/l Sulphate, SO mg/l Suspended solids 0,5 1,7 mg/l Total alkalinity, HCl uptake 0,36 0,55 mmol/l ph 6,3 6,3 Table G-7. Chemical analyses of OL-MP2 in Analyzed by TVO's laboratory Analysis unit Ammonium, NH4 0,02 0,03 mg/l Bicarbonate, HCO mg/l Carbonate alkalinity, HCl uptake 0,05 0,05 mmol/l Conductivity 0,16 0,18 ms/cm Dissolved inorg. carbon 7,9 8,7 mg/l Nitrate, NO3 0,6 0,2 mg/l Non Purgeable Organic Carbon mg/l Phosphate, PO4 0,1 0,1 mg/l Sodium fluorescein 1 1 µg/l Sulphate, SO mg/l Suspended solids 2,5 1 mg/l Total alkalinity, HCl uptake 0,67 0,8 mmol/l ph 6,7 6,6
147 139 Table G-8. Chemical analyses of OL-MP4 in Analyzed by TVO's laboratory Analysis unit Ammonium, NH4 0,13 0,55 0,02 0,14 mg/l Bicarbonate, HCO mg/l Carbonate alkalinity, HCl uptake 0,05 0,05 0,05 0,05 mmol/l Conductivity 1,06 0,86 0,84 1,18 ms/cm Dissolved inorg. carbon mg/l Nitrate, NO3 1 6,6 0,3 0,2 mg/l Non Purgeable Organic Carbon 8, mg/l Phosphate, PO4 0,1 0,1 0,1 0,1 mg/l Sodium fluorescein 1 1 1,7 1 µg/l Sulphate, SO mg/l Suspended solids ,2 mg/l Total alkalinity, HCl uptake 2,3 1,5 2,5 2,6 mmol/l ph 8,1 6,8 7,5 7 Table G-9. Chemical analyses of OL-MP5 in Analyzed by TVO's laboratory Analysis unit Ammonium, NH4 1,2 0,1 0,59 0,23 mg/l Bicarbonate, HCO mg/l Carbonate alkalinity, HCl uptake 0,05 0,05 0,05 0,05 mmol/l Conductivity 0,64 0,69 0,67 0,56 ms/cm Dissolved inorg. carbon ,9 8,8 mg/l Nitrate, NO3 18,9 22,8 21,4 12,1 mg/l Non Purgeable Organic Carbon ,3 20 mg/l Phosphate, PO4 0,1 0,1 0,1 0,1 mg/l Sodium fluorescein 1,1 1 8,6 7,4 µg/l Sulphate, SO mg/l Suspended solids 3,7 2,5 12 2,5 mg/l Total alkalinity, HCl uptake 0,68 1 0,81 0,74 mmol/l ph 6,7 7,1 7,2 6,7
148 140 Table G-10. Elemental analyses of surface waters in Analyzed by ALS Scandinavia AB for other elements and AK Lab AB (Analys- & Konsultlaboratoriet) for chloride. UOM= The uncertainty of measurement. For other elements uncertainty (±) is given in same unit as the result (mg/l or µg/l) except for chloride where uncertainty is given in percentages (±%). OL-MP1 UOM OL-MP1 UOM OL-MP2 UOM OL-MP2 UOM OL-MP4 UOM OL-MP4 UOM OL-MP4 UOM OL-MP4 UOM ELEMENT unit (±) (±) (±) (±) (±) (±) (±) (±) Ca mg/l 18,9 1,4 13,5 1,1 18,4 1,4 12,8 1 91,4 7,1 32,1 2,4 45 3,5 47,1 3,6 Fe mg/l 0,812 0,056 0,31 0,024 0,598 0,041 0,723 0,05 0,0915 0,0065 0, , ,0283 0,0033 0,112 0,008 K mg/l 3,17 0,23 2,76 0,2 3,43 0,25 2,62 0,19 9,65 0,69 3,67 0,27 4,01 0,3 5,01 0,36 Mg mg/l 7,63 0,51 5,21 0,35 5,56 0,36 3,65 0,24 22,7 1,5 6,95 0,45 9,25 0,61 13,3 0,9 Na mg/l 8,19 0, ,7 5,89 0,45 4,33 0,33 65,2 4,5 21,4 1,5 22,1 1,7 23,2 1,7 Si mg/l 0,6 0,04 0,499 0,035 0,991 0,063 0,814 0,051 1,98 0,12 5,05 0,33 1,38 0,09 0,895 0,056 Al µg/l ,8 17, ,3 2,1 0,709 0,181 1,16 0,29 12,1 2,2 As µg/l 0,464 0,098 0,179 0,042 0,557 0,126 0,434 0,096 0,216 0,059 0,154 0,037 0,098 0,0351 0,0877 0,0421 Ba µg/l 11,6 2,1 9,12 1,67 13,1 2,4 7,86 1,45 31,1 4,8 6,9 1,26 30,1 4,7 15 2,7 Cd µg/l 0,182 0,028 0,127 0,019 0,045 0,007 0,0313 0,006 0,254 0,038 0,0123 0,0022 0,0336 0,0054 0,123 0,019 Co µg/l 3,75 0,66 2,12 0,37 1,18 0,21 0,646 0,118 7,41 1,34 0,366 0,064 0,85 0,152 2,77 0,49 Cr µg/l 2 0,37 0,757 0,145 1,32 0,24 1,38 0,25 0,315 0,062 0,166 0,035 0,0856 0,023 0,203 0,04 Cu µg/l 15,2 1,2 6,13 1,11 9,23 1,61 8,43 1,23 4,04 0,8 5,65 1,01 1,13 0,29 2,47 0,45 Mn µg/l 97,2 6,2 53,6 3, , Mo µg/l 0,239 0,045 0,263 0,051 0,23 0,043 0,117 0,025 2,03 0,37 1,97 0,36 0,568 0,106 0,555 0,106 Ni µg/l 14,5 2,7 8,93 1,66 6,34 1,19 5,16 1,22 31,7 6,3 4,33 0,83 5,68 1,05 19,2 3,6 P µg/l 13,5 2,6 7,77 1,55 12,6 2,5 13,4 2,7 6,62 1,44 4,37 1,07 2,6 0,82 2,75 0,97 Pb µg/l 0,214 0,039 0,096 0,02 0,107 0,021 0,149 0,029 <0.01 <0.01 <0.01 <0.01 Sr µg/l 57,6 5,8 43,6 4,4 46,3 4,6 32,7 3, ,5 9, U µg/l 1,19 0,22 1,55 0,29 1,31 0,24 1,25 0,23 5,12 0,94 1,47 0,27 1,33 0,24 1,75 0,32 V µg/l 1,61 0,3 0,487 0,096 0,793 0,145 0,792 0,149 0,242 0,049 0,404 0,081 0,0414 0,0122 0,106 0,024 Zn µg/l 23,1 2,3 14,8 2 15,8 1,8 11,5 1,8 41,7 3,9 0,807 0,243 13,3 1,7 29,9 3,2 Cl mg/l 9,69 13,00 14,80 13,00 4,55 13,00 3,58 13,00 63,9 13,00 18,9 13,00 33,3 13,00 16,5 13,00
149 141 Table G-10. Continued OL-MP5 UOM OL-MP5 UOM OL-MP5 UOM OL-MP5 UOM OL-DI15 UOM OL-DI15 UOM OL-DI15 UOM OL-DI15 UOM OL-DI15 UOM ELEMENT unit (±) (±) (±) (±) (±) (±) (±) (±) (±) Ca mg/l 52,9 4 40,3 3,2 49,7 3,9 45,2 3, ,8 6,5 53,8 4,1 Fe mg/l 0,233 0,017 0,0219 0,0041 0, , ,211 0,015 0, , , , , , , , ,424 0,029 K mg/l 6,95 0,5 7,1 0,52 12,7 0,9 6,1 0,45 22,9 1,7 21,7 1,6 20,1 1,5 48,4 3,5 7,61 0,55 Mg mg/l 13,5 0,9 8,87 0,59 9,53 0,62 11,6 0,8 22,1 1,4 14,6 1 10,9 0,7 2,87 0, ,8 Na mg/l 49,6 3,6 64,2 4,5 73,6 5,2 30,7 2, ,4 4,3 Si mg/l 1,2 0,08 1,22 0,08 4,86 0,31 1,49 0,1 6,44 0,41 4,71 0,29 6,51 0,41 5,68 0,36 1,85 0,12 Al µg/l 47,8 8,9 2,69 0,52 1,17 0,25 50,8 9,5 0,371 0,137 0,654 0,188 0,284 0,13 1,77 0, As µg/l 0,305 0,068 0,307 0,057 0,306 0,063 0,266 0,048 0,236 0,045 0,405 0,074 0,524 0,1 0,52 0,091 0,422 0,079 Ba µg/l 15,9 2,9 12,3 2,3 16,5 3 15,1 2,8 32,5 4,9 21, ,9 34,7 5,1 17,3 3,2 Cd µg/l 0,276 0,042 0,0295 0,0048 0,0357 0,0056 0,24 0,037 0,118 0,019 0,0887 0,0161 0,0554 0,009 0,165 0,027 0,304 0,047 Co µg/l 6,98 1,23 0,659 0,116 0,206 0,041 4,9 0,86 1,47 0,26 1,61 0,29 0,888 0,159 0,531 0,093 5,96 1,04 Cr µg/l 0,746 0,142 0,186 0,039 1,93 0,37 0,713 0,132 3,98 0,74 9,29 1,73 5,35 0,99 26,3 2,2 1,34 0,25 Cu µg/l 6,91 1,21 1,61 0,3 1,28 0,24 5,62 1 3,04 0,59 4 0,75 4,06 0,73 10,8 1,9 10,2 1,3 Mn µg/l , ,5 5,4 28,6 1,9 0,481 0, Mo µg/l 1,6 0,3 6,73 1,23 29,1 4,6 3,96 0,72 16,8 3,1 20,1 3,7 41,2 4, ,29 1,52 Ni µg/l 24,3 5,1 6,89 1,27 5,21 1,11 31,3 5,8 20,6 4 16,9 3,1 9,38 1,88 2,56 0,52 27,1 5,6 P µg/l 7,34 1,53 4,29 0,91 4,67 1,45 5,3 1,27 6,37 1,41 3,92 0,82 4,55 0,98 8,03 2,35 9,67 2,41 Pb µg/l 0,0216 0,0047 <0.01 <0.01 0,025 0,0053 <0.01 0,137 0,029 <0.01 <0.01 0,0741 0,0138 Sr µg/l U µg/l 1,23 0,23 1,76 0,32 1,02 0,2 1,4 0,26 11,5 2,1 6,8 1,26 5,25 0,97 0,0428 0,0084 1,83 0,34 V µg/l 0,422 0,081 0,075 0,0161 0,353 0,068 0,392 0,075 1,95 0,36 2,74 0,5 3,66 0,67 6,22 1,13 0,86 0,163 Zn µg/l 48,9 3,6 2,67 0,56 1,4 0,33 39,1 3,1 5,69 1,13 5,54 1,16 0,66 0,168 0,506 0,147 48,6 3,6 Cl mg/l 86,8 13,00 96,1 13,00 99,4 13,00 46,40 13,00 541,0 13,00 518,00 13,00 427,0 13,00 568,0 13,00 79,30 13,00
150 142 Table G-10. Continued OL-DI1 UOM OL-DI1 UOM OL-DI1 UOM OL-DI1 UOM OL-DI1 UOM OL-EP5 UOM OL-EP5 UOM OL-DI14 UOM OL-DI14 UOM ELEMENT unit (±) (±) (±) (±) (±) (±) (±) (±) (±) Ca mg/l 45,1 3,5 14,2 1,1 11,3 0,9 43,4 3,4 94 7,2 31,9 2,5 42,6 3, Fe mg/l 0,065 0,0046 0,0355 0,0029 0, , , , , ,001 0, ,0006 0, , ,0203 0,0039 0,0792 0,0061 K mg/l 8,01 0,58 2,44 0,18 2,43 0,18 15,9 1,1 15,1 1 11,6 0,8 11,5 0,8 12,5 0,9 13,9 1 Mg mg/l 12 0,8 3,4 0,24 1,73 0,11 6,13 0,4 8,09 0,54 21,1 1,4 21 1,4 57,6 3,8 33,2 2,2 Na mg/l 50,6 3,6 17,7 1,3 13, ,2 4,6 Si mg/l 1,26 0,08 0,735 0,048 0,956 0,062 3,64 0,25 5,17 0,34 7,54 0,51 6,5 0,41 1,22 0,08 1,27 0,08 Al µg/l 2,68 0,54 4,17 0,78 1,08 0,26 1,11 0,27 0,324 0,133 <0.2 <0.2 6,12 1,15 12,3 2,3 As µg/l 0,324 0,1 <0.05 0,0614 0,0285 0,315 0,063 0,562 0,097 0,0906 0,03 0,0666 0,0283 0,347 0,062 0,311 0,084 Ba µg/l 17,8 3,3 4,62 0,86 3,53 0,65 12,9 2,4 20,5 3,8 18,4 3,4 28,3 4,5 61,4 7,9 50,4 6,7 Cd µg/l 0,074 0,0114 0,0533 0,0081 0,0169 0,0031 0,0545 0,0086 0,0594 0,0091 <0.002 < ,615 0,094 0,572 0,088 Co µg/l 1,54 0,27 1,28 0,24 0,166 0,032 0,2 0,038 0,708 0,124 0,0168 0,0047 0,0156 0,0042 0,661 0, Cr µg/l 0,2 0,046 0,125 0,024 0,139 0,038 3,63 0,67 3,83 0,74 <0.01 0,0116 0,0055 0,24 0,054 0,415 0,077 Cu µg/l 1,73 0,34 1,16 0,25 0,691 0,148 1,17 0,24 2,16 0,38 0,231 0,06 <0.1 3,82 0,7 4,42 0,77 Mn µg/l ,7 3,9 13,1 0,9 27,7 1, ,3 5, Mo µg/l 1,84 0,33 1,13 0,22 2,54 0,46 55,7 5,3 38,2 6,1 0,694 0,127 0,518 0,098 0,329 0,063 0,442 0,081 Ni µg/l 12,9 2,6 6,71 1,26 2,65 0,5 3,26 0,78 11,2 2,1 0,186 0,056 0,0825 0, ,4 P µg/l 4,24 0,95 2,86 0,8 2,96 0,59 6,35 2,4 16,6 3,6 16,6 3,4 12,1 2,4 7,71 1,55 8,85 1,73 Pb µg/l <0.01 <0.01 <0.01 <0.01 <0.01 <0.01 <0.01 <0.01 0,0452 0,0088 Sr µg/l ,5 7 70,5 7, U µg/l 0,742 0,14 0,246 0,046 0,182 0,035 0,751 0,139 3,64 0,68 1,38 0,26 1,49 0,28 0,92 0,169 0,56 0,104 V µg/l 0,0858 0,0174 0,0804 0,017 0,0497 0,0137 0,421 0,081 2,65 0,51 0,0449 0,009 0,0547 0,016 0,0899 0,0176 0,285 0,053 Zn µg/l 20,4 2,3 18,6 1,9 1,99 0,45 1,6 0,36 2,1 0,49 2,16 0,49 1,74 0,42 82,9 5, Cl mg/l 74,7 13,00 39,8 13,00 26,1 13, , ,00 13,2 13,00 13,2 13,00 109,0 13,00 68,30 13,00
151 143 APPENDIX H. CHEMICAL ANALYSES OF PRIVATE DRILLED WELLS IN 2017 The chemical contents of private wells (OL-DWH2, -3 & -5) in Olkiluoto are analyzed annually. Samples from the private wells were analyzed by the Water Protection Association of the River Kokemäenjoki (KVVY). The results are presented in Table H- 1 Table H-1. Chemical analyses of samples from private wells in Sampling date August 16, Original results by the Water Protection Association of the River Kokemäenjoki (KVVY). Bolded values exceeded the quality recommendation limits for drinking water set by the Ministry of Social Affairs and Health. Analysis Unit OL-DWH2 OL-DWH3 OL-DWH5 Escherichia coli cfu/100 <1 <1 3 ml Coliform bacteria cfu/100 <1 <1 9 ml Appearance Clear Clear Clear Odour Slightly mouldy No odour No odour ph Electrical conductivity +25ºC μs/cm Colour index mg/l Pt Cloudiness NTU Chemical oxygen demand mg/l O (CODMn) Ammonia, NH 3 mg/l Nitrite, NO 2 mg/l <0.007 < Nitrate, NO 3 mg/l < Ammonia-nitrogen, NH 3-N mg/l N Nitrite-nitrogen, NO 2-N mg/l N <0.002 < Nitrate-nitrogen, NO 3-N mg/l N < Sum of nitrite and nitrate mg/l < NO2-N+NO3-N mg/l N < Total hardness mmol/l Magnesium, Mg mg/l Calcium, Ca mg/l Chloride mg/l Fluoride, F mg/l Sulphate, SO 4 mg/l < Aluminium, Al μg/l Potassium, K mg/l Manganese, Mn μg/l Sodium, Na mg/l Iron, Fe μg/l
152 144
153 145 APPENDIX I. RESULTS OF RADIONUCLIDE MONITORING IN 2017 Results from the radionuclide monitoring from the year 2017 are presented in this appendix. In the data tables the uncertainty of the measurement is shown in the column on the right-hand side of the activity concentration as a percentage of the concentration. The uncertainties reported do not include the uncertainty arising out of the sampling method and practice. For sampling periods longer than one day, the starting and ending dates are reported. Activity concentrations are decay-corrected to correspond with the middle of the sampling period. The dates have been printed as day.month notations, e.g is March 1 st. For sampling periods started in 2016 or ended in 2018 the year is also given. Measurement results below the minimum detectable activity (MDA) are marked with the symbol < in the tables. Lost and contaminated samples are indicated. Cells marked with symbol - = substance not measured. Table I-1. Radionuclides in deposition in 2017, Bq/m 2. Location Start date End date Be-7 ±% Cs-137 ±% Mn-54 ±% Co-60 ±% Ru-106 ±% Sr-90 ±% OL-RNM02-DC <0.120 < OL-RNM03-DC <0.089 < OL-RNM04-DC <0.108 < OL-RNM06-DC < < < < <
154 146 Table I-2. Radionuclides in air in 2017, mbq/m 3. Location Start date End date Be-7 ±% Cs-137 ±% Ru-106 ±% OL-RNM AS < < < < <
155 147 Table I-2 cont d. Radionuclides in air in 2017, mbq/m 3. Location Start date End date Be-7 ±% Cs-137 ±% Ru- ±% 106 OL-RNM AS < < <
156 148 Table I-2 cont d. Radionuclides in air in 2017, mbq/m 3. Location Start date End date Be-7 ±% Cs-137 ±% Ru- 106 ±% OL-RNM AS < < <
157 149 Table I-2 cont d. Radionuclides in air in 2017, mbq/m 3. Location Start date End date Be-7 ±% Cs-137 ±% Ru- 106 ±% OL-RNM AS <
158 150 Table I-3. Radionuclides in milk in 2017, Bq/l. Location Start date End date K-40 ±% Cs-137 ±% I-131 ±% Sr-90 ±% OL-TMA <0.032 a <0.024 b <0.008 c <0.018d <0.02e <0.05f <0.018g <0.018h <0.019i <0.011 j <0.018 k <0.018 l - OL-TMA a 15.1., b 12.2., c 26.3., d 23.4., e 14.5., f 15.6., g 9.7., h 20.8., i 10.9., j , k , l Table I-4. Radionuclides in drinking water in 2017, Bq/m 3, H-3 Bq/l. Location Sampling date H-3 ±% Sr-90 ±% K-40 ±% Cs-137 ±% OL-RNM05-DW < < OL-RNM07-DW < < < Table I-5. Radionuclides in landfill sites runoff water in 2017, Bq/m 3. Location OL- RNM14 Sampl. date Be- 7 ±% K- 40 ±% Co- 60 ±% Cs- 137 ±% U- 235 ±% Ru < ±% Table I-6. Radionuclides in groundwater in 2017, Bq/m 3. Location Sampling date K-40 ±% Cs-137 ±% OL-RNM13 a <0.83 a Sample taken from Lappi, Rauma
159 151 Table I-7. Radionuclides in soil samples in 2017, Bq/kgdw. Location Sampling date Sampling depth K-40 ±% Sr-90 ±% Cs-137 ±% OL-TMA cm cm cm cm cm cm OL-TMA cm cm cm cm cm cm OL-TMA cm cm cm cm cm cm
160 152 Table I-8. Radionuclides in terrestrial environment in 2017, Bq/kg. All the results in dry weight except mushroom, wild berries, blackcurrant, potato and elk meat in fresh weight. Sampl. Be-7 ±% K-40 ±% Cs- Type Location date 137 ±% Sr-90 ±% C-14 ±% Scots pine OL-TMA needles Reference site a Reindeer lichen OL-TMA Reference site a Lettuce OL-TMA Fern (Polypodium vulgare) OL-TMA Reference site a Haircap moss OL-TMA Reference site b Grazing grass, OL-TMA Reference site c < Blackcurrant OL-TMA < Birch leaves OL-TMA Reference site a Common wheat OL-TMA Barley OL-TMA Reference site d Potato OL-TMA Mushroom OL-TMA26 (Gyromitra esculenta) Mushroom OL-TMA26 (Cantharellus cibarius) Mushroom OL-TMA26 (Leccinum vulpinum) Mushroom (Boletus edulis) OL-TMA Mushroom (Suillus OL-TMA variegatus) Mushroom (Coprinus) OL-TMA Elk meat OL-TMA Bilberry OL-TMA Lingonberry OL-TMA a Sample collected from Kirkkonummi, b Sample collected from Riipilä, Vantaa c Sample collected from Jokioinen
161 153 Table I-9. Radionuclides in fish in 2017, Bq/kgfw. Species Location Sampl. date K-40 ±% Cs-137 ±% Sr-90 ±% Perch OL-FIA Pike OL-FIA OL-FIA Baltic herring OL-FIA Bream OL-FIA Table I-10. Radionuclides in seawater in 2017, Bq/m 3, except for H-3, Bq/l. Location Sampl. date H-3 ±% Sr-90 ±% K-40 ±% Cs-137 ±% OL-SEA OL-SEA OL-SEA < OL-SEA < < OL-SEA < < OL-SEA < < OL-SEA
162 154 Table I-11. Radionuclides in sea indicators and suspended matter in 2017, Bq/kgdw. Type Bladderwrack Location Sampling date Be-7 ±% K-40 ±% Co-58 ±% Co-60 ±% Sr-90 ± % Cs-137 ±% Fe-59 ±% Mn-54 ±% Pu-238 ±% Pu- 239,240 ±% OL-SEA < OL-SEA < OL-SEA < < OL-SEA < < OL-SEA < < OL-SEA < < < OL-SEA Fennel pondweed OL-SEA < Spiked watermilfoil OL-SEA <0.26 OL-SEA < Blue mussel OL-SEA OL-SEA < Perifyton OL-SEA < < < < < <
163 155 Table I-11 cont d. Radionuclides in suspended matter in 2017, Bq/kgdw. Type Location Start date End date Be-7 ±% K-40 ±% Mn-54 ±% Co-60 ±% Cs-137 ±% Ru-106 ±% Pu-238 ±% Pu-239, ±% 240 Suspended OL-SEA matter < OL-SEA < OL-SEA < OL-SEA < <0.83 < < < OL-SEA < <0.35 < < < < OL-SEA < <0.43 < <
164 156 Table I-12. Radionuclides in top (0-10 cm) seasediments in 2017, Bq/kgdw. Location Sampling date K-40 ±% Co-6 ±% Sr-90 ±% Cs- 137 ±% Pu- 238 OL-SEA OL-SEA OL-SEA OL-SEA < ±% Pu- 239, 240 ±% Table I-13. Tritium deposition in rain water in 2017, Bq/l. Location Sampling date or period H-3 ±% OL-RNM03-DC < OL-RNM06-DC
165 157 APPENDIX K. CHANGES IN LAND USE Olkiluoto land use statistics from 1946 to 2017 are presented in this appendix (in Tables K-1 to K-4 and in Figures K-1 to K-11). Changes in the land use in Olkiluoto Island are monitored on a regular basis from aerial orthoimages by adopting Corine classification. For the interpretation, the Olkiluoto Island has been divided into a 50 x 50 m grid. All pixels of the grid that were located on land in 2013 were selected for the interpretation. From 2015 onwards, the island of Kuusisenmaa was also taken in to the interpretation. Kuusisenmaa is introduced separately so that the examination of land use changes in Olkiluoto main island would stay comparable through years. The interpretation was done by Haapanen Forest Consulting from 1946 to 2013 and by FM Meri & Erä Oy from 2013 onwards by using aerial orthoimages of the area and GIS-software. Other materials included maps of superficial deposits from the Geological survey of Finland and National Land Survey's topographic maps. A list of remote sensing data (including aerial images) from Olkiluoto is presented in Appendix E. Notes regarding the interpretation: The date the aerial orthoimages were taken affected the interpretation because the images of 2017 were taken almost six weeks before than in Six weeks at the end of summer is a long time which then affects the visuality of colored infrared (CIR) images used in this interpretation. Also, the time of the day when images are taken changes the visuality of images because of shadows. Shadows are longer the further the pictures are taken from high noon. However, the quality and resolution of orthoimages were very good which helped in the interpretation of tree species and soil type in forests. Some new points were taken in to the interpretation due to post-glacial rebound, succession or human activity. Terrestrial areas: The island of Kuusisenmaa has been taken in to the interpretation starting from In 2015, a causeway was built to the island and it appeared to be finished in the aerial orthoimages taken in Most of the forests in Kuusisenmaa are coniferous rocky forests dominated by spruce with some mixed forests. Due to succession and post-glacial rebound some of the reed beds on land had developed to young forests. Most of those points were assigned to deciduous forest. A few points were changed from sea to research arrangements because of the causeway to Kuusisenmaa across the bay. Human activity: There have been several construction activities between years Some of them are evident in the images that were taken on year 2015 but even more in the images taken in The most visible changes in human activity are the spread of industry area (mainly work related to contruction of encapsulation plant) on ONKALO site and a new construction area for building a switchyard for Olkiluoto 3-power plant (OL3) near the old switchyard in north shore. North of Flutanperä bay a logistic center with a large yard was built between 2013 and These changes are also visible in Table K-1 and Table K-2 as the percentage and count of points of industry areas have risen in On contrary a lot of buildings has been demolished especially from the old accommodation village and from the area between the power plant and Ulkopää cape. Both changes have occurred between 2013 and Between 2015 and 2017 the sparsely forested area under the main power line was cleared from a wider area to build
166 158 new transmission lines for OL3. Construction of industrial facilities is presented in in this report in Section 3.1 (Table 3-1). Table K-1. Land use type distributions from 1946 to 2017 in Olkiluoto presented as percentages of 2013 land area. Class Date of the aerial orthoimage Industry, services, harbor, roads 23,3 22,4 22,3 21,9 20,4 10,6 10,3 10,1 4,9 0,0 0,0 Power line (=related sparsely forested area) 6,1 6,2 6,3 7,0 7,0 5,6 5,6 5,6 0,4 0,0 0,0 Scattered settlement: farms, cottages 2,1 2,1 2,1 2,3 2,3 2,2 2,0 1,9 1,4 0,8 0,7 Agricultural area 4,4 4,4 4,4 4,5 4,6 4,9 5,1 5,2 5,5 6,0 6,0 Deciduous forest 10,9 10,7 10,8 9,3 9,6 9,7 6,8 5,8 5,1 2,5 2,3 Coniferous forest 2,5 2,6 2,7 3,2 3,2 3,7 3,7 2,8 0,7 0,0 0,0 Mixed forest 34,0 34,7 34,3 39,3 40,0 49,1 51,2 53,1 63,5 71,2 71,0 Rocky forest 9,1 9,1 9,0 3,6 3,6 3,6 3,2 2,5 1,9 0,8 0,7 Rocky forest with sparse tree growth, outcrops 2,7 2,8 2,7 3,0 3,0 3,4 3,9 4,6 5,3 6,5 6,6 Peatland forest 2,0 2,0 2,1 2,4 2,4 2,3 1,6 1,5 1,7 1,3 1,1 Mire with sparse tree growth, open mire 0,1 0,1 0,1 0,1 0,1 0,3 0,9 1,0 1,9 2,3 2,4 Shore meadow, reed bed on land 2,7 3,0 3,1 3,1 3,1 2,9 3,6 3,5 3,8 3,5 2,8 Sea 0,0 0,0 0,0 0,3 0,6 1,6 2,1 2,4 4,0 5,1 6,4
167 159 Table K- 2. Count of land use observations in Olkiluoto from the 50 x 50 m grid. Class (modified after Corine 2006) Date of the aerial orthoimage Scattered settlements Industry & services Research arrangements Traffic areas Harbour areas Cottages Agricultural areas (in use) Deciduous forests on mineral soil Deciduous forests on peatland Coniferous forests on mineral soil Coniferous forests on peatland Coniferous forests on rocky soil or bedrock Mixed forests on mineral soil Mixed forests on peatland Mixed forests on rocky soil or bedrock Sparsely forested areas, cc 10-30%, peatland Sparsely forested areas, cc 10-30%, rocky soil or bedrock Sparsely forested areas, under the power lines Rocky soil or bedrock Open mires Shore meadows on land Lakes Sea Total Table K- 3. Land use type distributions from 2015 to 2017 in Kuusisenmaa presented as percentages of 2015 land area. Class Date of the aerial orthoimage Industry, services, harbor, roads 7,1 5,4 Power line (=related sparsely forested area) 0,0 0,0 Scattered settlement: farms, cottages 0,0 0,0 Agricultural area 0,0 0,0 Deciduous forest 2,7 2,7 Coniferous forest 17,0 17,9 Mixed forest 16,1 17,0 Rocky forest 40,2 40,2 Rocky forest with sparse tree growth, outcrops 4,5 4,5 Peatland forest 0,0 0,0 Mire with sparse tree growth, open mire 0,0 0,0 Shore meadow, reed bed on land 12,5 12,5 Sea 0,0 0,0
168 160 Table K-4. Count of land use observations in Kuusisenmaa from the 50 x 50 m grid. Class (modified after Corine 2006) Date of the aerial orthoimage Scattered settlements 0 0 Industry & services 0 0 Research arrangements 8 6 Traffic areas 0 0 Harbour areas 0 0 Cottages 0 0 Agricultural areas (in use) 0 0 Deciduous forests on mineral soil 3 3 Deciduous forests on peatland 0 0 Coniferous forests on mineral soil Coniferous forests on peatland 0 0 Coniferous forests on rocky soil or bedrock Mixed forests on mineral soil Mixed forests on peatland 0 0 Mixed forests on rocky soil or bedrock Sparsely forested areas, cc 10-30%, peatland 0 0 Sparsely forested areas, cc 10-30%, rocky soil or bedrock 2 2 Sparsely forested areas, under the power lines 0 0 Rocky soil or bedrock 3 3 Open mires 0 0 Shore meadows on land Lakes 0 0 Sea 0 0 Total

169 161 Figure K- 1. Land use in Olkiluoto in Figure K- 2. Land use in Olkiluoto in 1957.
170 162 Figure K- 3. Land use in Olkiluoto in Figure K- 4. Land use in Olkiluoto in 1987.
171 163 Figure K-5. Land use in Olkiluoto in Figure K- 6. Land use in Olkiluoto in 2002.

172 164 Figure K- 7. Land use in Olkiluoto in Figure K- 8. Land use in Olkiluoto in 2009.


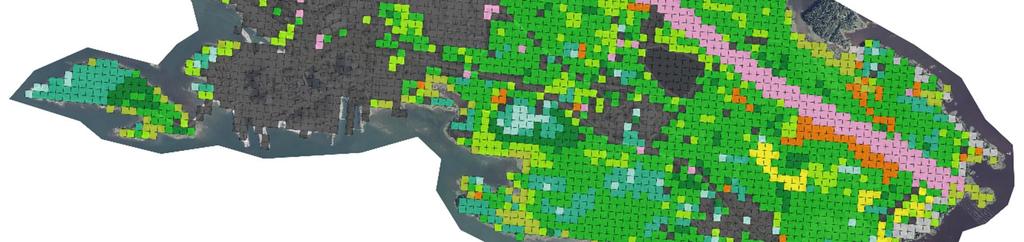
173 165 Figure K-9. Land use in Olkiluoto in Figure K-10. Land use in Olkiluoto in 2015.

174 Figure K-11. Land use in Olkiluoto in
Gap-filling methods for CH 4 data
 Gap-filling methods for CH 4 data Sigrid Dengel University of Helsinki Outline - Ecosystems known for CH 4 emissions; - Why is gap-filling of CH 4 data not as easy and straight forward as CO 2 ; - Gap-filling
Toimintamallit happamuuden ennakoimiseksi ja riskien hallitsemiseksi turvetuotantoalueilla (Sulfa II)
") Toimintamallit happamuuden ennakoimiseksi ja riskien hallitsemiseksi turvetuotantoalueilla (Sulfa II) Happamuuskuormituksen ennustaminen valuma-aluetasolla Marie Korppoo ja Markus Huttunen 13.5.2019 Päämäärä
Toimintamallit happamuuden ennakoimiseksi ja riskien hallitsemiseksi turvetuotantoalueilla (Sulfa II) Happamuuskuormituksen ennustaminen valuma-aluetasolla Marie Korppoo ja Markus Huttunen 13.5.2019 Päämäärä
Results of Monitoring at Olkiluoto in 2009
 Working Report 2010-45 Results of Monitoring at Olkiluoto in 2009 Environment Editor: Anne Haapanen October 2010 POSIVA OY Olkiluoto FI-27160 EURAJOKI, FINLAND Tel +358-2-8372 31 Fax +358-2-8372 3709 Working
National Building Code of Finland, Part D1, Building Water Supply and Sewerage Systems, Regulations and guidelines 2007
 National Building Code of Finland, Part D1, Building Water Supply and Sewerage Systems, Regulations and guidelines 2007 Chapter 2.4 Jukka Räisä 1 WATER PIPES PLACEMENT 2.4.1 Regulation Water pipe and its
WindPRO version joulu 2012 Printed/Page :42 / 1. SHADOW - Main Result
 SHADOW - Main Result Assumptions for shadow calculations Maximum distance for influence Calculate only when more than 20 % of sun is covered by the blade Please look in WTG table 13.6.2013 19:42 / 1 Minimum
Capacity Utilization
 Capacity Utilization Tim Schöneberg 28th November Agenda Introduction Fixed and variable input ressources Technical capacity utilization Price based capacity utilization measure Long run and short run
WindPRO version joulu 2012 Printed/Page :47 / 1. SHADOW - Main Result
 SHADOW - Main Result Assumptions for shadow calculations Maximum distance for influence Calculate only when more than 20 % of sun is covered by the blade Please look in WTG table WindPRO version 2.8.579
,0 Yes ,0 120, ,8
 SHADOW - Main Result Calculation: Alue 2 ( x 9 x HH120) TuuliSaimaa kaavaluonnos Assumptions for shadow calculations Maximum distance for influence Calculate only when more than 20 % of sun is covered
Efficiency change over time
 Efficiency change over time Heikki Tikanmäki Optimointiopin seminaari 14.11.2007 Contents Introduction (11.1) Window analysis (11.2) Example, application, analysis Malmquist index (11.3) Dealing with panel
TM ETRS-TM35FIN-ETRS89 WTG
 SHADOW - Main Result Calculation: N117 x 9 x HH141 Assumptions for shadow calculations Maximum distance for influence Calculate only when more than 20 % of sun is covered by the blade Please look in WTG
TM ETRS-TM35FIN-ETRS89 WTG
 SHADOW - Main Result Assumptions for shadow calculations Maximum distance for influence Calculate only when more than 20 % of sun is covered by the blade Please look in WTG table 5.11.2013 16:44 / 1 Minimum
( ,5 1 1,5 2 km
 Tuulivoimala Rakennukset Asuinrakennus Liikerak. tai Julkinen rak. Lomarakennus Teollinen rakennus Kirkollinen rakennus Varjostus "real case" h/a 1 h/a 8 h/a 20 h/a 4 5 3 1 2 6 7 8 9 10 0 0,5 1 1,5 2 km
I. Principles of Pointer Year Analysis
 I. Principles of Pointer Year Analysis Fig 1. Maximum (red) and minimum (blue) pointer years. 1 Fig 2. Principle of pointer year calculation. Fig 3. Skeleton plot graph created by Kinsys/Kigraph programme.
TM ETRS-TM35FIN-ETRS89 WTG
 SHADOW - Main Result Assumptions for shadow calculations Maximum distance for influence Calculate only when more than 20 % of sun is covered by the blade Please look in WTG table 22.12.2014 11:33 / 1 Minimum
LYTH-CONS CONSISTENCY TRANSMITTER
 LYTH-CONS CONSISTENCY TRANSMITTER LYTH-INSTRUMENT OY has generate new consistency transmitter with blade-system to meet high technical requirements in Pulp&Paper industries. Insurmountable advantages are
1. SIT. The handler and dog stop with the dog sitting at heel. When the dog is sitting, the handler cues the dog to heel forward.
 START START SIT 1. SIT. The handler and dog stop with the dog sitting at heel. When the dog is sitting, the handler cues the dog to heel forward. This is a static exercise. SIT STAND 2. SIT STAND. The
Rakennukset Varjostus "real case" h/a 0,5 1,5
 Tuulivoimala Rakennukset Asuinrakennus Liikerak. tai Julkinen rak. Lomarakennus Teollinen rakennus Kirkollinen rakennus Varjostus "real case" h/a 1 h/a 8 h/a 20 h/a 1 2 3 5 8 4 6 7 9 10 0 0,5 1 1,5 2 km
Use of spatial data in the new production environment and in a data warehouse
 Use of spatial data in the new production environment and in a data warehouse Nordic Forum for Geostatistics 2007 Session 3, GI infrastructure and use of spatial database Statistics Finland, Population
TM ETRS-TM35FIN-ETRS89 WTG
 SHADOW - Main Result Assumptions for shadow calculations Maximum distance for influence Calculate only when more than 20 % of sun is covered by the blade Please look in WTG table WindPRO version 2.8.579
Tynnyrivaara, OX2 Tuulivoimahanke. ( Layout 9 x N131 x HH145. Rakennukset Asuinrakennus Lomarakennus 9 x N131 x HH145 Varjostus 1 h/a 8 h/a 20 h/a
 , Tuulivoimahanke Layout 9 x N131 x HH145 Rakennukset Asuinrakennus Lomarakennus 9 x N131 x HH145 Varjostus 1 h/a 8 h/a 20 h/a 0 0,5 1 1,5 km 2 SHADOW - Main Result Assumptions for shadow calculations
TM ETRS-TM35FIN-ETRS89 WTG
 SHADOW - Main Result Assumptions for shadow calculations Maximum distance for influence Calculate only when more than 20 % of sun is covered by the blade Please look in WTG table WindPRO version 2.8.579
TM ETRS-TM35FIN-ETRS89 WTG
 SHADOW - Main Result Assumptions for shadow calculations Maximum distance for influence Calculate only when more than 20 % of sun is covered by the blade Please look in WTG table WindPRO version 2.9.269
Characterization of clay using x-ray and neutron scattering at the University of Helsinki and ILL
 Characterization of clay using x-ray and neutron scattering at the University of Helsinki and ILL Ville Liljeström, Micha Matusewicz, Kari Pirkkalainen, Jussi-Petteri Suuronen and Ritva Serimaa 13.3.2012
Metsälamminkankaan tuulivoimapuiston osayleiskaava
 VAALAN KUNTA TUULISAIMAA OY Metsälamminkankaan tuulivoimapuiston osayleiskaava Liite 3. Varjostusmallinnus FCG SUUNNITTELU JA TEKNIIKKA OY 12.5.2015 P25370 SHADOW - Main Result Assumptions for shadow calculations
16. Allocation Models
 16. Allocation Models Juha Saloheimo 17.1.27 S steemianalsin Optimointiopin seminaari - Sks 27 Content Introduction Overall Efficienc with common prices and costs Cost Efficienc S steemianalsin Revenue
( ( OX2 Perkkiö. Rakennuskanta. Varjostus. 9 x N131 x HH145
 OX2 9 x N131 x HH145 Rakennuskanta Asuinrakennus Lomarakennus Liike- tai julkinen rakennus Teollinen rakennus Kirkko tai kirkollinen rak. Muu rakennus Allas Varjostus 1 h/a 8 h/a 20 h/a 0 0,5 1 1,5 2 km
Data quality points. ICAR, Berlin,
 Data quality points an immediate and motivating supervision tool ICAR, Berlin, 22.5.2014 Association of ProAgria Centres Development project of Milk Recording Project manager, Heli Wahlroos heli.wahlroos@proagria.fi
TM ETRS-TM35FIN-ETRS89 WTG
 SHADOW - Main Result Assumptions for shadow calculations Maximum distance for influence Calculate only when more than 20 % of sun is covered by the blade Please look in WTG table WindPRO version 2.8.579
Tutkimuslääkkeiden GMP. Fimea Pirjo Hänninen
 Tutkimuslääkkeiden GMP Fimea 17.1.2017 Pirjo Hänninen Kliinisiä lääketutkimuksia koskeva EU:n asetus Regulation (EU) No 536/2014 Hyväksytty 16.4.2014 (voimaan 28.5. 2016) Kumoaa nykyisen lääketutkimusdirektiivin
TM ETRS-TM35FIN-ETRS89 WTG
 SHADOW - Main Result Assumptions for shadow calculations Maximum distance for influence Calculate only when more than 20 % of sun is covered by the blade Please look in WTG table WindPRO version 2.8.579
( N117 x HH141 ( Honkajoki N117 x 9 x HH120 tv-alueet ( ( ( ( ( ( ( ( ( ( m. Honkajoki & Kankaanpää tuulivoimahankkeet
 Honkajoki & Kankaanpää tuulivoimahankkeet N117 x HH141 Honkajoki N117 x 9 x HH120 tv-alueet Alahonkajoki_kaava_alueen_raja_polyline Asuinrakennus Julkinen tai liiker rak. Lomarakennus Teollinen rak. Allas
TM ETRS-TM35FIN-ETRS89 WTG
 SHADOW - Main Result Assumptions for shadow calculations Maximum distance for influence Calculate only when more than 20 % of sun is covered by the blade Please look in WTG table WindPRO version 2.8.579
Constructive Alignment in Specialisation Studies in Industrial Pharmacy in Finland
 Constructive Alignment in Specialisation Studies in Industrial Pharmacy in Finland Anne Mari Juppo, Nina Katajavuori University of Helsinki Faculty of Pharmacy 23.7.2012 1 Background Pedagogic research
Social and Regional Economic Impacts of Use of Bioenergy and Energy Wood Harvesting in Suomussalmi
 Social and Regional Economic Impacts of Use of Bioenergy and Energy Wood Harvesting in Suomussalmi Green Cities and Settlements 18.2.2014 Ville Manninen Writers Project group Sirpa Korhonen, Anna Mari
TM ETRS-TM35FIN-ETRS89 WTG
 VE1 SHADOW - Main Result Calculation: 8 x Nordex N131 x HH145m Assumptions for shadow calculations Maximum distance for influence Calculate only when more than 20 % of sun is covered by the blade Please
7.4 Variability management
 7.4 Variability management time... space software product-line should support variability in space (different products) support variability in time (maintenance, evolution) 1 Product variation Product
Results on the new polydrug use questions in the Finnish TDI data
 Results on the new polydrug use questions in the Finnish TDI data Multi-drug use, polydrug use and problematic polydrug use Martta Forsell, Finnish Focal Point 28/09/2015 Martta Forsell 1 28/09/2015 Esityksen
Accommodation statistics
 Transport and Tourism 2013 Accommodation statistics 2012, December Nights spent by foreign tourists in Finland up by 45 per cent in December 2012 The number of recorded nights spent by foreign tourists
The CCR Model and Production Correspondence
 The CCR Model and Production Correspondence Tim Schöneberg The 19th of September Agenda Introduction Definitions Production Possiblity Set CCR Model and the Dual Problem Input excesses and output shortfalls
TM ETRS-TM35FIN-ETRS89 WTG
 SHADOW - Main Result Assumptions for shadow calculations Maximum distance for influence Calculate only when more than 20 % of sun is covered by the blade Please look in WTG table WindPRO version 2.8.579
TM ETRS-TM35FIN-ETRS89 WTG
 SHADOW - Main Result Assumptions for shadow calculations Maximum distance for influence Calculate only when more than 20 % of sun is covered by the blade Please look in WTG table WindPRO version 2.8.579
Accommodation statistics
 Transport and Tourism 2011 Accommodation statistics 2011, January Nights spent by foreign tourists in Finland increased by per cent in January The number of recorded nights spent by foreign tourists at
Information on preparing Presentation
 Information on preparing Presentation Seminar on big data management Lecturer: Spring 2017 20.1.2017 1 Agenda Hints and tips on giving a good presentation Watch two videos and discussion 22.1.2017 2 Goals
Exercise 1. (session: )
") EEN-E3001, FUNDAMENTALS IN INDUSTRIAL ENERGY ENGINEERING Exercise 1 (session: 24.1.2017) Problem 3 will be graded. The deadline for the return is on 31.1. at 12:00 am (before the exercise session). You
EEN-E3001, FUNDAMENTALS IN INDUSTRIAL ENERGY ENGINEERING Exercise 1 (session: 24.1.2017) Problem 3 will be graded. The deadline for the return is on 31.1. at 12:00 am (before the exercise session). You
HITSAUKSEN TUOTTAVUUSRATKAISUT
 Kemppi ARC YOU GET WHAT YOU MEASURE OR BE CAREFUL WHAT YOU WISH FOR HITSAUKSEN TUOTTAVUUSRATKAISUT Puolitetaan hitsauskustannukset seminaari 9.4.2008 Mikko Veikkolainen, Ratkaisuliiketoimintapäällikkö
LUONNOS RT 80260 EN AGREEMENT ON BUILDING WORKS 1 THE PARTIES. May 1998 1 (10)
") RT 80260 EN May 1998 1 (10) AGREEMENT ON BUILDING WORKS This agreement template is based on the General Terms and Conditions of Building Contracts YSE 1998 RT 16-10660, LVI 03-10277, Ratu 417-7, KH X4-00241.
RT 80260 EN May 1998 1 (10) AGREEMENT ON BUILDING WORKS This agreement template is based on the General Terms and Conditions of Building Contracts YSE 1998 RT 16-10660, LVI 03-10277, Ratu 417-7, KH X4-00241.
HARJOITUS- PAKETTI A
 Logistiikka A35A00310 Tuotantotalouden perusteet HARJOITUS- PAKETTI A (6 pistettä) TUTA 19 Luento 3.Ennustaminen County General 1 piste The number of heart surgeries performed at County General Hospital
Arcticfood fromfinland
 Arcticfood fromfinland Rakennetaan arktisuudesta suomalais ruualle yhdessä tarina, joka tunnetaan maailmalla! Arktisuus elintarvikeviennin kärkenä -sem 25.10.2018 Eeva Heikkilä, Ruokatieto Taustaselvityksestä
MUSEOT KULTTUURIPALVELUINA
 Elina Arola MUSEOT KULTTUURIPALVELUINA Tutkimuskohteena Mikkelin museot Opinnäytetyö Kulttuuripalvelujen koulutusohjelma Marraskuu 2005 KUVAILULEHTI Opinnäytetyön päivämäärä 25.11.2005 Tekijä(t) Elina
Other approaches to restrict multipliers
 Other approaches to restrict multipliers Heikki Tikanmäki Optimointiopin seminaari 10.10.2007 Contents Short revision (6.2) Another Assurance Region Model (6.3) Cone-Ratio Method (6.4) An Application of
 Digitally signed by Hans Vadbäck DN: cn=hans Vadbäck, o, ou=fcg Suunnittelu ja Tekniikka Oy, email=hans.vadback@fcg.fi, c=fi Date: 2016.12.20 15:45:35 +02'00' Jakob Kjellman Digitally signed by Jakob Kjellman
Pricing policy: The Finnish experience
 Pricing policy: The Finnish experience Esa Österberg Senior Researcher Alcohol and Drug Research, STAKES, Helsinki, Finland esa.osterberg@stakes.fi Three pillars of traditional Nordic alcohol control Strict
Network to Get Work. Tehtäviä opiskelijoille Assignments for students. www.laurea.fi
 Network to Get Work Tehtäviä opiskelijoille Assignments for students www.laurea.fi Ohje henkilöstölle Instructions for Staff Seuraavassa on esitetty joukko tehtäviä, joista voit valita opiskelijaryhmällesi
Continuous environmental monitoring for the automation of water balance management at mines
 Continuous environmental monitoring for the automation of water balance management at mines SYKE Helsinki 28.8.2015 Jaakko Seppälä M.Sc Eng. Head of the Board EHP-Tekniikka Ltd. EHP-Tekniikka Oy Jaakko
Information on Finnish Language Courses Spring Semester 2018 Päivi Paukku & Jenni Laine Centre for Language and Communication Studies
 Information on Finnish Language Courses Spring Semester 2018 Päivi Paukku & Jenni Laine 4.1.2018 Centre for Language and Communication Studies Puhutko suomea? -Hei! -Hei hei! -Moi! -Moi moi! -Terve! -Terve
TIEKE Verkottaja Service Tools for electronic data interchange utilizers. Heikki Laaksamo
 TIEKE Verkottaja Service Tools for electronic data interchange utilizers Heikki Laaksamo TIEKE Finnish Information Society Development Centre (TIEKE Tietoyhteiskunnan kehittämiskeskus ry) TIEKE is a neutral,
Accommodation statistics
 Transport and Tourism 2013 Accommodation statistics 2013, February Nights spent by foreign tourists in Finland down by 2.5 per cent in February 2013 The number of recorded nights spent by foreign tourists
Tree map system in harvester
 Tree map system in harvester Fibic seminar 12.6.2013 Lahti Timo Melkas, Metsäteho Oy Mikko Miettinen, Argone Oy Kalle Einola, Ponsse Oyj Project goals EffFibre project 2011-2013 (WP3) To evaluate the accuracy
Wärtsilä Corporation. Interim Report January-September 2003 Ole Johansson President & CEO. 29 October Wärtsilä
 Wärtsilä Corporation Interim Report January-September 2003 Ole Johansson President & CEO 29 October 2003 Highlights of the reporting period Order intake of Power Divisions increased. Clear improvement
Infrastruktuurin asemoituminen kansalliseen ja kansainväliseen kenttään Outi Ala-Honkola Tiedeasiantuntija
 Infrastruktuurin asemoituminen kansalliseen ja kansainväliseen kenttään Outi Ala-Honkola Tiedeasiantuntija 1 Asemoitumisen kuvaus Hakemukset parantuneet viime vuodesta, mutta paneeli toivoi edelleen asemoitumisen
Research plan for masters thesis in forest sciences. The PELLETime 2009 Symposium Mervi Juntunen
 Modelling tree and stand characteristics and estimating biomass removals and harvesting costs of lodgepole pine (Pinus contorta) plantations in Iceland Research plan for masters thesis in forest sciences
Transport and Infrastructure what about the future? Professor Jorma Mäntynen Tampere University of Technology
 Transport and Infrastructure what about the future? Professor Jorma Mäntynen Tampere University of Technology 1 Finland as a part of the World Kuva: NASA Globalisation and the structural change of trade
AYYE 9/ HOUSING POLICY
 AYYE 9/12 2.10.2012 HOUSING POLICY Mission for AYY Housing? What do we want to achieve by renting apartments? 1) How many apartments do we need? 2) What kind of apartments do we need? 3) To whom do we
Accommodation statistics
 Transport and Tourism 201 Accommodation statistics 201, May Nights spent by foreign tourists in Finland up by 11 per cent in May 201 Overnight stays by foreign tourists continued increasing at Finnish
TEST REPORT Nro VTT-S Air tightness and strength tests for Furanflex exhaust air ducts
 TEST REPORT Nro VTT-S-04515-08 19.5.008 Air tightness and strength tests for Furanflex exhaust air ducts Requested by: Hormex Oy TEST REPORT NRO VTT-S-04515-08 1 () Requested by Order Hormex Oy Linnanherrankuja
Wastewater collectuion and treatment in the Helsinki capital area Citywater seminar 20.03.2013. Tommi Fred
 Wastewater collectuion and treatment in the Helsinki capital area Citywater seminar 20.03.2013 Tommi Fred HSY HSY provides waste and water management services for the more than one million residents of
sa Ammonium-, NO 3 - ja kokonaistyppilaskeuma vähentyivät sadeveden kulkiessa latvuskerroksen läpi kaikilla kuusi- ja mäntykohteilla lukuunottamatta U
 4 3 Deposition on the forests and forest floor in 2000 Metsiin ja metsämaahan kohdistuva laskeuma vuonna 2000 Antti-Jussi Lindroos 1, John Derome 2, Kirsti Derome 2 and Kaarina Niska 2 1) Finnish Forest
Information on Finnish Language Courses Spring Semester 2017 Jenni Laine
 Information on Finnish Language Courses Spring Semester 2017 Jenni Laine 4.1.2017 KIELIKESKUS LANGUAGE CENTRE Puhutko suomea? Do you speak Finnish? -Hei! -Moi! -Mitä kuuluu? -Kiitos, hyvää. -Entä sinulle?
Group 2 - Dentego PTH Korvake. Peer Testing Report
 Group 2 - Dentego PTH Korvake Peer Testing Report Revisions Version Date Author Description 1.0 Henrik Klinkmann First version Table of Contents Contents Revisions... 2 Table of Contents... 2 Testing...
3 9-VUOTIAIDEN LASTEN SUORIUTUMINEN BOSTONIN NIMENTÄTESTISTÄ
 Puhe ja kieli, 27:4, 141 147 (2007) 3 9-VUOTIAIDEN LASTEN SUORIUTUMINEN BOSTONIN NIMENTÄTESTISTÄ Soile Loukusa, Oulun yliopisto, suomen kielen, informaatiotutkimuksen ja logopedian laitos & University
Katri Vala heating and cooling plant - Eco-efficient production of district heating and cooling
 Katri Vala heating and cooling plant - Eco-efficient production of district heating and cooling Marko Riipinen Helsingin Energia Aalto University District heating excursion 14.11.2012 Location of Katri
Sähköjärjestelmän käyttövarmuus & teknologia Käyttövarmuuspäivä 25.11.2014
 Sähköjärjestelmän käyttövarmuus & teknologia Käyttövarmuuspäivä 25.11.2014 Jarmo Partanen, professori, Lappeenrannan yliopisto jarmo.partanen@lut.fi +358 40 5066 564 Electricity Market, targets Competitive
FROM VISION TO CRITERIA: PLANNING SUSTAINABLE TOURISM DESTINATIONS Case Ylläs Lapland
 FROM VISION TO CRITERIA: PLANNING SUSTAINABLE TOURISM DESTINATIONS Case Ylläs Lapland Tiina Merikoski, Landscape Architect (M.Sc) Aalto University School of Science and Technology Department of Architecture
KMTK lentoestetyöpaja - Osa 2
 KMTK lentoestetyöpaja - Osa 2 Veijo Pätynen 18.10.2016 Pasila YHTEISTYÖSSÄ: Ilmailun paikkatiedon hallintamalli Ilmailun paikkatiedon hallintamalli (v0.9 4.3.2016) 4.4 Maanmittauslaitoksen rooli ja vastuut...
Tork Paperipyyhe. etu. tuotteen ominaisuudet. kuvaus. Väri: Valkoinen Malli: Vetopyyhe
 etu Monikäyttöpaperi hoitaa useimmat pyyhintätehtävät Sopiva lasipintojen pyyhintään Sopii käsien kuivaamiseen Elintarvikekäyttöön hyväksytty Tork Easy Handling, pakkaus, jota on helppo kantaa mukana,
LX 70. Ominaisuuksien mittaustulokset 1-kerroksinen 2-kerroksinen. Fyysiset ominaisuudet, nimellisarvot. Kalvon ominaisuudet
 LX 70 % Läpäisy 36 32 % Absorptio 30 40 % Heijastus 34 28 % Läpäisy 72 65 % Heijastus ulkopuoli 9 16 % Heijastus sisäpuoli 9 13 Emissiivisyys.77.77 Auringonsuojakerroin.54.58 Auringonsäteilyn lämmönsiirtokerroin.47.50
Sisällysluettelo Table of contents
 Sisällysluettelo Table of contents OTC:n Moodlen käyttöohje suomeksi... 1 Kirjautuminen Moodleen... 2 Ensimmäinen kirjautuminen Moodleen... 2 Salasanan vaihto... 2 Oma käyttäjäprofiili... 3 Työskentely
Copernicus, Sentinels, Finland. Erja Ämmälahti Tekes,
 Copernicus, Sentinels, Finland Erja Ämmälahti Tekes, 24.5.2016 Finnish Space industry in the European context European Space industry has been constantly growing and increasing its direct employment in
MIKES, Julkaisu J3/2000 MASS COMPARISON M3. Comparison of 1 kg and 10 kg weights between MIKES and three FINAS accredited calibration laboratories
 MITTATEKNIIKAN KESKUS CENTRE FOR METROLOGY AND ACCREDITATION Julkaisu J3/2000 MASS COMPARISON M3 Comparison of 1 kg and 10 kg weights between MIKES and three FINAS accredited calibration laboratories Kari
Wärtsilä Corporation. Interim Report January-June 2003 Ole Johansson President & CEO. 31 July Wärtsilä
 Wärtsilä Corporation Interim Report January-June 2003 Ole Johansson President & CEO 31 July 2003 Group structure Power Divisions Engine division Marine Power Plants Service Holding Assa Abloy 7.6% 2 Group
Stormwater filtration unit
 Stormwater filtration unit Background, concept and applied design work Olli Hakala 2018 WSP Finland Aalto university Kyttä ym. 2014. Veden äärellä kysely, ENTJUSTESS-hanke. Aalto yliopisto. STORMWATER
Trends in stream water concentration and export of nitrogen and phosphorus from boreal forested catchments in Finland
 Trends in stream water concentration and export of nitrogen and phosphorus from boreal forested catchments in Finland Sakari Sarkkola 1, Harri Koivusalo 1, Ari Laurén 1, Pirkko Kortelainen 2, Tuija Mattsson
AKKREDITOITU TESTAUSLABORATORIO ACCREDITED TESTING LABORATORY LUONNONVARAKESKUS VANTAA, ROVANIEMI
 T203/M13/2014 Liite 1 / Appendix 1 Sivu / Page 1(5) AKKREDITOITU TESTAUSLABORATORIO ACCREDITED TESTING LABORATORY LUONNONVARAKESKUS VANTAA, ROVANIEMI NATURAL RESOURCES INSTITUTE FINLAND VANTAA, ROVANIEMI
Information on Finnish Courses Autumn Semester 2017 Jenni Laine & Päivi Paukku Centre for Language and Communication Studies
 Information on Finnish Courses Autumn Semester 2017 Jenni Laine & Päivi Paukku 24.8.2017 Centre for Language and Communication Studies Puhutko suomea? -Hei! -Hei hei! -Moi! -Moi moi! -Terve! -Terve terve!
Uusi Ajatus Löytyy Luonnosta 4 (käsikirja) (Finnish Edition)
 (Finnish Edition)") Uusi Ajatus Löytyy Luonnosta 4 (käsikirja) (Finnish Edition) Esko Jalkanen Click here if your download doesn"t start automatically Uusi Ajatus Löytyy Luonnosta 4 (käsikirja) (Finnish Edition) Esko Jalkanen
Uusi Ajatus Löytyy Luonnosta 4 (käsikirja) (Finnish Edition) Esko Jalkanen Click here if your download doesn"t start automatically Uusi Ajatus Löytyy Luonnosta 4 (käsikirja) (Finnish Edition) Esko Jalkanen
Fighting diffuse nutrient load: Multifunctional water management concept in natural reed beds
 PhD Anne Hemmi 14.2.2013 RRR 2013 Conference in Greifswald, Germany Fighting diffuse nutrient load: Multifunctional water management concept in natural reed beds Eutrophication in surface waters High nutrient
Choose Finland-Helsinki Valitse Finland-Helsinki
 Write down the Temporary Application ID. If you do not manage to complete the form you can continue where you stopped with this ID no. Muista Temporary Application ID. Jos et onnistu täyttää lomake loppuun
Accommodation statistics
 Transport and Tourism 2014 Accommodation statistics 2013, December Nights spent by foreign tourists in Finland up by 5.5 per cent in December 2013 The number of recorded nights spent by foreign tourists
FinFamily PostgreSQL installation ( ) FinFamily PostgreSQL
 FinFamily PostgreSQL") FinFamily PostgreSQL 1 Sisällys / Contents FinFamily PostgreSQL... 1 1. Asenna PostgreSQL tietokanta / Install PostgreSQL database... 3 1.1. PostgreSQL tietokannasta / About the PostgreSQL database...
FinFamily PostgreSQL 1 Sisällys / Contents FinFamily PostgreSQL... 1 1. Asenna PostgreSQL tietokanta / Install PostgreSQL database... 3 1.1. PostgreSQL tietokannasta / About the PostgreSQL database...
Kysymys 5 Compared to the workload, the number of credits awarded was (1 credits equals 27 working hours): (4)
: (4)") Tilasto T1106120-s2012palaute Kyselyn T1106120+T1106120-s2012palaute yhteenveto: vastauksia (4) Kysymys 1 Degree programme: (4) TIK: TIK 1 25% ************** INF: INF 0 0% EST: EST 0 0% TLT: TLT 0 0% BIO:
Tilasto T1106120-s2012palaute Kyselyn T1106120+T1106120-s2012palaute yhteenveto: vastauksia (4) Kysymys 1 Degree programme: (4) TIK: TIK 1 25% ************** INF: INF 0 0% EST: EST 0 0% TLT: TLT 0 0% BIO:
Miehittämätön meriliikenne
 Rolls-Royce & Unmanned Shipping Ecosystem Miehittämätön meriliikenne Digimurros 2020+ 17.11. 2016 September 2016 2016 Rolls-Royce plc The 2016 information Rolls-Royce in this plc document is the property
Accommodation statistics
 Transport and Tourism 2014 Accommodation statistics 2014, October Nights spent by foreign tourists in Finland decreased by 1. per cent in October The number of recorded nights spent by foreign tourists
Sähköntuotanto energialähteittäin Power generation by energy source
 Sähköntuotannon polttoaineet ja CO2-päästöt 2.1.216 1 (17) Sähköntuotanto energialähteittäin Power generation by energy source 8 7 6 GWh / kk GWh/ Month 5 4 3 2 1 7 8 9 1 1 2 3 4 5 6 7 8 9 1 1 2 3 4 5
Security server v6 installation requirements
 CSC Security server v6 installation requirements Security server version 6.4-0-201505291153 Pekka Muhonen 8/12/2015 Date Version Description 18.12.2014 0.1 Initial version 10.02.2015 0.2 Major changes
Photo: Paavo Keränen. KAINUU in statistics 2009
 Photo: Paavo Keränen KAINUU in statistics 2009 KAINUU IN PROPORTION TO THE WHOLE OF FINLAND Forest area Total area Roads Primary production Summer cottages Unemployed Populat. over 64 years Number of farms
DIGITAL MARKETING LANDSCAPE. Maatalous-metsätieteellinen tiedekunta
 DIGITAL MARKETING LANDSCAPE Mobile marketing, services and games MOBILE TECHNOLOGIES Handset technologies Network technologies Application technologies INTRODUCTION TO MOBILE TECHNOLOGIES COMPANY PERSPECTIVE
Land-Use Model for the Helsinki Metropolitan Area
 Land-Use Model for the Helsinki Metropolitan Area Paavo Moilanen Introduction & Background Metropolitan Area Council asked 2005: What is good land use for the transport systems plan? At first a literature
Security server v6 installation requirements
 CSC Security server v6 installation requirements Security server version 6.x. Version 0.2 Pekka Muhonen 2/10/2015 Date Version Description 18.12.2014 0.1 Initial version 10.02.2015 0.2 Major changes Contents
Harjavallan sulaton raskasmetallipäästöt
 Mg vuodessa 25 2 15 Harjavallan sulaton raskasmetallipäästöt Cu Ni Zn Pb 1 5 1985 1988 1991 1994 1997 2 23 Outokumpu Oy Keskimääräinen vuosilaskeuma Harjavallan tutkimusgradientilla vuosina 1992-1998 7
Accommodation statistics
 Transport and Tourism 2013 Accommodation statistics 2013, July Nights spent by foreign tourists in Finland up by 1.9 per cent in July 2013 The number of recorded nights spent by foreign tourists at Finnish