Results of Monitoring at Olkiluoto in 2018, Rock Mechanics
|
|
|
- Jutta Härkönen
- 6 vuotta sitten
- Katselukertoja:
Transkriptio
1 Working Report Results of Monitoring at Olkiluoto in 2018, Rock Mechanics Sophie Haapalehto (ed.), Marianne Malm, Outi Kaisko, Sonja Lahtinen, Veikko Saaranen June 2019 POSIVA OY Olkiluoto FI EURAJOKI, FINLAND Phone (02) (nat.), ( ) (int.) Fax (02) (nat.), ( ) (int.)
2
3 Working Report Results of Monitoring at Olkiluoto in 2018, Rock Mechanics Sophie Haapalehto (ed.), Posiva Oy Marianne Malm, Outi Kaisko, ÅF-Consult Oy Sonja Lahtinen, Veikko Saaranen Maanmittauslaitos June 2019 ONKALO is a registered trademark of Posiva Oy Working Reports contain information on work in progress or pending completion.
4
5 RESULTS OF MONITORING AT OLKILUOTO IN 2018, ROCK MECHANICS ABSTRACT The rock mechanical monitoring is done at Olkiluoto in order to measure potential tectonic movements, estimate the stability of the bedrock and to implement safeguardswork. The rock mechanics monitoring programme 2018 consisted of seismic, GPS, precise levelling, and temperature measurements at Olkiluoto and seismic, displacement, temperature measurements and visual tunnel observations recorded in the final disposal facility. Posiva runs a microseismic network in ONKALO and its surroundings for monitoring the structure and long-term stability of the bedrock and as a part of their safeguards programme. The permanent network consisted of 18 seismic stations with 22 sensors in In addition, ten temporary sensors deployed for study purposes are running but excluded from the permanent network. The monitoring was operated continuously in 2018, even though individual stations suffered from small operation breaks. Altogether 876 events were located inside the seismic semi-regional area, of which 461 were explosions (ML = ), 166 microearthquakes (ML = ) and 239 miscellaneous or unidentified small events or probable rock falls (ML = ) inside the seismic ONKALO block. In addition, 10 explosions (ML = ) outside the ONKALO block but within the semi-regional area were located. Also, one regional earthquake (ML = 2.1) was recorded. The excavation works of the final disposal facility were more quiet in 2018 compared to the previous year of observation. Also, the amount of induced seismicity was lower compared to previous year and the microearthquakes were of small magnitudes, and no visual observations or tremors directly related to these events were observed. Most of the microearthquakes were connected to construction operations and no natural earthquakes could be identified in the seismic ONKALO block area. Despite the quite high number of very small induced microearthquakes, the rock mass has remained stable according to the seismic monitoring in The GPS network of Olkiluoto consists of 17 stations, of which 16 stations are operating continuously. The station velocities with uncertainties were estimated for each station from the daily coordinate solutions taking into account the seasonal signals and discontinuities. The relative horizontal velocity components of the stations were maximum 0.2 mm/y and mostly below ± 0.1 mm/y for the continuously operating stations. The uncertainties of the horizontal velocities were on average 0.1 mm/y at 95 % confidence level. The relative vertical velocities were mostly within ± 0.5 mm/y. The uncertainties of the vertical velocities were clearly larger compared to the horizontal estimates, on average 0.7 mm/y at 95 % confidence level. For a few stations (GPS3, GPS16) the statistically significant vertical velocities seemed to be unrealistically large compared to the precise levelling results Levelling observations included ONKALO and VLJ. Larger height changes have been observed in the ONKALO area, where benchmark has uplifted 3.03 mm since 2006 relative to the fixed BM Between 2017 and 2018, the largest height change was mm at the BM In the VLJ loop, the largest height change was mm at the BM GPS9B. So locally the VLJ area is stable. Since 2006 i.e. during the whole
6 observation history all movements have predominantly been less than 0.5 mm. As a whole, the results of 2018 matched well with the previous results. New levelling fault lines were not found. The largest height change in a benchmark interval from 2017 to 2018 is 0.52 mm. It was observed between the benchmarks and The extensometers installed in the final disposal facility at 7 different measurement areas measured the displacements of the tunnels mainly continuously in Several downtimes were observed in the parking hall. None of the displacements exceed 0.2 mm in the final disposal facility. During 2018 temperature measurements were performed in one deep drillhole, in the access tunnel and in the displacement measurement areas. The results of 2018 follow the results from previous years. The seasonal change is observed in the measurements made in the tunnels. During 2018, 9 visual observations of rock damage were recorded. The number has decreased from 2017 (27 observations). Most of the observations was rock noise. Keywords: monitoring, rock mechanics, Olkiluoto, seismic network, microearthquake, induced seismicity, safeguards, GPS, precise levelling, extensometers, temperature measurements, rock noise.
7 KALLIOMEKANIIKAN MONITOROINTI OLKILUODOSSA 2018 TIIVISTELMÄ Olkiluodon kalliomekaniikan monitorointiin kuuluu mahdollisten kallioperän tektonisten siirtymien sekä stabiiliuden arviointia eri menetelmin sekä ydinsulkuvalvonnan toteuttamista. Vuoden 2018 kalliomekaniikan monitoroinnin ohjelma sisälsi seismisiä, GPS-, tarkkavaaitus- ja lämpötilamittauksia Olkiluodossa sekä seismisiä, siirtymä-, ja lämpötilamittauksia sekä visuaalisten havaintojen kirjaamista loppusijoituslaitoksessa. Posiva valvoo maanjäristyksiä ja räjäytyksiä ONKALOssa ja sen ympäristössä mikroseismisellä asemaverkolla kallion vakauden ja rakenteen tutkimiseksi sekä osana ydinsulkuvalvontaa. Vuonna 2018 pysyvään asemaverkkoon kuului 18 seismistä mittausasemaa ja 22 sensoria. Lisäksi ONKALOssa on kymmenen väliaikaista sensoria tutkimustarkoituksia varten. Vaikka asemilla oli yksittäisiä toimintakatkoksia vuoden 2018 aikana, ONKALO-alueen seisminen valvonta oli jatkuvaa. Vuonna 2018 paikannettiin 876 seismistä tapausta seismiselle lähialueelle, joista 461 oli räjäytyksiä (ML = ), 166 mikromaanjäristyksiä (ML = ), ja 239 erilaisia pieniä tapauksia (ML = ) ONKALO-alueen sisällä. Lisäksi paikannettiin 10 räjäytystä (ML = ), seismiselle lähialueelle ja rekisteröitiin yksi kauempana sattunut maanjäristys (ML = 2.1). Vuonna 2018 loppusijoituslaitoksen rakennustöitä oli selvästi edellisvuotta vähemmän, ja myös töiden indusoimia mikromaanjäristyksiä rekisteröitiin vähemmän. Mikromaanjäristykset olivat edelleen voimakkuuksiltaan pieniä eivätkä ne aiheuttaneet visuaalisesti havaittavia muutoksia tai ihmisen havaitsemaa tärinää tai ääntä. Suurin osa mikromaanjäristyksistä voitiin katsoa rakennustöiden aiheuttamiksi eikä luonnollisia maanjäristyksiä havaittu ONKALO-alueella. Vaikka indusoitujen mikromaanjäristysten lukumäärä oli edelleen melko korkea, kalliomassan voidaan katsoa pysyneen vakaana vuoden 2018 aikana. Olkiluodon GPS-verkkoon kuuluu 17 asemaa, joista 16 asemalla on havainnot jatkuvasti käynnissä. Kunkin aseman päivittäisistä koordinaattiratkaisuista määritettiin muutosnopeudet ja niiden epävarmuudet huomioiden aikasarjojen kausivaihtelut ja epäjatkuvuudet. Jatkuvasti havaitsevien asemien suhteelliset vaakanopeuskomponentit (pohjois/itä) olivat enimmillään 0.2 mm/v ja suurimmaksi osaksi alle ± 0.1 mm/v. Vaakanopeuksien epävarmuudet olivat keskimäärin 0.1 mm/v 95 % luottamustasolla. Suhteelliset pystyliikkeet olivat suurimmaksi osaksi alle ± 0.5 mm/v. Pystyliikkeiden epävarmuudet olivat selvästi suurempia vaakaliikkeisiin nähden, keskimäärin 0.7 mm/v 95 % luottamustasolla. Muutamalla asemalla (GPS3, GPS16) havaittiin merkittäviä pystynopeuksia, jotka ovat kuitenkin epätodellisen suuria verrattuna tarkkavaaitustuloksiin. Vuoden 2018 vaaituksiin sisältyivät ONKALO-alue ja VLJ-alue. Perinteisesti Olkiluodon alueella merkittävin deformaatio on tapahtunut ONKALOn alueella. Verrattuna vuoteen 2006 kiintopiste on noussut 3.03 mm kiinnitetyn pisteen suhteen. Edellisestä vuodesta suurin muutos tapahtui pisteellä Sen korkeuslukema kiinnitettyyn pisteeseen nähden oli mm pienempi. Liikkeet VLJ:n alueella ovat olleet pieniä. Suurin ero edellisen vuoden mittauksiin oli mm kiintopisteellä GPS9B ja koko mittahistorian aikana korkeusmuutokset ovat olleet valtaosin puolen
8 millimetrin sisällä. Tehdyt mittaukset eivät muuttaneet näkemystä Olkiluodon kallioperän korkeudenmuutoksista. Uusia vaaitusmurroslinjoja ei havaittu. Uudet tulokset poikkesivat eniten edellisen vuoden tuloksista kiintopistevälillä ja 06221, jossa korkeuseron muutos oli 0.52 mm. Loppusijoituslaitokseen on asennettu seitsemälle eri mittausalueelle siirtymiä mittaavia ekstensometrejä, jotka ovat suurimmaksi osaksi toimineet katkoitta vuoden 2018 aikana. Useita sähkökatkoja tapahtui pysäköintihallin 1 ekstensometrien rekisteröinneissä. Loppusijoituslaitoksessa mitatut siirtymät olivat pienempiä kuin 0.2 mm. Lämpötilamittauksia tehtiin vuoden 2018 aikana yhdestä syväkairareiästä, ajotunnelista ja siirtymämittausten yhteydessä. Tulokset myötäilevät edellisten vuosien tuloksia. Mittausten perusteella, tunnelien lämpötilat seuraavat vuodenajan aiheuttamaa lämpötilan vaihtelua. Vuoden 2018 aikana loppusijoituslaitoksessa tehtiin 9 visuaalista havaintoa jännitystilan aiheuttamasta kiven rikkoutumisesta. Havaintojen määrä on laskenut vuodesta 2017, jolloin havaintoja oli 27 kpl. Suurin osa havainnoista oli kiven napsumista. Avainsanat: monitorointi, kalliomekaniikka, Olkiluoto, seisminen asemaverkko, mikromaanjäristys, indusoitu seismisyys, ydinsulkuvalvonta, GPS, tarkkavaaitus, ekstensometrit, lämpötilamittaukset, kiven naksunta.
9 1 TABLE OF CONTENTS ABSTRACT TIIVISTELMÄ PREFACE INTRODUCTION Monitoring Programme of Olkiluoto ROCK MECHANICS MONITORING OPERATION Microseismicity Seismic network Performance and operation in Changes in observation routines in Geodetic measurements Description of the GPS measurement and processing Description of the precise levelling work Displacement measurements Downtime Temperature measurements Visual observations in tunnels RESULTS AND MAIN OBSERVATIONS Microseismic monitoring Explosions Semi-regional area ONKALO block Seismicity Microearthquakes in the ONKALO block area Microearthquakes and the Olkiluoto fault zone model Regional earthquakes Other observations Probable rock falls Unidentified small events Miscellaneous small events Geodetic measurements GPS monitoring results Precise levelling results Precise levelling: height changes at the benchmark intervals Displacement measurements Surface extensometers Borehole extensometers POSE-niche Vehicle connection Demonstration tunnel Safety centre Parking hall Reversed-head extensometers Temperature measurements Measurements on the surface Measurements in drillholes Measurements in the final disposal facility ramp... 71
10 Temperature measurements of extensometers Visual observations in tunnels DISCUSSION CONCLUSIONS REFERENCES APPENDICES APPENDIX 1: CHANGES IN THE MONITORING PROGRAMME OF ROCK MECHANICS APPENDIX 2: SEISMIC OBSERVATIONS AT OLKILUOTO APPENDIX 3: ONKALO BLOCK MICROEARTHQUAKES IN APPENDIX 5: POSITION RESIDUAL TIME SERIES OF GPS MONITORING STATIONS APPENDIX 6: TECHNICAL INFORMATION ON THE INSTALLED EXTENSOMETERS OF THE FINAL DISPOSAL FACILITY APPENDIX 8: EXCEEDED ACTION LIMITS
11 3 PREFACE This work is part of the Posiva s monitoring programme for the Olkiluoto repository site. This report deals with the rock mechanical monitoring carried out in 2018 in Olkiluoto. Several authors have contributed to the text, according to following: Sophie Haapalehto (Posiva Oy) has compiled the overall text and written sections on the introduction, the displacement measurements, the temperature measurements and the visual tunnel observations and supervised the work. Marianne Malm and Outi Kaisko (ÅF-Consult Oy) have written sections on the microseismicity. Sonja Lahtinen (Maanmittauslaitos) has written sections on the GPS measurements. Veikko Saaranen (Maanmittauslaitos) has written sections on the surface levelling measurements.
12 4
13 5 1 INTRODUCTION Posiva Oy is responsible for the final disposal of spent nuclear fuel of the nuclear power plants of its owners, Fortum Power and Heat Oy and Teollisuuden Voima Oyj (TVO). The final disposal will take place in deep geological repository, which has been under construction since The repository is situated deep in the Finnish bedrock of Olkiluoto Island, in south-west of Finland. In 2004, the excavation of an underground rock characterization facility, called ONKALO, began, composed by an access tunnel, research tunnels and three shafts. The facility reaches a depth of over 450 meters (Figure 1-1). This characterization laboratory will be expanded into the final disposal facility. During 2018, underground excavation activities were lower than during 2017 at Olkiluoto. The excavations of the final disposal facility continued and mainly concentrated on the northern part of the parking halls and the western part of the demonstration area. Also most of the canister shaft was rise bored during The environmental impact and the influence on long-term safety of the repository of the constructions of ONKALO and the final disposal facility are monitored through different disciplines, both underground and in surface environment. The results of the monitoring are used in modelling the Olkiluoto site and in the assessment of long-term safety. This report presents the results of the rock mechanics monitoring during The rock mechanics monitoring consists of microseismic measurements, GPS measurements, precise levelling measurements, rock displacement measurements, visual observations in the final disposal facility tunnel and temperature measurements. The results from previous years of rock mechanics monitoring are presented in Ahola et al. (2005, 2006, 2007, 2008), Alterio & Siren (2013), Haapalehto et al. (2017, 2018), Johansson (2014, 2015), Johansson & Siren (2013), Johansson et al. (2017), Kallio et al. (2009, 2010, 2011), Koivula et al. (2012), Lahti et al. (2009), Lahti & Hakala (2010), Lahti & Siren (2011), Lehmuskoski (2004, 2006, 2008, 2010), Mattila (2007), Mattila & Hakala (2008), Nyberg et al. (2013, 2014, 2015), Ollikainen et al. (2004), Poutanen et al. (2010), Riikonen (2005, 2006), Saaranen et al. (2012), Saaranen & Rouhiainen (2014), Saari (2005), Saari & Lakio (2007, 2008), Saari & Malm (2010, 2011, 2012, 2013, 2014b, 2015a), Sedighi et al. (2013).

14 6 Figure 1-1. Overview of the rock characterization facility, ONKALO and the future final disposal facility with the geographic location of Olkiluoto (insert). By the end of 2018, the two panels and the LILW repository were not excavated, but the vehicle connections were mainly excavated. 1.1 Monitoring Programme of Olkiluoto In 1980 s the site investigations were started for suitability for the final disposal facility of the used nuclear fuel in different sites in Finland and were the precursor for the actual monitoring programme of Olkiluoto. The first monitoring programme was established in 2003 (Posiva 2003) and was applied since the beginning of ONKALO in For the application of the construction licence for the repository in 2012, the actual programme was published for the period before repository operation which includes the start of the development of monitoring of engineered barriers (Posiva 2012). The updated version of the programme fixed six objectives for the monitoring (Posiva 2012): 1. Long term safety (site). Demonstrating that the conditions in the surroundings of the repository remain favourable for long-term safety despite repository construction and operation. 2. Feedback to site characterisation and modelling. Acquiring data that can be used to define and test various models of the surroundings of the repository, which increases the understanding of the site and its evolution. 3. Monitoring the environmental impact. 4. Providing feedback for construction and design on the impact of construction on the geosphere and surface environment.
15 7 5. Engineered Barrier System (EBS) performance. Monitoring the performance of the engineered barrier system to confirm the basis for expected/predicted behaviour. 6. Compulsory radiological monitoring. Conducting the mandatory monitoring of radiation and of releases of radioactive substances in the environment of the repository. The aim of rock mechanics monitoring is to observe the possible changes in the stability of the bedrock and potential tectonic movements. In order to quantify those phenomena, rock mechanics monitoring records the observations of different processes (e.g. stress distribution, reactivation of existing fracture zones, rock creep, etc., Table 1-1). Table 1-1. Rock mechanics monitoring targets and objectives in function of different processes (Posiva 2012).
16 8 The monitoring programme of Posiva (2012) established a rock mechanics monitoring schedule for each year of the period before the repository operation with the different methods of rock mechanics (Table 1-2). Table 1-2. Rock mechanics monitoring schedule at Olkiluoto between 2012 and 2019 (modified from Posiva 2012). 2 = two measurement campaigns per year, 1 = one measurement campaign, C = continuous measuring. Target / method Location Microseismic monitoring 17 automated stations C C C C C C C C GPS measurements 16 automated C C C C C C C C stations 1) 1 manual station EDM baseline measurement 2) 2 Control marker measurement 1 1 3) 3) 3) 3) Precise levelling Loops: ONKALO, VLJ GPS network and Olkiluoto strait Olkiluoto-Lapijoki 1 1 Extensometer measurements C C C C C C C C Fracture zone measurements C C C C C Rock temperature C 4) C 4) C 4) C 4) C 4) C 4) C 4) C 4) measurements Visual tunnel observations C C C C C C C C 1) in station was ceased 2) ceased since ) done if necessary 4) also manual campaigns
, ONK-TT-4505 (AJYH17), ONK- TT-4505-189 (AJYH17.1), ONK-TT-4505-232 (AJYH17.2), ONK-TT-4505-419 (AJYH17.3), ONK-TT-4505-236 (AJYH19), ONK-TT-4665-286 (AJYH21) and ONK-TT-4951 (AJYH23).")
17 9 2 ROCK MECHANICS MONITORING OPERATION The 2018 excavations were located in (Figure 2-1): - The vehicle connections ONK-TYT (AJYH5), ONK-TT-4665 (AJYH15), ONK-TT (AJYH15.1), ONK-TT-4505 (AJYH17), ONK- TT (AJYH17.1), ONK-TT (AJYH17.2), ONK-TT (AJYH17.3), ONK-TT (AJYH19), ONK-TT (AJYH21) and ONK-TT-4951 (AJYH23). - The canister receiving station ONK-TT and turning place ONK-TT (KVA). - The central tunnel (ONK-TT ) and the first 20 meters of the deposition tunnel (ONK ) of the joint operating test tunnel - The storage hall at the eastern part of parking hall 1 - The canister shaft between 0 and -290 m Figure 2-1. Layout of the final disposal facility with the location of the vehicle connections (AJYH) 5, 15, 15.1, 17, 17.1, 17.2, 17.3, 19, 21, 23, the central tunnel and deposition tunnel of the joint operating test tunnel (JOTT), the storage hall (east side of parking hall 2) and the canister receiving station and its turning place excavated during 2018 (in red). View towards North. Red boxes show an approximate location of the excavations during Microseismicity The purpose of the microseismic (MS) monitoring at Olkiluoto is to improve the understanding of the structure, behavior, and long-term stability of the bedrock. The main target of the seismic monitoring is the underground final disposal facility and the rock
18 10 mass surrounding it. The observations give an opportunity to approximate in what extent and where the bedrock stability is disturbed and characterize the adjustment processes occurring in the surrounding rock mass. Furthermore, disturbed weakness zones in the rock mass surrounding the excavations can be interpreted. In addition, monitoring of the regional tectonic seismicity aims to better understanding of the ongoing seismotectonic processes around the Olkiluoto area. The seismic monitoring is also a part of Posiva's safeguards programme. The purpose of Posiva s nuclear non-proliferation control is to ensure that activities in the final disposal facility comply with all the relevant laws and degrees as well as the obligations prescribed in international agreements. The aim of the nuclear material control in the disposal facility is also to ensure that the facility, especially in its underground parts, has no rooms or operations outside the system of nuclear material accounting (Posiva 2006). Microseismic monitoring has been shown to be able to fulfill the requirements for monitoring this objective (Saari and Lakio 2007). In addition, another aim of the safeguarding will be to monitor that the waste canisters remain in their declared positions during the operation and after the closure of the facility (Posiva 2006). The seismic monitoring and interpretation is focused on a volume called the seismic ONKALO block, which is a cube with edge lengths of 2 km surrounding the current parts of the final disposal facility (Figure 2-2). All the excavation induced events are expected to occur within this volume. In addition to the site area, also monitoring at semi-regional scale is performed. Four stations are deployed further away from the facility for expanding the observations to the seismic semi-regional area (Figure 2-2). Within this area the detection capability and location accuracy of seismic events are lower than within the ONKALO block area due to the sparser network and more inaccurate velocity model.

19 11 Figure 2-2. Seismic stations for monitoring semi-regional seismicity (OL-OS8 OL-OS12). The seismic semi-regional area is marked with yellow and the seismic ONKALO block with light blue color. The distance between the grid lines is 5 km Seismic network Posiva s permanent seismic network consisted of 18 seismic stations including total of 22 sensors during the year 2018 (Table 2-1 and Figure 2-3). Altogether 14 of the seismic stations are located inside the seismic ONKALO block and four in the semi-regional area. In addition to the permanent stations, one triaxial sensor and nine uniaxial sensors deployed for study purposes are running, but excluded from the permanent network and automatic processing operations. These stations are available for manual processing, if needed. Development of the network as well as data management and interpretation practice are described by Saari and Malm (2019) and Johansson and others (2016). The stations are equipped with triaxial accelerometers or geophones. Four of the stations (OL-OS2, OL-OS3, OL-OS4, and OL-OS8) have two sensor types, accelerometers and geophones, for giving better sight on the seismicity of both the ONKALO block and the semi-regional area. The sensor types and locations of Posiva s current seismic network are presented in Table 2-1 and in Figure 2-2 and Figure 2-3.
20 12 Table 2-1. Location and sensor types of the Posiva s seismic station in 2018 in the Finnish KKJ coordinate system (zone 1). Elevation is determined from the sea level. Seismic station N (m) E (m) Z (m) Sensor type Data acquisition Installed (year) OL-OS NG 2002 OL-OS GS OL-OS GS OL-OS NG 2002 OL-OS NG 2002 OL-OS NG 2004 OL-OS GS OL-OS NG 2006 OL-OS NG 2006 OL-OS NG 2006 OL-OS NG 2006 OL-OS NG 2007 OL-OS NG 2017 ONK-OS NG 2008 ONK-OS NG 2010 ONK-OS GS ONK-OS GS ONK-OS GS Sensor types (nominal frequencies of geophones and highest usable frequency of accelerometers): 1 = Triaxial accelerometer, 3A2.3k (2000 Hz) 2 = Triaxial geophone, 3G30 (30 Hz) 3 = Triaxial geophone, Mark LC4-3D (1 Hz) 4 = Triaxial borehole geophone, 3G14 (14 Hz) 5 = Triaxial borehole accelerometer, 3A10k ( Hz)


21 13 Figure 2-3. Seismic stations (14) inside the seismic ONKALO block. Up: view from above, the distance between the grid lines is 100 m. Below: view from south, the distance between the grid lines is 100 m. Stations OL-OS2 OL-OS8 and OL-OS15 are on the ground surface, OL-OS13 in a borehole and stations ONK-OS1 ONK-OS5 in ONKALO Performance and operation in 2018 Because the operation breaks of single stations are unavoidable in any continuous monitoring, the network needs to be designed to perform sufficiently even when the network is partially down. In theory, the minimum number of stations for a location of a seismic event is three, but in practice the station geometry around the source effects the location accuracy. If all the stations are located within a small azimuth seen from the source, the location accuracy gets lower even if more stations are used for location. With Posiva s network, the typical duration of an operational break has been from few hours to few days. Majority of the breaks in 2018 were within this time frame. Exception was
22 14 the 98 days 14 hours 30 minutes long connection break on station OL-OS9 due to broken DSL modem. This has temporarily lowered the location accuracy in the semi-regional area. No major impact on the monitoring capability has been encountered during the other shorter breaks in Figure 2-4 and Table 2-2 summarize the operational breaks in the seismic stations during Detailed descriptions are presented in the monthly reports, which are published and archived in Posiva s electronic document management system (Kronodoc). The entire network was temporarily down on 12 May 2018 for 3 hours 45 minutes for an unknown reason. The IMS support was able to recover the operation remotely and backfill the data from the stations. This did not cause any break in the monitoring. The occurred connection breaks are mostly related to planned power outages, hardware and firmware failures, and data connection problems. Operation and breaks of seismic stations in 2018 OL-OS12 OL-OS11 OL-OS10 OL-OS9 OL-OS8 ONK-OS5 ONK-OS4 ONK-OS3 ONK-OS2 ONK-OS1 OL-OS15 OL-OS13 OL-OS7 OL-OS6 OL-OS5 OL-OS4 OL-OS3 OL-OS Figure 2-4. Operation times and breaks (see also Table 2-2) of the seismic stations monitoring mainly the ONKALO block (blue region) and the semi-regional area (yellow) in Station OL-OS8 is used for monitoring both areas. Operation breaks are marked with blue vertical lines. Red vertical block refers to simultaneous connection break of the whole network.
23 15 Table 2-2. Operation breaks of the seismic stations in 2018 (see also Figure 2-4). Station Time (UTC) Duration of break Explanation Solution OL-OS5 26 January 11:15-1 February 9:55 ONK-OS4 13 April 5:35-7:15 ONK-OS3 17 April 00:55-19 April 13:05 OL-OS11 21 April 6:40-26 April 2:50 OL-OS4 24 April 6:40-9:55 OL-OS3 17 May 14:55-18 May 12:10 OL-OS10 19 May 16:20-21 May 10:05 21 May 17:00-22 May 10:10 22 May 15:30-23 May 10:00 26 May 00:50-28 May 10:25 2 June 11:30-4 June 14:25 OL-OS8 13 July 10:45-16 July 9:10 ONK-S4 18 July 4:30-11:00 OL-OS7 29 July 18:05-30 July 9:30 OL-OS5 27 August 09:50-12:05 OL-OS4 27 September 05:40-06:35 OL-OS2 27 September 05:50-06:35 OL-OS2 31 October 15:30-5 November 09:40 OL-OS9 29 July 18:05-5 November 08:35 ONK-OS2 10 December 00:10-12 December 05:20 OL-OS11 26 December 22:05-8 January 07:45 5 d 22 h 40 min Hardware fault Connected to the server and fixed by IMS 1 h 40 min Unknown reason Got up by itself 2 d 12 h 10 min Unknown reason Restart of the DSLAM 4 d 20 h 10 min Connection problem with wifi-tower 3 h 15 min Planned power outage 21 h 15 min Problem with DSL link 1 d 17 h 45 min Fuse switching off because of faulty 17 h 10 min UPS? 18 h 30 min 2 d 9 h 35 min 2 d 2 h 55 min 2 d 22 h 25 min Residual-current device had switched off the power 6 h 30 min Planned power outage Got up by itself Got up by itself Restart of the DSLAM Change of UPS on 4 June Got up by itself after the power was restored Got up by itself after the power was restored 15 h 25 min Thunderstorm Manual reboot 2 h 15 min Unknown DSLAM restart by IMS and manual boot of the station 55 min Unknown Restart from Synapse 45 min Unknown Restart from Synapse 4 d 18 h 10 min Problem with GPS timer Manual reboot 98 d 14 h 30 min Broken New DSL modem DSL modem 2 d 5 h 10 min Corrupted flash Connected to the server and fixed by IMS 12 d 9 h 40 min Firmware update Connected to the server and fixed by IMS
24 16 The operation reliability of the network has been good during the previous years, and only two total breaks of monitoring has been encountered (cf. Haapalehto et al., 2017). For reliable performance of a monitoring system, systematic maintenance of the network is required. In 2018, the following maintenance operations were performed: Cables on OL-OS3 were checked on 24 January 2018 because of abnormal z- component. UPS related battery problem fixed on ONK-OS5 on 11 April Manual reboot of OL-OS13 on 30 July 2018 to fix frequent restarting after thunderstorm on 29 July Junction boxes changed on OL-OS8a and OL-OS15 on 16 August 2018, because of abnormal looking test pulses after the thunderstorm on 29 July DSL modem changed on OL-OS9 on 5 November 2018, which fixed the timing problem that started after the thunderstorm on 29 July Changes in observation routines in 2018 The following changes in observation routines were introduced in 2018: After March 2018 only the small events that have direct visual observation of fallen rocks were decided to be classified as probable rock falls, because based only on waveform data it is not unambiguous to define whether the event was caused by loosening tunnel roof or wall or by detachment of a rock. All other small events are classified as miscellaneous small events (caused by human activity) or unidentified small events. The STA/LTA ratio was changed for station ONK-TT2 from 44 -> 22 on 19 October 2018 and from 22 -> 19 on 23 October 2018 to test whether that would make the station to be associated to more events. Lowering the ratio did not lead to any noticeable improvement in the association even tough more triggers were gained, and the STA/LTA ratio was changed back to 44 on 30 November The new version of the detailed scale model ( v2) was updated to Vantage visualisation software on ÅF office computer in October IMS updated the Synapse server software on the Olkiluoto server computer and the station software to the newest version on 13 November After an update in the last quarter of 2018 the analysis software Trace has been using the signal arrival directions based location method by default.
25 Geodetic measurements Description of the GPS measurement and processing The purpose of the GPS measurements at Olkiluoto is to monitor secular crustal deformations (mainly horizontal) to estimate the bedrock stability. The GPS monitoring network consists of 17 observation sites established in four phases between 1994 and 2014 (Chen and Kakkuri 1995, Ollikainen et al. 2004, Poutanen et al. 2010, Koivula et al. 2012, Nyberg et al. 2015). The observation strategy was changed from the measurement campaign approach to the permanent tracking gradually between 2012 and The station network did not change during the year: 16 stations recorded continuously and one was observed seasonally (Haapalehto et al., 2018). There were no equipment changes during the year. The data was downloaded from the memory cards three times during the year in April, September and December. The battery of the station GPS17 had been broken in February, and it was replaced in April. The batteries of all other stations were changed in July. The receiver issues continued at the station GPS14. The equipment box was moved further away from the above power lines in November to avoid disturbances. A measurement campaign at the non-permanent station GPS12 (Pyrekari) was started on 16 th August. The receivers collected data nine full days. The data quality was analysed by checking data completeness, signal to noise ratio and multipaths. The quality indicators were analysed based on a single day data (day 261/2018). Data completeness describes the ratio of the number of the observed satellites versus the expected observations (based on satellite orbits). It varied between 92 and 100 % for all stations (10 cut-off angle used). At some stations (GPS2, GPS3, GPS11) the surrounding trees are causing increasing multipath effects, but for all stations they are still on acceptable level. The GPS data was processed using the Bernese GNSS Software (Dach et al. 2015). The new data was processed using the same strategy as in previous report (Haapalehto et al., 2018). The amount of rejected data of 2018 remained at the same level as usual varying between 0.5 and 1.5 %. The ambiguities were solved on average at 78 %. It was on the same level as in previous years Description of the precise levelling work The aim of the precise levelling is to monitor vertical changes on the Olkiluoto Island and its height changes relative to the mainland. The first levelling campaign was carried out in autumn The GPS network was scheduled to be levelled every second year and the Olkiluoto-Lapijoki line every fourth year. In 2006, current levelling loops were established and measured near the ONKALO excavation (Underground Rock Characterisation Facility) and the low and intermediate level waste repository VLJ. The previous precise levelling campaigns are presented in the Posiva working reports by Lehmuskoski (2004, 2006, 2008, and 2010), Saaranen et al. (2012), Saaranen and
26 18 Rouhiainen (2014), Nyberg et al. (2015), Johansson et al. (2016) and Haapalehto and others, (2017, 2018). According to monitoring schedule in 2018 ONKALO and VLJ loops were measured (Figure 2-5). The levelled distance in ONKALO loop is 2.8 km and in VLJ loop 0.8 km. In the 2018 measurements, the closing error in the ONKALO loop was 0.10 mm and in the VLJ loop mm. The benchmark intervals were measured in both directions in order to minimise systematic errors which is a typical procedure in levelling measurements. The height differences were corrected for rod meter, tidal deformation and refraction before the adjustment (Saaranen et al. 2014). The levelling observations were performed in by Paavo Rouhiainen (Finnish Geospatial Research Institute) with the participation of RTK. The following instruments were used: - Levelling instrument Zeiss DiNi12, number Rod pair (3 metres) Zeiss Nedo LD13, numbers and Tripod Wild GST - Thermometer Fluke 54 II Levelling rods were calibrated before and after the field measurements, using the FGI vertical rod comparator (Takalo 1999). The scale corrections and thermal expansion coefficients are presented in Table 2-3. Table 2-3. Calibration results for the rods and Calibration epochs Levelling epoch Rod Rod Rod Rod Thermal expansion (µm/m/ C) Scale correction (µm/m) at 20 C Thermal expansion (µm/m/ C) Scale correction (µm/m) at 20 C
 The borehole extensometers are composed of measuring points anchored at different depths inside boreholes and 2) The surface")
27 19 Figure 2-5. Levelling network and GPS stations on the Island. Micro loops ONKALO and VLJ were observed Displacement measurements The displacement measurements of the final depository are measured with extensometers. The measuring instruments can be divided into two categories: 1) The borehole extensometers are composed of measuring points anchored at different depths inside boreholes and 2) The surface extensometers are placed on each sides of a fault zone and attached to the wall of tunnels with measuring pins drilled in the rock. The extensometers can also be divided into two categories according to the purpose of the measure. Extensometers can monitor long term behaviour of the tunnels or measure short term influence of excavations i.e. rock response measurement. Most of the extensometers are installed before the excavations in order to monitor the excavations and to continue the monitoring at long term after the excavations. The installed surface extensometers were installed in order to replace the convergence measurements conducted in ONKALO between 2007 and The convergence measurements consist of systematic tunnel s displacement measurements. It requires installation of several measuring pins at the tunnel surface (walls and roof) and to install a wire between the pins (Figure 2-6). The strength of the wire is measured and compared to the previous measurements. The convergence measurements were stopped for several reasons. One of them is the work safety especially in the shafts. Secondly the chemistry of the mortar is not suitable with fluorescein sodium salt (NaFe) used in ONKALO to mark drilling water. The pin s mortar does not solidify because of the mix of NaFe. Consequently the pins move during the convergence measurement and the results are not reliable. And finally technically the convergence measurements are not suitable for an excavation environment counter to TVO s LILW disposal, where there is no excavation at the moment and very little traffic. In ONKALO the pins have to be installed in the tunnel before the excavation proceeds, but the explosions cause problems to the stability of the pins and the installation of convergence cables across the access tunnel causes
 In 2018 no new extensometers were installed.")
: - Surface extensometers on the walls of the access tunnel (ch. 2480 and ch. 3170) since 2015. - Borehole extensometers between ch.")
28 20 traffic stops. For these reasons Posiva decided to abandon the convergence measurements in ONKALO and to install surface extensometers which do not cause the same issues. Figure 2-6. Schematic view of a convergence measurement in a tunnel (modified from Johansson 2018) In 2018 no new extensometers were installed. At the end of December 2018, the network in the final repository consisted of the same network as in 2017 such as 7 different measuring areas (Figure 2-7, Table 2-4, Haapalehto et al. 2018): - Surface extensometers on the walls of the access tunnel (ch and ch. 3170) since Borehole extensometers between ch and POSE niche (ONK-TKU3) since 2010, in vehicle connection 13 (ONK-TT ) since 2016, in demonstration tunnel 3 (ONK-TDT ) since 2014, in parking hall 1 (ONK-TPH ) since 2016 and the safety centre 1 (ONK-TYT ) since The surface extensometers measure the eventual displacements of the brittle fault zones cutting the access tunnel. At the chainage 2480, seven surface extensometers form two triangles on the wall and on the roof of the access tunnel around the brittle fault zone OL- BFZ100. The brittle fault zone OL-BFZ020A is monitored by one triangle of surface extensometers installed on the wall of the ramp at chainage The borehole extensometers measure the response of the excavations in short term and monitor the eventual redistribution of the stress field around the tunnels in long term. All the borehole extensometers were installed first to measure the influence of the excavations of a new tunnel. After the excavations the extensometers are used to monitor the possible changes on the in situ stress field.
29 21 Figure 2-7. Location of extensometers in the final disposal facility. Three types of extensometers are installed in ONKALO: surface extensometers, borehole extensometers and reversed-head extensometers (from January to May 2016). View towards north.
30 22 Table 2-4. Nomenclature of installed extensometers in the final disposal facility in Extensometer ID Extensom eter ID (old) Type of extensometer EXTS_PL2480_1W EXT1 Surface - EXTS_PL2480_2W EXT2 Surface - EXTS_PL2480_3W EXT3 Surface - EXTS_PL2480_4R EXT4 Surface - EXTS_PL2480_5R EXT5 Surface - EXTS_PL2480_6R EXT6 Surface - EXTS_PL2480_7R EXT7 Surface - EXTS_PL3170_1W EXT1 Surface - EXTS_PL3170_2W EXT2 Surface - EXTS_PL3170_3W EXT3 Surface - EXT_TK1-PL22 C1 or E1 Borehole ONK-PR16 EXT_TK1-PL25 C2 or E2 Borehole ONK-PR17 EXT_PYHA1- PL11_1 EXT_PYHA1- PL26_2 EXT_PYHA1- PL44_3 E1 Borehole ONK-PP434 E2 Borehole ONK-PP432 E3 Borehole ONK-PP433 Hole ID Location Purpose ONKALO ramp Ch. 2480, on the wall; Between MP1 and MP2 ONKALO ramp Ch. 2480, on the wall; Between MP2 and MP3 ONKALO ramp Ch. 2480, on the wall; Between MP3 and MP1 ONKALO ramp Ch. 2480, on the roof; Between MP5 and MP6 ONKALO ramp Ch. 2480, on the roof; Between MP6 and MP7 ONKALO ramp Ch. 2480, on the roof; Between MP5 and MP7 ONKALO ramp Ch. 2480, on the roof; Between MP7 and MP8 ONKALO ramp Ch. 3170, on the wall; Between MP9 and MP10 ONKALO ramp Ch. 3170, on the wall; Between MP10 and MP11 ONKALO ramp Ch. 3170, on the wall; Between MP9 and MP11 Security centre 1; right wall; left extensometer Security centre 1; right wall; right extensometer Parking hall 1; right wall; left extensometer Parking hall 1; right wall; center extensometer Parking hall 1; right wall; right extensometer Measuring BFZ100 Measuring BFZ020 Monitoring the excavation of parking hall 1 Monitoring the excavation of parking hall 2 EXT_AJ13_PL58_1 R1 Borehole ONK-PP435 EXT_AJ13_PL58_2 R2 Borehole ONK-PP436 Vehicle connection tunnel 13 (PL58); lower Vehicle connection tunnel 13 (PL58); upper Monitoring of AJYH17 EXT_DEMO3_PL13 _1 EXT_DEMO3_PL14 _2 R1 Borehole ONK-PP419 R2 Borehole ONK-PP420 DEMO tunnel 3; on the right wall; right extensometer DEMO tunnel 3; right wall; left extensometer POPLU experiment and monitoring EXT_PL3620_POSE _1 - Borehole ONK-PP225 ONKALO ramp Ch. 3620; manual extensometer Monitoring In 2016, all the extensometers were renamed using their location and type of extensometer (Table 2-4, Haapalehto et al. 2017). Part of the extensometers were renamed in the previous monitoring report of 2015 and the same operation was reproduced for the new extensometers (Johansson et al. 2017). During this operation, the technical information of the extensometers was also assembled in Appendix 6. During reporting in 2019, an error was observed in this nomenclature. The error concerns two extensometers of the parking hall 1 and two of safety center 1. The error was corrected and the corrected data is republished in this year report. The error consists of mixed data between two extensometers of a same measurement area. In the previous
31 23 reports EXT_PYHA1_PL44_3 was reported as EXT_PYHA1_PL11_1 and vice versa. Also EXT_TK1_PL22_2 reported as EXT_TK1_PL25_1 and vice versa. Since September 2016, the displacements are reported every three months in internal reports in Kronodoc (Posiva s internal Document Management System) Downtime One downtime in Safety Center 1 on the 18 th of July between 8 am and 14 pm. No data was lost because of the datalogger s battery. Several downtimes were recorded in parking hall 1 during No data was lost because the datalogger s battery took over during the downtimes. The downtimes were recorded during : :00, :00-15:00, : :00; :00-12:00, : :00, :00-13:00, :00-9:00 and :00-6:00. On the at 12 am and on the at 0 am the surface extensometers at ch and on the 16 th of April 2018 at 12 pm ch did not register displacement, temperature and humidity measurements. Elsewhere the extensometers recorded data continuously during Temperature measurements Temperature monitoring at Olkiluoto site and in the final disposal facility was performed using different methods providing temperature measurements from drillhole water (geophysical and PFL measurements), air temperature and humidity measurements in the final disposal facility, extensometer measurements, air/water temperature at the surface. In 2018, the measures where done as follows: - No new data measured from geophysical loggings in In the future the geophysical measurements will not probably provide temperatures, because the newest probe technology does not need salinity and temperature measures for calibration as it did in the past. - PFL (Posiva Flow Log): OL-KR41. - Surface measurements for the environmental monitoring, weather stations OL- WOM1 and OL-WOM2 and measuring weirs of ditches from OL-MP2, OL-MP4 and OL-MP5. - Humidity measurements in the access tunnel of the final disposal facility at tunnel chainages 0 m, 55 m, 208 m, 580 m, 1255 m, 1970 m, 3003 m, 3125 m, 3209 m m, 3836 m, 3941 m and 4580 m (Figure 2-8). Data are available from January, February, March, June, July, August, September, November and December 2018 for all the measuring areas. Except for ch (data only from January, February, June, July, August, September), and outside (data from January, February, March, June, July, August, September and November).
32 24 - Extensometer measurements in the ramp close to the POSE niche (Ch. 3620) and in the demonstration tunnel 3 and the vehicle connection 13 at the depth of 422 m and in the technical rooms of the final disposal facility (safety centre 1) and parking hall 1 at the depth of 437 m. Temperature readings of sensors of extensometers were taken every hour except for the POSE niche extensometer where two manual readings were taken in April and October Surface extensometer sites in the brittle fault zones have four temperature sensors (three at ch m and one at ch m) and readings were taken twice a day at 0 AM and 12 PM except during the downtimes of April (see Chapter 2.3.1). Figure 2-8. Location of humidity measurements in the final disposal facility. The measurements are planned to be performed once a month as part of hydrogeological monitoring. 2.5 Visual observations in tunnels The visual observations consist of reporting the different rock damage observed in the tunnel. The damage can be rock noise, rock fall and/or spalling which indicate changes in the in situ stress field around the tunnel. These observations are valuable information even if they present a high bias due to their correlation with human presence inside the tunnel. As the displacements, the visual observations are reported four times in a year in an internal report in Finnish.
, was lower than in 2017 (213) which was an exceptionally active year when regarding the extremely low seismic activity during the previous years of")

33 25 3 RESULTS AND MAIN OBSERVATIONS 3.1 Microseismic monitoring The microseismic activity continued at relatively high level in However, the number of microearthquakes (166), was lower than in 2017 (213) which was an exceptionally active year when regarding the extremely low seismic activity during the previous years of microseismic monitoring in Olkiluoto. The number of the so called accepted, i.e. identified and analysed, explosions inside the seismic ONKALO block (461) was much lower than in 2017 (1130), because the excavation of the final disposal facility was much quieter after June The number of small events including miscellaneous small events, probable rock falls, and unidentified small events (239) was around the same level as in 2017 (278). The monthly statistics of the accepted events in 2018 are presented in Figure 3-1. Those include the microearthquakes, regional earthquakes, small events, and explosions inside the seismic ONKALO block, and inside the seismic semi-regional area. The identification criteria of these event types are described in Table 3-1 and more detailed in Kaisko and Malm (2019a). 150 Olkiluoto statistics Number of events Jan 18 Feb 18 Mar 18 Apr 18 microearthquakes regional earthquakes small events semi-reg. exp. outside ONKALO block ONKALO block explosions Figure 3-1. Monthly statistics of the analysed events in the Olkiluoto area in May 18 Jun 18 Jul 18 Aug 18 Sep 18 Oct 18 Nov 18 Dec 18 total
34 26 Table 3-1. The identification criteria of seismic event types. Event type Semi-regional explosion ONKALO block explosion Probable rock fall Miscellaneous small event Unidentified small event Microearthquake Regional earthquake Identification criteria Blast inside the seismic semi-regional area. First P-arrival outwards from the source. Uneven spectra. Blast inside the seismic ONKALO block. Reported by a contractor. Location within an area of ongoing excavation. First P-arrival outwards from the source. Uneven spectra. Small event that has direct visual observation of a collapse or fallen rock. Small event caused by human activity. Does not resemble an earthquake. Probable origin can be verified from daily reports. Small event with clear seismic signal, which could fulfil the criteria of a microearthquake. Inadequate number of stations for defining a source mechanism or accurate location. Origin cannot be verified. Separated from construction operations. Small earthquake inside the seismic ONKALO block. Location within the rock mass. Origin time separated from construction operations (e.g. occurrence during a ventilation break after a blast). Potentially creeping first movement. Energy only at low frequencies (microearthquakes close to tunnels) or evenly up to high frequencies (microearthquakes within bedrock). Radiation pattern indicating a source mechanism which cannot be originated from human activities. S/P-ratios varying with azimuth seen from the source. Efficient coupling of signal to bedrock when compared to other small events or blasts. Natural earthquake outside the seismic ONKALO block. Origin verified by Institute of Seismology, University of Helsinki Explosions Because the seismic monitoring is a part of the Posiva's safeguards programme (Posiva 2006), the observed explosions close to the final disposal facility, i.e. inside the seismic semi-regional area are located. If a cluster of explosions is recognised, the origin will be verified. The results of the monitoring are presented in two scales: in the semi-regional area (Chapter ) and more closely in the seismic ONKALO block (Chapter ). The applied interpretation practice is presented by Saari & Malm (2014b) Semi-regional area Altogether 471 explosions (ML = ) located in the seismic semi-regional area in 2018 are presented in Figure 3-2. All the events outside the seismic ONKALO block have occurred on the ground surface. Majority of the semi-regional events in 2018 were from excavation and construction works inside the seismic ONKALO block. A cluster of events outside the Olkiluoto island represent explosions from the rock quarry owned by Interrock Oy (Figure 3-2). Also, two of the events related to the switchyard construction work on the Olkiluoto island were located outside the seismic ONKALO block.
. Distance between the grid lines is 1 km. 3.1.1.2 ONKALO block The explosions (461 events, ML = -2.9 0.")
35 27 Figure 3-2. Observed 471 explosions inside the seismic semi-regional area (yellow), in The semiregional seismic stations (OL-OS8 OL-OS12) are presented and events are coloured by time. The size of the sphere is relative to the event s magnitude (ML). Distance between the grid lines is 1 km ONKALO block The explosions (461 events, ML = ) located inside the seismic ONKALO block are presented in Figure 3-3, Figure 3-4 and Figure 3-5. These explosions relate to the switchyard, encapsulation plant and fence construction works done on the ground surface together with the underground excavation in different parts of the final disposal facility. Majority of these located blasts are mentioned in the daily reports by YIT Rakennus Oy, which was responsible for the excavation of the final disposal facility, and in the blast list by Rauman Kaivin Oy and Lännen Kaivuu ja Louhinta, which were responsible for the construction works of the switchyard and canister shaft lid removal in 2018.

36 28 Figure 3-3. Explosions (461 events) inside the seismic ONKALO block in Events are coloured by depth. The size of the sphere is relative to the magnitude. Distance between the gridlines is 100 m.


37 29 Figure 3-4. Explosions (461 events) inside the seismic ONKALO block in Events are coloured by time. The size of the sphere is relative to the magnitude. Distance between the gridlines is 100 m. Figure 3-5. Cross section of the explosions (461) inside the seismic ONKALO block in Events are coloured by time. View from south. The size of the sphere is relative to the magnitude. Distance between the gridlines is 100 m.
38 30 On 10 February 2018 one small blast was located in vehicle connection 19 instead of vehicle connection 17.2 mentioned in the daily report. On 24 February one small blast which was not mentioned in the daily report was located in the vehicle connection 17 couple of minutes after the blasting located in vehicle connection 15. The registration did not resemble an earthquake. On 25 March one small blast was located in vehicle connection 15.1, but it was not mentioned in the daily reports or in the explosion list. YIT Rakennus Oy confirmed that there is a possibility that this small secondary blast is missing from the lists. Also 14 small secondary blasts could not be observed in 2018, because the waveforms of much larger simultaneous blasts from different location covered them. Total of 31 explosions inside the ONKALO block were located to the ground surface. These events related to the fence construction work in January and February, the raise boring shaft cover in April, the switchyard construction work in May and June and the construction of the encapsulation plant in July Altogether 430 blasts were located underground in the final disposal facility in These blasts are related to excavation works in the final disposal facility in the vehicle connections 5, 11, 15, 15.1, 17, 17.1, 17.2, 17.3, 19, 21, and 23, in the joint operating test tunnel and the storage hall, in the canister receiving station at -437 m level and the elevator pit, and also to the demolition of the raise boring base slab and shaft cover in -90 m and -180 m levels Seismicity Altogether 167 earthquakes were recorded with the seismic network of Posiva in Total of 166 (ML = ) of them occurred in the surroundings of the final disposal facility and one (ML = 2.1) of them occurred approximatively 100 km away. The observations are presented separately in the ONKALO block area (Chapter ) and in the regional scale (Chapter ) Microearthquakes in the ONKALO block area In 2018, altogether 166 microearthquakes were observed and analysed in the ONKALO block (Figure 3-6, Figure 3-7 and Figure 3-8, and Appendices 2 and 3). The microearthquakes occurred typically in the bedrock surrounding the excavated tunnels from minutes to hours after blasting. Also, microearthquakes induced by injection and other construction work were observed. Some of the earthquakes could not be directly related to the construction operations, but as occurring in the probably disturbed bedrock, they are not considered to be of natural origin.

 inside the seismic ONKALO block in 2018. Events are coloured by time.")
39 31 Figure 3-6. Microearthquakes (166) inside the seismic ONKALO block in Events are coloured by depth. View from above. The size of the sphere is relative to the magnitude. Distance between the gridlines is 100 m. Figure 3-7. Microearthquakes (166) inside the seismic ONKALO block in Events are coloured by time. View from above. The size of the sphere is relative to the magnitude. Distance between the gridlines is 100 m.

40 32 Figure 3-8. Cross section of the microearthquakes (166) inside the seismic ONKALO block in Events are coloured by time. View from south. The size of the sphere is relative to the magnitude. Distance between the gridlines is 100 m. All events since the beginning of seismic monitoring in Olkiluoto that were marked as microearthquakes were re-assessed for the microearthquake study for Posiva Oy (Kaisko and Malm, 2019b). Seven of the older events were interpreted not to fulfill all the characteristics of microearthquakes in the current knowledge. It is clear, that the interpretation of events has been much more difficult with less stations and not so advanced software in the earlier years. The following seven events were removed from the microearthquake list: :47: :23: :24: :42: :42: :59: :59:59.94 The following eleven events were added to the microearthquake list: :30: :31: :37: :37:59.15

41 :37: :45: :47: :47: :51: :52: :00:04.31 The events on 27 March 2011, 10 January 2014, and 4 June 2015 were previously on the small event list but were now re-assessed and interpreted as microearthquakes. The events on 14 March 2014 did not have locations before, but could now be located with the signal arrival directions based method. The study by Kaisko and Malm (2019b) presents more detailed analysis of some of the events including, for example, focal mechanisms, axes of the main stresses, and nodal planes with related structures. Two groups of events from 2018 are presented here as an example: injection induced microearthquakes on 2 September 2018 (Figure 3-9 and Figure 3-10) and microearthquakes in the vicinity of vehicle connection 17 (Figure 3-11 and Figure 3-12). Figure 3-9. Focal mechanism solutions (upper pictures) and axes of the main stresses (lower pictures) of the injection induced microearthquakes on 2 September Focal mechanisms are showing mainly reverse movement. Red = pressure (P), blue = tension (T), green = neutral (B). Distance between the gridlines is 100 m.

 and axes of the main stresses (lower pictures) of the microearthquakes in the vicinity")
42 34 Figure Two alternative nodal planes of the injection induced microearthquakes on 2 September 2018 with brittle fault zone OL-BFZ020a. Distance between the gridlines is 100 m. Figure Focal mechanism solutions (upper pictures) and axes of the main stresses (lower pictures) of the microearthquakes in the vicinity of vehicle connection 17. Focal mechanisms are showing implosional movement with normal component. Red = pressure (P), blue = tension (T), green = neutral (B). Distance between the gridlines is 100 m.
 model of Olkiluoto (Aaltonen et al. 2016) and the newest version of the detailed scale model (10.")
43 35 Figure Two alternative nodal planes of the microearthquakes in the vicinity of vehicle connection 17 with large fractures LF50, LF51, and LF52. Distance between the gridlines is 100 m Microearthquakes and the Olkiluoto fault zone model The observed induced microearthquakes allow the improvement and verification of the Olkiluoto fault zone model. The epicentres were analysed together with the brittle fault zone (BFZ) model of Olkiluoto (Aaltonen et al. 2016) and the newest version of the detailed scale model ( v2), and several areas of resemblance were identified. The zones which seem to relate to the observed microearthquakes were DSM-BFZ002 (Figure 3-13), DSM-BFZ006 (Figure 3-14), OL-BFZ019c (Figure 3-15), OL-BFZ020a (Figure 3-16), OL-BFZ045 (Figure 3-17), OL-BFZ063 (Figure 3-18), OL-BFZ084 (Figure 3-19), OL-BFZ135 (Figure 3-20), OL-BFZ207 (Figure 3-21), OL-BFZ265 (Figure 3-22), OL-BFZ297 (Figure 3-23), OL-BFZ300 (Figure 3-24), and OL-BFZ346 (Figure 3-25). Also large fractures LF20, LF34, LF41, LF42, LF46, LF47, LF48, LF49, LF50, LF52, and LF53 could possibly be related to some of the microearthquakes (Figure 3-26). The most active seismicity was observed to be related spatially to the areas where the excavation work passed a modelled fault zone, but also areas of higher seismicity with no connection to the modelled zones were observed. Anyhow, it can be concluded that no continuous activation of faults was observed and that the bedrock remained stable according to the seismic monitoring in It should be noted, that the microearthquakes presented in Figure 3-13 Figure 3-26 are the ones in the closest vicinity of structures in the current fault zone model. Other earthquakes might also be related to these structures but are not shown in the figures, because they are located further away from the planes presented in the model. Those microearthquakes could have occurred within the damage zones or the location estimates could contain large location errors. Also, it has to be emphasised that the structures in the geological model are only a presentation of the current knowledge of the faults. In addition, some of the microearthquakes might be located to the assumed extensions of the zones, but not near the mapped parts of them. They could be related to the structures, if the model is incomplete.
 that could be related to the brittle fault zone")

44 36 Figure Microearthquakes (4) that could be related to the brittle fault zone DSM-BFZ002. Up: view from above, below: view along the structure. Dark blue: 11 January 2018, ML = -1.3, blue: 26 January 2018 ML = -1.9, red: 26 September 2018 ML = -2.0 & Distance between the gridlines is 100 m.
 on 24 March 2018 that could be")

45 37 Figure Microearthquakes (4) on 24 March 2018 that could be related to the brittle fault zone DSM-BFZ006. Up: view from above, below: view along the structure. Distance between the gridlines is 100 m.

46 38 Figure Microearthquakes (5) that could be related to the brittle fault zone OL-BFZ019c. Up: view from above, below: view along the structure. Blue: 8 March 2018, red: 20 March Distance between the gridlines is 100 m.
 that could be related to the brittle fault zone OL-BFZ020a.")
47 39 Figure Microearthquakes (8) that could be related to the brittle fault zone OL-BFZ020a. View along the structure. Blue: 3 September 2018, red: 11 October 2018.
 that could be related to")

48 40 Figure Microearthquakes (20) that could be related to the brittle fault zone OL-BFZ045. Up: view from above, below: view along the structure. Distance between the gridlines is 100 m.
 that could be related to")

49 41 Figure Microearthquakes (23) that could be related to the brittle fault zone OL-BFZ063. Up: view from above, below: view along the structure. Distance between the gridlines is 100 m.

50 42 Figure Microearthquakes (7) that could be related to the brittle fault zone OL-BFZ084. Up: view from above, below: view along the structure. Distance between the gridlines is 100 m.
 that could be related to")

51 43 Figure Microearthquakes (13) that could be related to the brittle fault zone OL-BFZ135. Up: view from above, below: view along the structure. Distance between the gridlines is 100 m.
 that could be related to the brittle fault zone OL-BFZ207.")
52 44 Figure Microearthquake on 9 January 2018 (ML = -2.4) that could be related to the brittle fault zone OL-BFZ207. Up: view from above, below: view along the structure. Distance between the gridlines is 100 m.
 that could be related to the brittle")

53 45 Figure Microearthquakes (3) that could be related to the brittle fault zone OL-BFZ265. Up: view from above, below: view along the structure. Blue: 30 January 2018, red: 26 September Distance between the gridlines is 100 m.
 that could be related to the brittle")

54 46 Figure Microearthquakes (7) that could be related to the brittle fault zone OL-BFZ297. Up: view from above, below: view along the structure. Blue: 24 March 2018, red: 14 August Distance between the gridlines is 100 m.
 that could be related to")

55 47 Figure Microearthquakes (12) that could be related to the brittle fault zone OL-BFZ300. Up: view from above, below: view along the structure. Distance between the gridlines is 100 m.
 on 18 April 2018 that could be related to the brittle fault zone OL-BFZ346.")
56 48 Figure Microearthquakes (2) on 18 April 2018 that could be related to the brittle fault zone OL-BFZ346. Up: view from above, below: view along the structure. Distance between the gridlines is 100 m.

57 49 Figure Microearthquakes (166) in 2018 with possibly related large fractures LF20, LF34, LF41, LF42, LF46, LF47, LF48, LF49, LF50, LF52, and LF53. View from above. Distance between the gridlines is 100 m Regional earthquakes In 2018, the seismic network at Olkiluoto recorded one regional tectonic earthquake (Table 3-2) from Bohtnian Sea area, approximately 100 km northwest from Olkiluoto (Figure 3-27). The earthquake detection by the Olkiluoto network was confirmed by the Institute of Seismology, University of Helsinki (2019). Posiva s recordings of the regional earthquakes are valuable in seismic hazard studies, for example when the focal mechanisms are studied or the attenuation patterns of seismic signals are evaluated. Detailed descriptions of Posiva s recordings are presented in the monthly reports, which are published and archived in the Posiva s electronic document management system (Kronodoc). Table 3-2. Regional tectonic earthquake in 2018 recorded with Posiva s seismic network. Source parameters by Institute of Seismology, University of Helsinki (2019). Date Origin Time North East MLHEL Distance from Place (UTC) ( ) ( ) Olkiluoto (km) :07: Bothnian Sea

58 50 Figure Recording of the earthquake in Bothnian Sea on 18 December 2018 on station OL-OS Other observations In addition to monitoring of blasting and seismicity, seismic networks can detect seismic signals that are not generated by explosions or earthquakes. Because the seismic monitoring is a part of the Posiva s safeguards programme, the origins of these events are also verified when possible. In earlier years most of these events have been related to manual and mechanical rock removal works and loading, but in 2017 and 2018 also several events of unknown origins were observed. Altogether 239 small events (ML = ) were classified as probable rock falls, unidentified small events, and miscellaneous small events in 2018 (Chapters , , and Appendix 4) Probable rock falls The total of two probable rock falls (ML = -2.1 and -1.8) were located in the final disposal facility in 2018 (Figure 3-28). The probable rock falls were interpreted by the radiation patterns, which indicated collapse. Also, similar patterns could be caused by microearthquakes occurring in the roof or sides of the tunnels, when rock is partially loosened, but not actually collapsing. None of the recorded events interpreted as rock falls could be verified by direct visual observations. It was decided in March 2018 that only the small events with visual observations will be classified as probable rock falls.
 inside the seismic")

59 51 Figure Probable rock falls (2) inside the seismic ONKALO block on 2 January Up: view from above, below: view from south. The distance between the gridlines is 100 m.

60 Unidentified small events In 2018, a total of 217 small events (ML = ) were from unknown origins (Figure 3-29 and Figure 3-30). These events were classified as unidentified small events, because the possibility that they could be microearthquakes could not be excluded. Identification of the events could not be accomplished based on their radiation patterns nor on the daily reports by the constructors. Figure Unidentified small events (217) inside the seismic ONKALO block in View from above. The distance between the gridlines is 100 m.
 that were separated in time from other registrations, but seemed to be work related, were listed as miscellaneous small events in 2018 (Figure 3-31 and Figure 3-32).")
61 53 Figure Unidentified small events (217) inside the seismic ONKALO block in View from south. The distance between the gridlines is 100 m Miscellaneous small events Altogether 20 events (ML = ) that were separated in time from other registrations, but seemed to be work related, were listed as miscellaneous small events in 2018 (Figure 3-31 and Figure 3-32). Based on the daily reports by the contractors, most of the events could be associated with construction activities in the tunnels. For example, signals related to loading, preparing works at the switchyard, demolishing of the lid of the canister shaft on the ground surface, dropping of the calibration block of the buffer installation machine (BIM) into the disposal test hole, and other construction work were observed.
 inside the seismic ONKALO block in 2018.")
62 54 Figure Figure 16. Miscellaneous small events (20) inside the seismic ONKALO block in View from above. The distance between the gridlines is 100 m.

63 55 Figure Miscellaneous small events (20) inside the seismic ONKALO block in View from south. The distance between the gridlines is 100 m. 3.2 Geodetic measurements GPS monitoring results The station velocities with uncertainties were estimated using a time series analysis software Hector (Bos et al, 2013) as in the previous report (Haapalehto et al., 2018). The daily coordinate solutions were used as an input for the time series analysis. An example of the daily solutions is shown in Figure 3-33 for GPS3, and for other stations in Appendix 5. The constant trend due to reference frame has been removed to improve the visualisation. The noise of the daily solutions has been on the same level in 2018 as in earlier reports (Haapalehto et al., 2018). The functional model of the time series analysis consisted of a linear trend in addition to yearly and half-yearly seasonal signals for all stations except GPS12 with only campaign data. The same breaks were estimated for the GPS1 (three for the east component, two for north and up components due to the equipment changes and tree cut effects) as in the previous report (Haapalehto et al., 2018). We used a combination of power law noise model and white noise model. The combination has been widely used for the GPS time series to take into account the temporal correlation of the daily solutions and to achieve more realistic uncertainties. The uncertainties were estimated for all stations except GPS2 (reference stations in daily solutions) and GPS12 (campaign data). All the three coordinate components of a station were analysed separately. The estimated velocities in respect to the mean velocity of all stations are shown in Figure 3-34 and Table 3-3. The uncertainties are also given in Table 3-3 together with the time

64 56 span of the data and the percentage of the gaps in the data. All the missing daily solutions due to equipment failures or rejections during daily processing are counted as gaps. The horizontal velocities were very small indicating high stability of the area. The largest significant horizontal velocity was estimated for the station GPS9 (0.15 ± 0.03, 0.15 ± 0.05 mm/y, north and east respectively). The estimate of GPS1 is roughly significant (east 0.20 ± 0.07 mm/y) but affected by many discontinuities in last years. The estimate of GPS21 was one of the largest, but roughly one thirds smaller compared to the year before. Large changes are typical when the time series are rather short. The vertical velocities are much more uncertain compared to the horizontal velocities. In most cases, the one sigma uncertainty is on the level of the estimated trend. The stations GPS3 and GPS16 has shown negative trends in respect to the other stations (-1.8 mm/y for GPS3 (Figure 3 33), mm/y for GPS16). These estimates cannot be considered describing the site motion, as the precise levelling results show millimetre level stability during the time. The GPS observations may be affected by some unknown site or receiver specific issue. The GPS12 is a special case having only observations once per year. The velocities have been estimated by fitting linear trend to the daily solutions of four campaign. The results of the latest campaign showed an unknown jump of roughly 10 mm in north during the measurement campaign. The observations after the jump did not fit to the earlier years observations and they were removed from the velocity estimation. The reason for the jump is unknown, but probably related to the equipment rather than any geophysical motion. Figure Example of time series of daily solution at the station GPS3.

65 57 Figure Estimated station velocities relative to the mean velocity of all stations. The horizontal velocities are shown as black arrows and the vertical velocities as coloured circles which have been scaled in respect to the amount of available data. Vertical velocities of GPS3 and 16 are larger than 1mm/y.
66 58 Table 3-3. Estimated station velocities with uncertainties, timespan of the data and gaps. North East Up Years Gaps (%) GPS ± ± ± GPS ± none 0.05 ± none 0.40 ± none 5.7 none GPS ± ± ± GPS ± ± ± GPS ± ± ± GPS ± ± ± GPS ± ± ± GPS ± ± ± GPS ± none 0.32 ± none 0.11 ± none GPS ± ± ± GPS ± ± ± GPS ± ± ± GPS ± ± ± GPS ± ± ± GPS ± ± ± GPS ± ± ± GPS ± ± ± GPS ± ± ± Precise levelling results In this chapter the levelling observations are adjusted. Benchmark movements are presented relative to the fixed benchmarks and relative height changes between the end points of the benchmark intervals are analyzed. Additionally new land uplift rates are computed. Uplift rates were computed relative to the mean uplift of the permanent GPS stations like in the previous uplift computation (Haapasalo et al. 2017). The changes relative to the previous map are small, because there were new observations only over small loops. Relative uplift over ONKALO and VLJ is presented in Figure 3-35 and Figure ONKALO heights were computed relative to BM and VLJ heights relative to BM The deformation corrected starting value at BM is m, and at BM m. The fixed heights were corrected for land uplift using relative uplift differences in the levelling network (Saaranen et al. 2014) and thus they are approximate heights in the measuring epoch in According to land uplift computation, the fixed BM is located in the subsidence area (relative uplift rate is 0.09 mm/y). An idea is that after correcting uplift, the mean of the Olkiluoto levelling benchmarks would be about the same as the mean of their N2000 heights. In this report only the height differences between the points are used. In the adjustment of the 2018 levelling observations, there were 24 observations and 17 benchmarks (Table 3-4 and Table 3-5). A posteriori standard deviation for the levelling
67 59 campaign is ±0.20 mm/ km and an average precision of the heights is 0.10 mm. In the precision computation, it is assumed that the fixed heights are error-free. The 2018 heights were compared to the previous results. According to the comparison, height changes in the ONKALO loop still exist (Table 3-6). The largest change between the 2017 and 2018 results was 0.47 mm at BM The most remarkable deformation in the levelling network has happened at the BM 06220, which has uplifted 3.03 mm (relative to BM 03216) since The vertical changes in the VLJ loop are presented relative to BM which is located in the middle of the loop (Figure 3-36) and (Table 3-7). The largest height change from 2017 to 2018 is mm at the BM GPS9B. Since 2006 the movements have been less than 0.5 mm, so locally the VLJ area is stable. Table 3-4. An adjustment of the 2018 levelling observations BM BM Distance (km) Observation (m) Adjustment correction (mm) Adjusted height diff. (m) GPS9B GPS9B GPS9A GPS9A GPS9B GPS9B
68 60 Table 3-5. The heights from the 2018 levelling adjustment BM Height (m) Precision (mm) Area Fixed ONKALO ONKALO ONKALO ONKALO ONKALO ONKALO ONKALO ONKALO ONKALO ONKALO ONKALO VLJ Fixed VLJ VLJ VLJ GPS9A VLJ GPS9B VLJ
 in the ONKALO loop from different observation years to 2018. For the comparison the BM 03216 has been fixed.")
69 61 Figure Benchmarks in the ONKALO loop and the relative uplift (blue, red and green lines, mm/y). ONKALO is represented in yellow. Table 3-6. The height changes (in millimetres) in the ONKALO loop from different observation years to For the comparison the BM has been fixed. BM
 in the VLJ loop from different observation years to 2018. In the comparison BM 06214 has been fixed.")
70 62 Figure The benchmarks in the Loop VLJ and the deformation of the area (mm/y). The VLJ-repository is represented in yellow. Table 3-7. Local height changes (in millimetres) in the VLJ loop from different observation years to In the comparison BM has been fixed. BM GPS9A GPS9B Precise levelling: height changes at the benchmark intervals The uncertainty of a levelling measurement is relative to the measured distance. The smaller the levelled distance, the smaller are the movements that can be reliably detected. The uncertainty computation is same as in previous report (Haapalehto et al., 2018). If the height change is three times larger than the expected levelling error, then it is assumed to be significant. The standard deviations for the yearly measurements are presented in Table 3-8. Since 2010, the standard deviations are from the levelling network adjustments. For the levellings of , the standard deviations were estimated from the closing errors of the loops (Kääriäinen 1966). For those old levellings, the standard deviations from the least squares adjustments could be more realistic than the old values which don t use all the corrections for the observations. Anyway, the height change analysis is a very heuristic technique and it is used to discover abnormal movements from the large data set. It really does not make any difference if the significance of the height change is 10- sigma or 20-sigma; it just tells that the height change is real and not a levelling error.
. In Figure 3-37, the locations of the most important levelling fault lines are presented.")
71 63 A largest height change from 2017 to 2018 is 0.52 mm in the benchmark interval from to Between these benchmarks, the difference between 2006 and 2018 is the most significant change (Table 3-9). In Figure 3-37, the locations of the most important levelling fault lines are presented. Levelling fault lines do not express exact locations of possible fractures. They simply describe that benchmarks have different vertical movements between the observation epochs. Figure The locations of the most significant height changes. At the moment deformations are focused on the ONKALO area. Table 3-8. Standard deviations for the levelling campaigns (± mmmm/ kkkk) Table 3-9. The most significant (SS ττ ) height changes in the ONKALO and VLJ loops. BM BM SS ττ Height chance (mm) Distance (km) Year 1 Year 2 Research area ONKALO ONKALO ONKALO GPS9A VLJ
72 Displacement measurements Surface extensometers The results of the extensometers EXTS_PL2480_1-3W, EXTS_PL2480_6-7R and EXTS_PL3170_1 and 3W show that no significant displacement was registered in 2018 on the monitored brittle fault zones BFZ100 and BFZ020 (Figure 3-38 and Figure 3-39). Only EXTS_PL2480_5R and EXTS_PL3180_2W show a change which started during 2017 (less than 0.2 mm for 5R and less than 0.1 mm for 2W). Figure Displacement measurements of the surface extensometers EXTS_PL2480 September December The red lines represent the operational breaks due to the blackouts in the tunnel.
73 65 Figure Displacement measurements of the surface extensometers EXTS_PL3170 September December The red lines and zone represent the operational breaks due to the blackouts in the tunnel.
74 Borehole extensometers POSE-niche The displacement measurements of POSE continued the same increasing trend from previous years (Figure 3-40). The major change was less than 0.1 mm. Two measurements were conducted during 2018 (10.4. and ). The second measurement of October was not successful for the last anchor (EXT_PL3620_POSE_1 29.7m). The reason is probably a dysfunction on the connections between the anchor and the reading head. Figure Displacement measurements of extensometer EXT_PL3620_POSE_1 between February 2010 and December 2018.
75 Vehicle connection 13 The results of vehicle connection 13 show the same slightly decreasing trend as during 2017 (Figure 3-41). The major change during 2018 was -0.1 mm (extension). Figure Displacement measurements of extensometer EXT_AJ13_PL58_1 and EXT_AJ13_PL58_2 between May 2016 and December Demonstration tunnel 3 The displacement measurements of demonstration tunnel 3 were stable as during previous years (Figure 3-42). Figure Displacement measurements of extensometers of demonstration tunnel 3. Red dashed lines mark the downtimes.
76 Safety centre 1 The displacements in the safety center 1 were stable during The main trend of 2017 continued during 2018 (Figure 3-43). Figure Displacement measurements of extensometers of the safety center 1 between January 2016 and December Red dashed lines mark the downtimes.

77 Parking hall 1 The displacements of parking hall 1 were stable during 2018 (Figure 3-44). The maintenance of 2017 seems to be successful. Figure Displacement measurements of parking hall 1 between April 2016 and December Red dashed lines mark the downtimes. During October 2017 a maintenance work was carried out for EXT_PYHA1_PL11_1 (21.8m) and EXT_PYHA1_PL26_2 (3.5m) Reversed-head extensometers No results from The extensometers installed in the profile of the parking hall 2 in 2016 and extensometers were destroyed during the excavation of the parking hall 2 (Haapalehto et al. 2017). 3.4 Temperature measurements Measurements on the surface The results of the temperature monitoring at the surface are reported in the monitoring report of environment of 2018 (Sojakka et al. 2019). In the future the results of the surface temperatures monitoring will be reported in the monitoring reports of environment.
78 Measurements in drillholes During 2018 only one deep drillhole were investigated with Posiva Flow Log (Figure 3-45). OL-KR41 were measured and the temperature results did not differ dramatically from previous measurement campaigns (2006 and 2011). Olkiluoto, drillhole OL-KR41 Temperature of drillhole water Measured without lower rubber disks: Without pumping, With pumping, Without pumping, With pumping, Without pumping, With pumping, Measured with lower rubber disks: Time series of fracture-specific water (drawdown = 10 m), Last in time series, fracture-specific water (drawdown = 10 m), Time series of fracture-specific water (drawdown = 10 m), Last in time series, fracture-specific water (drawdown = 10 m), Time series of fracture-specific water (drawdown = 22 m), Last in time series, fracture-specific water (drawdown = 22 m), Time series of fracture-specific water (drawdown = 10 m), Average of 10 last EC measurements in time series, fracture-specific water (drawdown = 10 m), Time series of fracture-specific water (drawdown = 22 m), Average of 10 last EC measurements in time series, fracture-specific water (drawdown = 22 m), Depth (m) Temperature (oc) Figure Posiva Flow Log measurement from OL-KR41 made during The temperature does not differ from the previous measurements.

79 Measurements in the final disposal facility ramp Results from outside and the final disposal facility ramp (tunnel chainages ) are presented in Figure 3-46, Figure 3-47 and Figure The results are affected by the ventilation and natural fluctuation indicating cooler temperatures in the wintertime and warmer temperatures in the summer time. Variation is currently typically around 5ºC with maximum being around 10ºC. Data are available from January, February, March, June, July, August, September, November and December 2018 for all the measuring areas. Except for ch (data only from January, February, June, July, August, September), and outside (data from January, February, March, June, July, August, September and November). The reason for missing measures is the lack of time. Figure Temperature measurements in , outside air and the final disposal facility s access tunnel ch


80 72 Figure Temperature measurements in , the final disposal facility s access tunnel ch Figure Temperature measurements in , the final disposal facility s access tunnel ch

81 Temperature measurements of extensometers Temperature is measured using two different ways: inside the borehole on the location of the anchor and outside the borehole, on the wall of the tunnel where the extensometer is installed. - Vehicle connection 13: the temperatures vary between 12 and 17.5 C during The variations of the temperature inside the vehicle connection 13 were due to the seasonal changes of temperature in ONKALO (yellow line in Figure 3-49). Figure Temperature variations of extensometers in vehicle connection 13 between end of November 2016 and end of December The yellow line represents the air temperature in vehicle tunnel Demonstration tunnel 3/POPLU: the temperatures measured during 2018 in the boreholes of extensometers do indicate normal annual variations (Figure 3-50). the Full-scale In-Situ System Test (FISST) in demonstration tunnel 2 or the excavation of vehicle tunnel 11 near the demonstration area seem to influence the changes in the demonstration tunnel 3. The results of ambient temperatures are disturbed probably from the tunnel activities.
, EXT_DEMO3_PL14_2 (ONK- PP420)and ambient temperatures and relative humidity in demonstration")
82 74 Figure Temperature variations between 2017 and 2018 in the borehole of extensometer EXT_DEMO3_PL13_1 (ONK-PP419), EXT_DEMO3_PL14_2 (ONK- PP420)and ambient temperatures and relative humidity in demonstration tunnel 3. - Surface extensometers ch and ch. 3170: the measured temperature on the walls and roof of the tunnel varies with natural annual temperature variation (Figure 3-51 and Figure 3-52). The increase of humidity during the summer can explain the curves in saw-tooth. Figure Temperature variations of surface extensometers EXTS_PL2480 between 2015 and Red dashed lines represent downtimes.
83 75 Figure Temperature variations of surface extensometers EXTS_PL3170 between 2015 and Red dashed lines represent downtimes. - Investigation niche 3 TKU3 (POSE): the extensometer was measured on 10 th of April and 12 th of October The temperatures continue their increasing tendency (Figure 3-53). Figure Temperature variations pf EXT_PL3260_POSE_1 at 14.8 m, 26.2 m and 29.7 m b. l. (borehole length) between 2010 and 2018.
. Figure 3-54.")

84 76 - Parking hall 1: the temperature in the extensometers boreholes varied between 12 and 18 C in Largest increased were measured at the anchors situated at the closest to the excavated parking hall 2. A seasonal variation is also detectable (Figure 3-54). Figure Temperature variations of extensometers of parking hall 1 between the end of April and end of December In October 2017 the extensometer was replaced due to the condensed water inside the extensometer. Downtimes are symbolized by the red lines. - Safety centre 1: the mean temperatures in boreholes measured during 2018 vary between 12 and 16.5 C for (Figure 3-55). The saw-tooth curves are probably due to an electrical noise inside the measuring tool during the measurement of the logger of the extensometers. Figure Temperature variations of EXT_TK1-PL22_1 at 7.0 m and 12.8 m b.l. and EXT_TK1-PL25_2 at 7.0 m and 12.8 m b.l. (borehole length) between 2011 and 2018.
.")
85 Visual observations in tunnels During 2018, the number of visual observations was very small comparatively to previous years (Figure 3-57). Mainly the observations were rock noise and they were located in excavations areas (vehicle connection 17 and 15). During 2018 only 9 observations were made whereas 26 observations in 2017 and 18 in 2016 (Figure 3-58). The main reason to this is the decreased amount of excavated volume in comparison to previous years. The visual observations are directly connected to the excavation intensity. The amount of excavated volume but also the presence of observers in the tunnels have an impact on the number of observations. One exception is a fracturing observation in the demonstration tunnel 2 (ch. 53) at the location of the FISST-plug. During the GPR measurements of January 2018, a floor s fracture has expanded at the emplacement of the future plug (Figure 3-56). The reopening of the fracture is probably due to loosening of the rock at the plug s emplacement. Figure Fracturing observed at the location of FISST-plug (demonstration tunnel 2 ch. 53) during January Probably a reopening of a EDZ-fracture on the floor.

86 78 Figure Location of the visual observations made during Most of the observations was located in the excavation areas and were rock noise Number of visual observations Number of blasts Visual observations Blasts (on surface and in tunnels) Figure Comparison between number of explosions in ONKALO block and the number of visual observations between 2007 and 2018.
87 79 4 DISCUSSION In this chapter, we will give a short discussion of interdisciplinary assessment of all the methods used in the rock mechanics monitoring and compare it to the discussion of year report of In 2016, the vertical and horizontal velocities acquired through GPS measurements suggested that the blocks situated above and below the brittle fault zone BFZ020a are moving to some extent vertically and horizontally in opposite directions. The footwall of BFZ020a is moving upwards and towards NW, while the hanging wall is moving downwards and SE and with the zone dipping towards SE. The data indicates that normal faulting could take place within the zone. During 2017 this observation was not confirmed by GPS-stations or precise levelling measurements which indicates only a difference of 0.01mm/a between the northern and southern parts of BFZ020a. During 2018 we acquired again the same tendency from GPS-stations, but precise levelling measurements did not crossed BFZ020a at the surface of Olkiluoto. In the previous report in 2016 we concluded that BFZ020a is a potentially unstable zone and the issue requires further assessment as monitoring data accumulates and longer time-series are available. For the year 2017 we concluded that the monitoring data indicates a stable state of BFZ020a. The surface extensometers did not measure any displacement. And we can do the same conclusion for The issue requires further assessment as monitoring data accumulates and longer time-series are available. Three of the visual observations (rock noise) could be linked to observed seismic events in ONKALO (Figure 4-1 Figure 4-2).
 on 11 April 2018 at 22:39 (UTC), red sphere: microearthquake (M L = -1.")

88 80 Figure 4-1. Seismic events possibly related to rock noise observation in vehicle connection 17. Blue sphere: unidentified small event (M L = -2.2) on 11 April 2018 at 22:39 (UTC), red sphere: microearthquake (M L = -1.9) on 12 April 2018 at 07:29 (UTC), yellow triangle: rock noise observation on 12 April in vehicle connection 17 chainage 377. The distance between the gridlines is 100 m. Figure 4-2. Seismic events possibly related to rock noise observation in vehicle connection 15. Blue sphere: unidentified small event (M L = -2.3) on 21 April 2018 at 20:00 (UTC), red sphere: unidentified small event (M L = -2.5) on 21 April 2018 at 23:34 (UTC), yellow triangle: rock noise observation on 21 April 2018 in vehicle connection 15 chainage 487. The distance between the gridlines is 100 m.
 on 26 April 2018 at 00:03 (UTC), yellow triangle: rock noise observation on 26 April 2018 in vehicle connection 15 chainage 447. The distance between the gridlines is 100 m.")
89 81 Figure 4-3. Seismic event possibly related to rock noise observation in vehicle connection 15. Red sphere: microearthquake (ML = -2.6) on 26 April 2018 at 00:03 (UTC), yellow triangle: rock noise observation on 26 April 2018 in vehicle connection 15 chainage 447. The distance between the gridlines is 100 m. The increased amount of visual observations and the microseismic activity in the ONKALO block during 2017 were linked to the excavation intensity. During 2018 the excavation intensity decreased and also did the microseismic activity and visual observations. In conclusion the bedrock of Olkiluoto remains stable.
90 82
91 83 5 CONCLUSIONS The rock mechanics monitoring at Olkiluoto concentrates on the assessment of potential tectonic movements and stability of the bedrock. The evaluation of any tectonic events or possible instabilities is important for the safety assessment. The rock mechanics monitoring programme 2018 consisted of microseismic measurements, GPS, surface levelling and temperature measurements at Olkiluoto and in its vicinity and seismic, displacement measurements, temperature measurements and visual tunnel observations made in the final disposal facility. The excavation activity of the final disposal facility was decreasing during Altogether 166 microearthquakes were recorded, but the microseismic activity was observed to significantly decrease with the decreasing excavation activity. As in 2017, the magnitudes of the microearthquakes remained small and neither earthquakes nor their impacts were observed with human aids. Most of the microearthquakes were directly induced by blasting, but also earthquakes induced by injection operations and scaling were observed. Some microearthquakes occurred in probably disturbed bedrock close to the excavation, but were not closely related to blasting or other construction operations in time. In the point of view of the extensometers the tunnels were rather stable because the new excavations areas were in majority situated in other areas than the measurement areas. Still, the effects of excavation to the bedrock stability were minor. The temperature, GPS and precise levelling measurements of 2018 did not show remarkable differences to the previous years.
92 84
93 85 6 REFERENCES Aaltonen, I. (ed.), Engström, J., Front, K., Gehör, S., Kosunen, P., Kärki, A., Paananen, M., Paulamäki, S., Mattila, J., Geology of Olkiluoto, POSIVA Report Posiva Oy, Olkiluoto, Finland. Ahola, J., Koivula, H., Poutanen, M. and Jokela, J GPS operations at Olkiluoto, Kivetty and Romuvaara in Working Report Posiva Oy, Olkiluoto, Finland. Ahola, J., Koivula, H. and Jokela, J GPS operations at Olkiluoto, Kivetty and Romuvaara in Working Report Posiva Oy, Olkiluoto, Finland. Ahola, J., Ollikainen, M., Koivula, H. and Jokela, J GPS operations at Olkiluoto, Kivetty and Romuvaara in Working Report Posiva Oy, Olkiluoto, Finland. Ahola, J., Ollikainen, M., Koivula, H. and Jokela, J GPS operations at Olkiluoto, Kivetty and Romuvaara in Working Report Posiva Oy, Olkiluoto, Finland. Alterio, I. (ed.) & Siren, T Results of monitoring at Olkiluoto in 2011, Rock Mechanics. Working Report Posiva Oy, Olkiluoto, Finland. Bos, M. S., Fernandes, R. M. S., Williams, S. D. P., and Bastos, L Fast Error Analysis of Continuous GNSS Observations with Missing Data.J. Geod., Vol. 87(4), , doi: /s Chen, R. & Kakkuri, J GPS Work at Olkiluoto for the Year of Work Report PATU-95-30e, Teollisuuden Voima Oy. Helsinki. 11 pages. Dach, R., Andritsch, F., Arnold, D., Bertone, S., Fridez, P., Jäggi, A., Jean, Y., Maier, A., Mervart, L., Meyer, U., Orliac, E., Ortiz Geist, E., Prange, L., Scaramuzza, S., Schaer, S., Sidorov, D., Sušnik, A., Villiger, A., Walser, P., Baumann, C., Beutler, G., Bock, H., Gäde, A., Lutz, S., Meindl, M., Ostini, L., Sośnica, K., Steinbach, A., Thaller, D. (2015). Bernese GNSS Software Version 5.2. Astronomical Institute, University of Bern, Nov pages. Haapalehto, S., Malm, M., Saari, J., Lahtinen, S., Saaranen, V Results of Monitoring at Olkiluoto in 2016, Rock Mechanics. Working Report , Posiva Oy. Haapalehto, S. (ed.), Malm, M., Saari, J., Lahtinen, S., Saaranen, V Results of Monitoring at Olkiluoto in 2017, Rock Mechanics. Working Report , Posiva Oy. Institute of Seismology, University of Helsinki, Johansson, E. (ed.) Results of monitoring at Olkiluoto in 2013, Rock mechanics. Working Report Posiva Oy, Olkiluoto, Finland.
94 86 Johansson, E. (ed.) Results of monitoring at Olkiluoto in 2014, Rock mechanics. Working Report Posiva Oy, Olkiluoto, Finland. Johansson, E Olkiluodon VLJ-luolan kallioperän kalliomekaaninen monitorointi Työraportti VLJ-2/ p. Teollisuuden Voima, Olkiluoto, Finland. Johansson, E. & Siren, T Results of monitoring at Olkiluoto in 2012, Rock mechanics. Working Report Posiva Oy, Olkiluoto, Finland. Johansson, E., Saari, J., Malm, M., Lahtinen, S., Saaranen, V., Kallio, U., Koivula, H., Rouhiainen, P., Haapalehto, S Results of Monitoring at Olkiluoto in 2015, Rock Mechanics. Working Report , Posiva Oy. Kaisko, O. and Malm M. 2019a. Identification and classification of seismic events registered by Olkiluoto Seismic network. Posiva s internal memo (POS ), (in progress). Kaisko, O. and Malm M. 2019b. Microearthquakes during the construction and excavation of the final repository for the spent nuclear fuel at Olkiluoto in Working Report , Posiva Oy, Olkiluoto, Finland (in progress). Kallio, U., Ahola, J., Koivula, H. and Poutanen, M GPS operations at Olkiluoto, Kivetty and Romuvaara in Working Report Posiva Oy, Olkiluoto, Finland. Kallio, U., Nyberg, S., Koivula, H., Jokela, J., Poutanen, M. and Ahola, J GPS Operations at Olkiluoto in Working Report Posiva Oy, Olkiluoto, Finland. Kallio, U., Nyberg, S., Koivula, H., Jokela, J. & Poutanen, M GPS Operations at Olkiluoto, Kivetty and Romuvaara in Working Report Posiva Oy, Olkiluoto, Finland. Koivula, H., Kallio, U., Nyberg, S., Jokela, J. and Poutanen, M GPS Operations at Olkiluoto in Posiva Working Report Posiva Oy, Olkiluoto, Finland. 58 p. Lahti, M., Saari, J., Lakio, A., Kallio, U., Ahola, J., Jokela, J., Poutanen, M. and Kemppainen, K Results of monitoring at Olkiluoto in 2008, Rock Mechanics. Working Report Posiva Oy, Olkiluoto, Finland. Lahti, M. (ed.) & Hakala, M Results of monitoring at Olkiluoto in 2009, Rock Mechanics. Working Report Posiva Oy, Olkiluoto, Finland. Lahti, M. (ed.) & Siren, T Results of Monitoring at Olkiluoto in 2010 Rock Mechanics. Working Report Posiva Oy, Olkiluoto, Finland. Lehmuskoski, P Precise Levelling of the Olkiluoto GPS Network in Working Report Posiva Oy, Olkiluoto, Finland. Lehmuskoski, P Precise Levelling of the Olkiluoto GPS Network in Working Report Posiva Oy, Olkiluoto, Finland.
95 87 Lehmuskoski, P Precise Levelling Campaigns at Olkiluoto in Working Report Posiva Oy, Olkiluoto, Finland. Lehmuskoski, P Precise Levelling Campaigns at Olkiluoto in 2008 and Working Report Posiva Oy, Olkiluoto, Finland. Lehmuskoski, P., Saaranen, V., Takalo M. and Rouhiainen P Suomen Kolmannen tarkkavaaituksen kiintopisteluettelo. Bench mark list of the Third Levelling of Finland. Publications of the Finnish Geodetic Institute No Kirkkonummi, Finland. Kääriäinen, E. (1966). The Second Levelling of Finland. Publications of the Finnish Geodetic Institute No. 61. Helsinki, Finland. Mattila, J. (ed.) Results of monitoring at Olkiluoto in 2006, Rock Mechanics. Working Report Posiva Oy, Olkiluoto, Finland. Mattila, J. & Hakala, M Results of monitoring at Olkiluoto in 2007, Rock Mechanics. Working Report Posiva Oy, Olkiluoto, Finland. Nyberg, S., Kallio, U. and Koivula, H GPS deformation measurements at Olkiluoto in Working Report Posiva Oy, Olkiluoto, Finland. Nyberg, S., Kallio, U. and Koivula, H GPS deformation measurements at Olkiluoto in Working Report Posiva Oy, Olkiluoto, Finland. Nyberg, S., Saaranen, V., Kallio, U., Koivula, H. and Rouhiainen P Geodetic Deformation Measurements at Olkiluoto in Posiva Working Report Posiva Oy, Olkiluoto. 64 pages. Ollikainen, M., Ahola J. and Koivula H GPS operations at Olkiluoto, Kivetty and Romuvaara in Working Report Posiva Oy, Olkiluoto. 268 pages. Poutanen, M., Nyberg, S. and Ahola, J GPS measurements in Satakunta area. Posiva Working Report POSIVA Oy, Olkiluoto. 64 pages. Posiva Nuclear Waste Management of the Olkiluoto and Loviisa Power Plants: Programme for research, Development and technical Design for , TKS-2006, Posiva Oy. Riikonen, S. (ed.) Results of monitoring at Olkiluoto in 2004, Rock Mechanics. Working Report Posiva Oy, Olkiluoto, Finland. Riikonen, S. (ed.) Results of monitoring at Olkiluoto in 2005, Rock Mechanics. Working Report Posiva Oy, Olkiluoto, Finland. Saaranen, V., Rouhiainen, P. and Suurmäki, H Precise Levelling Campaigns at Olkiluoto in 2010 and Working Report Posiva Oy, Olkiluoto, Finland. Saaranen, V. & Rouhiainen, P Precise Levelling Campaigns at Olkiluoto in Working Report Posiva Oy, Olkiluoto, Finland.
96 88 Saaranen, V., Rouhiainen, P. and Suurmäki, H The Analysis of the Bedrock Deformation in Olkiluoto Using Precise Levelling Measurements. Working Report Posiva Oy, Olkiluoto, Finland. Saari, J Local Seismic Network at the Olkiluoto Site. Annual Report for Working Report Posiva Oy, Olkiluoto, Finland. Saari, J. & Lakio, A Local Seismic Network at the Olkiluoto Site. Annual Report for Posiva Oy, 48 p. Working Report Saari, J. & Lakio, A Local Seismic Network at the Olkiluoto Site. Annual Report for Posiva Oy, 38 p. Working Report Saari, J. & Malm, M Local Seismic Network at the Olkiluoto Site. Annual Report for Working Report Posiva Oy, Olkiluoto, Finland. Saari, J. & Malm, M Local Seismic Network at the Olkiluoto Site. Annual Report for Working Report Posiva Oy, Olkiluoto, Finland. Saari, J. & Malm, M Local Seismic Network at the Olkiluoto Site. Annual Report for Working Report Posiva Oy, Olkiluoto, Finland. Saari, J. & Malm, M Local seismic network at the Olkiluoto site. Annual report for Working Report Posiva Oy, Olkiluoto, Finland. Saari, J. & Malm M. 2014a. Seismic network at the Olkiluoto site and microearthquake observations in Working report Posiva Oy, Olkiluoto, Finland. Saari, J. & Malm, M. 2014b. Local seismic network at the Olkiluoto site. Annual report for Working Report Posiva Oy, Olkiluoto, Finland. Saari, J. & Malm, M. 2015a. Local seismic network at the Olkiluoto site. Annual report for Working Report Posiva Oy, Olkiluoto, Finland. Sedighi, M., Bennet, D., Masum, S.A., Thomas, H.R. and Johansson, E Analysis of temperature data at the Olkiluoto site. Working Report Posiva Oy, Olkiluoto, Finland. Takalo, M Verification of Automated Calibration of Precise Levelling Rods in Finland. Reports of the Finnish Geodetic Institute No. 99:7. Kirkkonummi, Finland.
97 89 7 APPENDICES APPENDIX 1: CHANGES IN THE MONITORING PROGRAMME OF ROCK MECHANICS Year Monitored parameters Changes in the monitoring programme Reports Seismicity Seismic network was established at Olkiluoto in 2002, original network consisted of six stations. WR , Seismic network at the Olkiluoto site Tectonic bedrock movements/horizontal displacements The permanent GPS station at Olkiluoto has operated since Local network of 10 pillars has been observed semiannually since In 2000 the observations were cancelled because of high ionospheric activity that was expected to distort the results. Baseline for electronic distance measurements established in WR PATU-95-30e, GPS work at Olkiluoto for year of 1994 WR PATU-96-07e, GPS operations at Olkiluoto, Kivetty and Romuvaara for 1995 WR PATU-96-65e, GPS operations at Olkiluoto, Kivetty and Romuvaara for 1996 WR PATU-98-08e, GPS operations at Olkiluoto, Kivetty and Romuvaara for 1997 WR99-31 GPS operations at Olkiluoto, Kivetty and Romuvaara for 1998 WR , GPS operations at Olkiluoto, Kivetty and Romuvaara for 1999 WR , GPS operations at GPS operations at Olkiluoto, Kivetty and Romuvaara for 2001 WR , GPS operations at Olkiluoto, Kivetty and Romuvaara for Seismicity No changes WR , Local seismic network at the Olkiluoto site, Annual report for Tectonic bedrock movements/horizontal displacements The pillar GPS10 was destroyed because of the construction of the new nuclear power station OL3. The pillar GPS10 was replaced with a new one (GPS13), locating about 300 m to the west from the original pillar. Two new pillars were established in August 2003 at Kuivalahti and at Iso Pyrekari WR , GPS operations at Olkiluoto, Kivetty and Romuvaara for Rate of regional land uplift and relative uplift within Olkiluoto The precise levelling campaigns were started at Olkiluoto in order to gain a better vertical control of the GPS network. First the Olkiluoto GPS network was connected to the precise levelling network of Finland at Lapijoki to control the vertical movements of the whole island. The GPS network levelling consists of the reserve marks established on the bedrock of eight GPS pillars and five levelling bench marks two of which constituted the nodal bench mark pair. WR , Precise levelling of the Olkiluoto GPS network in Seismicity Two new seismic stations established. Construction of ONKALO started and the network adjusted to also monitor the excavations. WR , Local seismic network at the Olkiluoto site, Annual report for Tectonic bedrock movements/horizontal displacements Construction works around pillar GPS6 may have influence on the results. Also a new landfill established near GPS7. WR , GPS operations at Olkiluoto, Kivetty and Romuvaara in 2004
98 Seismicity No changes WR , Local seismic network at the Olkiluoto site, Annual report for 2005 Tectonic bedrock movements/horizontal displacements Two new pillars were established in October 2005 located at Hankkila and Taipalmaa. WR , GPS operations at Olkiluoto, Kivetty and Romuvaara in 2005 Rate of regional land uplift and relative uplift within Olkiluoto The second levelling campaign at the area was carried out in autumn 2005 when GPS13 was included for the first time. WR , Precise levelling of the Olkiluoto GPS network in Seismicity Six new stations established, four to monitor semi-regional scale and two borehole sensor to improve sensitivity in the ONKALO area. WR , Local seismic network at the Olkiluoto site, Annual report for 2006 Tectonic bedrock movements/horizontal displacements No changes WR , GPS operations at Olkiluoto, Kivetty and Romuvaara in 2006 Rate of regional land uplift and relative uplift within Olkiluoto Inspired by the observed changes of the elevation differences in 2005, two small networks were established and levelled onto the ONKALO site and on the repository for low and medium level waste (VLJ repository) in autumn WR , Precise levelling campaigns at Olkiluoto in Seismicity One of the new borehole sensors (OL-OS14) failed and was removed from the network. WR , Local seismic network at the Olkiluoto site, Annual report for 2007 Tectonic bedrock movements/horizontal displacements No changes WR , GPS operations at Olkiluoto, Kivetty and Romuvaara in 2007 Rate of regional land uplift and relative uplift within Olkiluoto The campaign in autumn 2007 consisted of the levelling of all the loops and the lines measured earlier. WR , Precise levelling campaigns at Olkiluoto in Convergence and extensometer measurements In 2007, at level -180 of the ONKALO underground research facility, convergence and extensometer measurements were done to observe displacements induced by in situ stress and the raise boring of both exhaust air and personnel shafts. WR , Results of Monitoring at Olkiluoto in Rock Mechanics 2008 Seismicity New station (ONK-OS1) established at ONKALO. WR , Results of monitoring at Olkiluoto in 2008, Rock mechanics Tectonic bedrock movements/horizontal displacements Rate of regional land uplift and relative uplift within Olkiluoto Convergence and extensometer measurements No changes To localize more accurately the moving bedrock blocks, two new bench marks in the vicinity of the bench mark above ONKALO and one bench mark on both sides of the Olkiluoto strait were established in autumn In 2008 rock response measurements were done in shaft access tunnels at depth levels -180 metre and -290 metre. WR , GPS operations at Olkiluoto, Kivetty and Romuvaara in 2008 WR , Precise levelling campaigns at Olkiluoto in 2008 and 2009 WR , Results of Monitoring at Olkiluoto in Rock Mechanics 2009 Seismicity No changes WR , Local seismic network at the Olkiluoto site, Annual report for 2009
99 91 Tectonic bedrock movements/horizontal displacements No changes. WR , GPS operations at Olkiluoto in 2009 Rate of regional land uplift and relative uplift within Olkiluoto The observations carried out in 2008 were repeated and additionally the GPS network levelled. WR , Precise levelling campaigns at Olkiluoto in 2008 and 2009 Convergence and extensometer measurements Shaft convergences have been measured in ONKALO in six locations on levels -180 and -290 between 2007 and WR , Results of Monitoring at Olkiluoto in Rock Mechanics 2010 Seismicity New station (ONK-OS2) established at ONKALO. WR , Local seismic network at the Olkiluoto site, Annual report for 2010 Tectonic bedrock movements/horizontal displacements Four new concrete pillars were built in The new stations will observe the movements in the strait between the Olkiluoto Island and the mainland. Two stations will be constructed at the eastern side of Olkiluoto and two on the mainland (Orjansaari and Melaluoto). WR , GPS operations at Olkiluoto, Kivetty and Romuvaara in 2010 Rate of regional land uplift and relative uplift within Olkiluoto Convergence and extensometer measurements No changes. Two extensometers were installed from access tunnel towards POSE niche and a convergence line was established in the POSE niche before the expansion excavations of the third investigation niche at depth -345 m. WR , Precise Levelling Campaigns at Olkiluoto in 2010 and 2011 WR , Results of Monitoring at Olkiluoto in Rock Mechanics 2011 Seismicity Temporary subnetwork of four local stations (ONK-PP272, ONK-PP258, ONK-PP257, ONK-PP256) established in the investigation niche ONK- TKU WR , Local seismic network at the Olkiluoto site, Annual report for 2011 Tectonic bedrock movements/horizontal displacements New permanent station GPS16 started continuous tracking in November. WR , GPS operations at Olkiluoto in 2011 Rate of regional land uplift and relative uplift within Olkiluoto The new GPS pillars GPS16, GPS17, GPS18 and GPS19 were connected to a levelling network in WR , Precise Levelling Campaigns at Olkiluoto in 2010 and 2011 Convergence and extensometer measurements Two extensometers were installed to the technical rooms. WR Results of Monitoring at Olkiluoto in 2011, RM 2012 Seismicity Two new triaxial borehole seismometers (ONK-OS3 and ONK-OS4) were installed inside the ONKALO. WR , Local seismic network at the Olkiluoto site, Annual report for 2012 Tectonic bedrock movements/horizontal displacements New local permanent stations GPS2 and GPS17 GPS19 were installed during the campaign in April. Currently also the observation strategy will be changed from the multi-campaign approach to permanent tracking. WR , GPS deformation measurements at Olkiluoto in 2012 Rate of regional land uplift and relative uplift within Olkiluoto No changes. Only measuring loops VLJ, ONKALO and Olkiluoto Strait were measured. WR , Precise Levelling Campaigns at Olkiluoto in 2010 and 2011 Convergence and extensometer measurements No changes. WR Results of Monitoring at Olkiluoto in 2012, RM Temperature measurements All temperature measurements were first time collected and analyzed. WR Analysis of temperature data at the Olkiluoto site
100 92 Visual tunnel observations Visual ONKALO tunnel observations were first time collected and analyzed. WR Results of Monitoring at Olkiluoto in 2012, RM 2013 Seismicity Upgrade and unification of the whole seismic network. Now one triaxial sensor less due to upgrade (geophone of OL-OS7 disconnected from the network). WR , Local seismic network at the Olkiluoto site, Annual report for 2013 Tectonic bedrock movements/horizontal displacements Six GPS stations were set up for permanent tracking, now 12 for continuous reading. WR , GPS deformation measurements at Olkiluoto in 2013 Rate of regional land uplift and relative uplift within Olkiluoto No changes. WR , Precise Levelling Campaigns at Olkiluoto in Convergence and extensometer measurements One extensometer (in ONKALO ramp close to POSE niche) was reconnected for manual reading. WR Results of Monitoring at Olkiluoto in 2013, RM Temperature measurements Additional measuring points from geophysical loggings, PFL measurements and tunnel chainage measurements. WR Results of Monitoring at Olkiluoto in 2013, RM Visual tunnel observations No changes. Observations are continuously collected. WR Results of Monitoring at Olkiluoto in 2013, RM 2014 Seismicity No changes in the network. The database server software was updated. WR , Local seismic network at the Olkiluoto site, Annual report for 2014 Tectonic bedrock movements/horizontal displacements Four GPS stations were set up for permanent tracking, now 17 for continuous reading. The stations GPS5 and GPS7 were replaced by stations GPS20 and GPS21. WR , Geodetic deformation measurements at Olkiluoto in Rate of regional land uplift and relative uplift within Olkiluoto No changes. WR , Geodetic deformation measurements at Olkiluoto in Convergence and extensometer measurements Two additional extensometers were installed in the demonstration tunnel 3 at -422 m level (POPLU experiment). WR Results of Monitoring at Olkiluoto in 2014, RM Temperature measurements Monitoring at -140 m niche ceased. New data from POPLU extensometers. WR Results of Monitoring at Olkiluoto in 2014, RM Visual tunnel observations No changes. Observations are continuously collected. Systematic visual monitoring of full-scale deposition holes in the demonstration tunnel 3 starts in WR Results of Monitoring at Olkiluoto in 2014, RM 2015 Seismicity No changes in the network. WR , Results of Monitoring at Olkiluoto in 2015, RM Tectonic bedrock movements/horizontal displacements No changes in the network WR , Results of Monitoring at Olkiluoto in 2015, RM. Rate of regional land uplift and relative uplift within Olkiluoto No changes. WR , Results of Monitoring at Olkiluoto in 2015, RM. Convergence and extensometer measurements Surface extensometers were installed at two fracture zone locations at PL 2480 m and 3170 m. WR , Results of Monitoring at Olkiluoto in 2015, RM
101 93 Temperature measurements New data from surface extensometers. WR , Results of Monitoring at Olkiluoto in 2015, RM Visual tunnel observations No changes. Observations are continuously collected. WR , Results of Monitoring at Olkiluoto in 2015, RM 2016 Seismicity New station installed and connected to the network, ONK-OS5 inside the ONKALO and one decommissioned OL-OS1 from ground surface. WR , Results of Monitoring at Olkiluoto in 2016, RM Tectonic bedrock movements/horizontal displacements No changes in the network WR , Results of Monitoring at Olkiluoto in 2016, RM. Rate of regional land uplift and relative uplift within Olkiluoto No changes. WR , Results of Monitoring at Olkiluoto in 2016, RM. Convergence and extensometer measurements New extensometers installed in parking hall 1 and 2 (reversed-head) and in vehicle connection 13. Reversed-head extensometers in parking hall 2 were excavated during WR , Results of Monitoring at Olkiluoto in 2016, RM Temperature measurements New data from new extensometers. WR , Results of Monitoring at Olkiluoto in 2016, RM Visual tunnel observations No changes. Observations are continuously collected. WR , Results of Monitoring at Olkiluoto in 2016, RM 2017 Seismicity New station installed, OL-OS15 in September This station uses the same equipment as the decommissioned OL-OS1. WR , Results of Monitoring at Olkiluoto in 2017, RM Tectonic bedrock movements/horizontal displacements GPS8 decommissioned in February 2017 due to the switchyard construction work. Deforestation around GPS1 in order to increase visibility of satellites. WR , Results of Monitoring at Olkiluoto in 2017, RM. Rate of regional land uplift and relative uplift within Olkiluoto No changes. WR , Results of Monitoring at Olkiluoto in 2017, RM Convergence and extensometer measurements No changes. WR , Results of Monitoring at Olkiluoto in 2017, RM Temperature measurements No changes. WR , Results of Monitoring at Olkiluoto in 2017, RM Visual tunnel observations No changes. Observations are continuously collected. WR , Results of Monitoring at Olkiluoto in 2017, RM 2018 Seismicity No changes in the network. WR , Results of Monitoring at Olkiluoto in 2018, RM Tectonic bedrock movements/horizontal displacements No changes in the network WR , Results of Monitoring at Olkiluoto in 2018, RM Rate of regional land uplift and relative uplift within Olkiluoto No changes. WR , Results of Monitoring at Olkiluoto in 2018, RM Convergence and extensometer measurements No changes. WR , Results of Monitoring at Olkiluoto in 2018, RM
102 94 Temperature measurements No changes. WR , Results of Monitoring at Olkiluoto in 2018, RM Visual tunnel observations No changes. Observations are continuously collected. WR , Results of Monitoring at Olkiluoto in 2018, RM
103 95 APPENDIX 2: SEISMIC OBSERVATIONS AT OLKILUOTO Total number of located blasts Semi-regional blasts, after Feb 2006 Regional earthquakes, after Feb 2006 Excavation induced and other microearthquakes, after Aug ** * 1785* * ** * 1158 * 1 - ** * *** * *** *** * Event total checked and corrected ** Following events were removed from the microearthquake list: :47: :23: :24: :42: :42: :59: :59:59.94 *** Following events were added to the microearthquake list: :30: :31: :37: :37: :37: :45: :47: :47: :51: :52: :00:04.31
104 96
105 97 No. APPENDIX 3: ONKALO BLOCK MICROEARTHQUAKES IN 2018 Posiva's seismic network in Olkiluoto 01 January :00:00-31 December :59:59 * Location of explosion or other construction activity: V = vehicle connection, CRS = capsule receiving station, OCW = other construction work, INJ = injection, SH = storage hall, JOTT = joint operating test tunnel Date Origin Time (UTC) Loc X (m) Loc Y (m) Loc Z (m) ML No. of stations /01/03 23:50: /01/07 20:34: /01/07 20:35: /01/07 20:35: /01/07 20:35: /01/07 20:36: /01/07 20:36: /01/07 20:37: Time of last exp./constr. activity (*) 2018/01/03 17:05 (V15) 2018/01/07 11:33 (V15) 2018/01/07 11:33 (V15) 2018/01/07 11:33 (V15) 2018/01/07 11:33 (V15) 2018/01/07 11:33 (V15) 2018/01/07 11:33 (V15) 2018/01/07 11:33 (V15) /01/09 08:25: /01/11 23:51: /01/11 16:17 (V17) /01/13 00:46: /01/13 15:19 (V17.1) /01/13 02:06: /01/13 15:19 (V17.1) /01/13 02:06: /01/13 15:19 (V17.1) /01/15 23:11: /01/15 17:51 (V17) /01/26 00:39: /01/25 18:01 (V17) /01/26 02:02: /01/25 18:01 (V17) /01/26 02:03: /01/25 18:01 (V17) /01/26 02:03: /01/25 18:01 (V17) /01/26 21:37: /01/26 17:08 (V15) /01/30 01:56: /01/29 19:28 (V17.2)
106 98 No. Date Origin Time (UTC) Loc X (m) Loc Y (m) Loc Z (m) ML No. of stations /02/06 20:38: /02/08 19:51: /02/09 20:30: /02/11 21:03: /02/11 21:03: Time of last exp./constr. activity (*) 2018/02/06 18:54 (V17) 2018/02/08 15:52 (V15) 2018/02/09 15:04 (V15) 2018/02/11 11:08 (V15) 2018/02/11 11:08 (V15) /02/14 19:54: /02/17 01:28: /02/16 16:21 (V17) /02/17 01:29: /02/16 16:21 (V17) /02/17 01:29: /02/16 16:21 (V17) /02/17 01:30: /02/16 16:21 (V17) /02/17 01:30: /02/16 16:21 (V17) /02/17 01:30: /02/16 16:21 (V17) /02/17 01:32: /02/16 16:21 (V17) /02/17 01:33: /02/16 16:21 (V17) /02/17 01:33: /02/16 16:21 (V17) /02/17 01:33: /02/16 16:21 (V17) /02/18 19:47: /02/18 11:41 (JOTT) /02/18 23:03: /02/18 11:41 (JOTT) /02/20 20:08: /02/20 16:16 (V15), ~0 min (OCW) /02/20 20:30: /02/20 16:16 (V15), ~0 min (OCW) /02/20 20:30: /02/20 16:16 (V15), ~0 min (OCW) /02/20 20:30: /02/20 16:16 (V15), ~0 min (OCW) 1 Time of last exp./constr. activity changed compared to the monthly report
107 99 No. Date Origin Time (UTC) Loc X (m) Loc Y (m) Loc Z (m) ML No. of stations /02/22 19:28: /02/22 19:28: /02/22 21:20: /02/25 01:20: /02/25 01:20: /02/25 01:47: /02/25 19:21: /03/01 06:19: /03/01 06:19: /03/02 03:18: /03/06 19:51: /03/06 19:54: /03/07 00:52: /03/07 00:53: /03/07 00:53: Time of last exp./constr. activity (*) 2018/02/22 16:16 (V15) 2018/02/22 16:16 (V15) 2018/02/22 16:21 (V17) 2018/02/24 18:31 (V15) /02/24 18:31 (V15) /02/24 18:31 (V15) /02/25 11:29 (V15) /02/28 17:50 (V15) 2018/02/28 17:50 (V15) 2018/03/01 17:46 (V17) 2018/03/06 16:38 (V17) 2018/03/06 16:38 (V17) 2018/03/06 16:38 (V17) 2018/03/06 16:38 (V17) 2018/03/06 16:38 (V17) /03/08 07:43: /03/08 07:43: /03/08 07:47: /03/11 19:04: /03/11 11:30 (V15 & V15.1) /03/12 00:23: /03/11 11:33 (V17) /03/12 00:24: /03/11 11:33 (V17) /03/12 00:24: /03/11 11:33 (V17) /03/12 00:24: /03/11 11:33 (V17) /03/12 00:24: /03/11 11:33 (V17) 2 Time of last exp./constr. activity changed compared to the monthly report
108 100 No. Date Origin Time (UTC) Loc X (m) Loc Y (m) Loc Z (m) ML No. of stations /03/12 00:24: /03/12 03:14: /03/12 03:14: /03/12 03:15: /03/13 09:15: /03/13 09:15: /03/15 05:57: /03/15 23:36: /03/16 03:43: Time of last exp./constr. activity (*) 2018/03/11 11:33 (V17) 2018/03/11 11:30 (V15 & V15.1) 2018/03/11 11:30 (V15 & V15.1) 2018/03/11 11:30 (V15 & V15.1) possibly INJ related possibly INJ related 2018/03/14 16:28 (V17) 2018/03/15 16:55 (V15.1) 2018/03/15 16:55 (V15.1) /03/20 07:51: /03/20 07:51: /03/20 19:43: /03/20 15:59 (V15.1) /03/23 19:29: /03/22 16:53 (V17) /03/24 01:35: /03/24 01:36: /03/24 01:37: /03/24 01:37: /03/24 01:37: /03/24 01:39: /03/26 19:53: /03/25 10:46 (V17) /04/03 23:37: /04/03 15:59:26 (CRS) /04/03 23:37: /04/03 15:59:26 (CRS) /04/03 23:38: /04/03 15:59:26 (CRS) /04/03 23:38: /04/03 15:59:26 (CRS) /04/03 23:38: /04/03 15:59:26 (CRS)
109 101 No. Date Origin Time (UTC) Loc X (m) Loc Y (m) Loc Z (m) ML No. of stations /04/03 23:39: /04/03 23:39: /04/03 23:39: /04/03 23:40: /04/05 23:00: /04/05 23:00: /04/07 20:16: /04/07 20:19: /04/07 20:22: /04/10 18:15: /04/10 18:15: /04/12 07:29: Time of last exp./constr. activity (*) 2018/04/03 15:59:26 (CRS) 2018/04/03 15:59:26 (CRS) 2018/04/03 15:59:26 (CRS) 2018/04/03 15:59:26 (CRS) 2018/04/05 15:29:05 (V15) 2018/04/05 15:29:05 (V15) 2018/04/07 13:50:08 (V15) 2018/04/07 13:50:08 (V15) 2018/04/07 13:50:08 (V15) 2018/04/10 15:39:39 (V15) 2018/04/10 15:39:39 (V15) 2018/04/12 03:35:33 (V17) /04/14 00:14: /04/18 06:50: /04/18 06:50: /04/18 23:35: /04/ :17:06 (V17) /04/18 23:35: /04/ :17:06 (V17) /04/18 23:35: /04/ :17:06 (V17) /04/20 23:54: h after OCW (CRS) /04/20 23:55: h after OCW (CRS) /04/22 13:02: /04/22 19:37: ongoing OCW (CRS) /04/22 19:49: ongoing OCW (CRS) /04/23 00:12: h after OCW (CRS) /04/23 00:12: h after OCW (CRS) /04/23 00:12: h after OCW (CRS)
110 102 No. Date Origin Time (UTC) Loc X (m) Loc Y (m) Loc Z (m) ML No. of stations /04/23 00:13: /04/23 01:47: /04/23 02:11: /04/23 02:11: Time of last exp./constr. activity (*) 2 h after OCW (CRS) 4 h after OCW (CRS) 4 h after OCW (CRS) 4 h after OCW (CRS) /04/26 00:03: /04/27 22:20: /04/27 15:49:53 (V15) /04/28 02:14: /04/27 15:49:53 (V15) /04/28 02:24: /04/27 15:49:53 (V15) /04/28 06:15: /04/28 19:52: /04/28 19:52: /04/30 20:25: /04/30 20:25: /05/07 00:04: /05/06 10:24:20 (V15) /05/07 00:04: /05/06 10:24:20 (V15) /05/08 19:39: /05/08 16:33:32 (V15) /05/09 00:24: /05/08 16:33:32 (V15) /05/09 03:11: /05/08 16:33:32 (V15) /05/09 03:12: /05/08 16:33:32 V /05/09 03:12: /05/08 16:33:32 (V15) /05/15 22:59: /05/22 10:00: h after OCW (V15) /05/25 01:58: /05/24 16:54:26 (V15) /05/29 19:47: /05/29 16:52:09 (V17.3) /05/29 19:48: /05/29 16:52:09 (V17.3) /06/07 00:01: /06/06 15:28:59 (V15) /06/07 00:01: /06/06 15:28:59 (V15)
111 103 No. Date Origin Time (UTC) Loc X (m) Loc Y (m) Loc Z (m) ML No. of stations /06/10 23:42: /06/10 23:43: /06/10 23:43: /06/11 00:01: /06/13 20:13: /06/18 01:14: /08/14 02:35: Time of last exp./constr. activity (*) ~16 h after OCW (V15 & V17.3) ~16 h after OCW (V15 & V17.3) ~16 h after OCW (V15 & V17.3) ~16 h after OCW (V15 & V17.3) 2018/06/13 15:04:46 (V15 & V17.3) 2018/06/17 10:13:19 (V15 & V17) 2018/08/13 15:27:22 (SH) /09/03 05:42: ~0 min INJ /09/03 05:44: ~0 min INJ /09/03 05:48: ~0 min INJ /09/03 06:34: ~0 min INJ /09/03 06:53: ~0 min INJ /09/03 06:56: ~0 min INJ /09/03 15:22: ~0 min INJ /09/26 01:14: /09/26 01:14: /09/26 01:14: /09/28 03:38: /10/11 07:02: /11/29 10:17: /11/28 16:06 (JOTT) /11/29 10:17: /11/28 16:06 (JOTT) /11/29 10:18: /11/28 16:06 (JOTT)
112 104
113 105 APPENDIX 4: ONKALO SMALL EVENTS IN 2018 Posiva's seismic network in Olkiluoto 01 January :00:00-31 December :59:59 Light blue: probable rock falls Red: unidentified small events Dark blue: miscellaneous small events *: Trace unable to compute local magnitude for the event No. Date Origin Time (UTC) Loc X (m) Loc Y (m) Loc Z (m) Local magnitude /01/02 21:00: /01/02 21:20: /03/01 01:02: /01/06 19:42: /01/06 19:49: /01/07 09:27: /01/08 02:01: /01/09 00:36: /01/09 01:28: /01/09 06:14: /01/09 20:37: /01/10 00:13: /01/10 23:59: /01/11 23:48: /01/11 23:49: /01/11 23:50: /01/12 00:05: /01/12 00:13: /01/12 00:53: /01/14 23:16: /01/17 23:43: * /01/19 23:52: /01/22 20:01: /01/24 03:13: /01/24 03:27: /01/26 02:17: /01/26 20:47: /01/28 21:20: /02/02 00:53: /02/02 07:45: /02/05 00:45: /02/05 00:45: /02/07 19:47:
114 106 No. Date Origin Time (UTC) Loc X (m) Loc Y (m) Loc Z (m) Local magnitude /02/08 19:49: /02/08 19:50: /02/09 20:29: /02/11 21:22: /02/12 07:43: /02/12 19:05: /02/12 19:46: /02/13 19:22: /02/14 01:23: /02/14 03:59: /02/14 07:09: /02/14 07:09: /02/16 19:44: /02/17 01:28: /02/17 01:28: /02/17 01:32: /02/17 20:26: /02/17 21:02: /02/19 23:38: /02/21 20:19: /02/21 20:32: /02/22 05:23: /02/22 19:27: /02/22 21:20: /02/22 21:21: /02/22 23:45: /02/24 23:15: /02/25 19:08: /02/25 19:20: /02/25 20:21: /02/26 01:12: /03/02 02:01: /03/04 00:54: /03/04 00:58: /03/04 00:58: /03/06 01:06: /03/07 04:03: /03/07 04:08: /03/08 04:15: /03/08 04:18:
115 107 No. Date Origin Time (UTC) Loc X (m) Loc Y (m) Loc Z (m) Local magnitude /03/11 21:04: /03/14 01:27: /03/14 01:33: /03/14 04:06: /03/14 10:52: /03/15 04:27: /03/15 18:58: /03/15 19:04: /03/17 00:38: /03/17 23:34: /03/18 20:33: /03/20 20:50: /03/21 22:12: /03/21 22:56: /03/21 22:56: /03/22 02:57: /03/22 03:22: /03/22 19:39: /03/25 00:15: /03/25 03:37: /03/26 19:53: /03/28 09:16: /03/29 03:59: /03/29 18:44: /03/31 10:42: /03/31 22:53: /04/01 01:55: /04/01 11:02: /04/04 22:53: /04/05 23:32: /04/11 22:39: /04/12 23:00: /04/16 18:39: /04/17 11:20: /04/18 22:53: /04/21 23:24: /04/23 15:03: /04/23 19:54: /04/23 20:05: /04/23 20:06:
116 108 No. Date Origin Time (UTC) Loc X (m) Loc Y (m) Loc Z (m) Local magnitude /04/24 11:28: /04/24 12:13: /04/25 09:58: /04/30 02:04: /05/01 06:48: /05/01 06:50: /05/01 06:51: /05/01 06:52: /05/01 11:11: /05/02 11:52: /05/02 22:35: /05/02 22:36: /05/04 04:12: /05/07 23:16: /05/08 01:22: /05/10 01:54: /05/13 21:08: /05/14 00:40: /05/20 22:38: /05/21 06:08: /05/21 06:08: /05/21 20:00: /05/21 23:34: /05/22 01:58: /05/22 02:29: /05/22 14:59: /05/22 15:01: /05/22 15:01: /05/22 15:01: /05/23 19:31: /05/24 02:25: /05/24 02:26: /05/29 23:02: /05/29 23:05: /05/29 23:44: /05/30 00:34: /05/30 00:35: /05/30 16:13: /05/31 00:06: /05/31 00:30:
117 109 No. Date Origin Time (UTC) Loc X (m) Loc Y (m) Loc Z (m) Local magnitude /05/31 00:39: /06/01 05:05: /06/03 04:16: /06/06 00:07: /06/06 00:50: /06/07 03:32: /06/07 03:42: /06/07 03:44: /06/10 22:13: /06/10 22:19: /06/10 23:04: /06/10 23:42: /06/11 02:39: /06/11 19:54: /06/11 20:37: /06/11 22:11: /06/14 04:35: /06/14 22:56: /06/14 22:59: /06/14 23:17: /06/18 22:12: /06/19 23:59: /07/03 04:52: /07/05 06:39: /07/05 06:41: /07/09 03:35: /07/10 04:32: /07/10 06:52: /07/19 10:55: /07/24 10:48: /07/24 11:11: /07/27 04:57: /07/27 05:06: /08/05 12:07: /08/05 21:11: /08/05 23:13: /08/06 23:18: * /08/07 02:42: /08/09 07:04: /08/10 07:00:
118 110 No. Date Origin Time (UTC) Loc X (m) Loc Y (m) Loc Z (m) Local magnitude /08/16 03:02: /08/19 05:28: /08/19 23:17: /08/20 10:25: /08/20 22:39: * /08/20 22:50: * /08/21 06:53: /09/07 09:18: * /09/08 10:14: /09/08 10:18: /09/09 08:14: /09/09 08:14: /09/10 18:28: /09/10 18:30: /09/10 18:30: /09/10 19:12: /09/11 23:28: /09/12 10:13: /09/12 10:14: /09/18 00:30: /09/20 04:59: /09/22 06:37: /09/24 01:49: * /09/24 02:34: * /09/24 14:22: /09/25 04:15: /09/26 10:21: * /10/03 07:10: /10/03 14:20: /10/10 10:57: /10/11 11:47: /10/12 11:05: /10/15 10:52: /10/18 09:13: /10/20 10:55: /10/20 10:56: /10/20 12:41: /10/22 08:22: /10/23 05:44: /10/31 11:41:
119 111 No. Date Origin Time (UTC) Loc X (m) Loc Y (m) Loc Z (m) Local magnitude /11/17 10:45: /11/26 05:12: /11/26 06:13: /11/26 06:35: /12/04 09:14: /12/21 01:58:
120 112

121 113 APPENDIX 5: POSITION RESIDUAL TIME SERIES OF GPS MONITORING STATIONS The daily position residuals after removing the constant trend due to the reference frame motion. The station GPS2 has been used as a fixed reference station and thus not shown here. The data has been shifted by 10, 5 and -5 mm for north (blue), east (red) and up (yellow) component, respectively, for visual reasons.
122 114
123 115
124 116
125 117
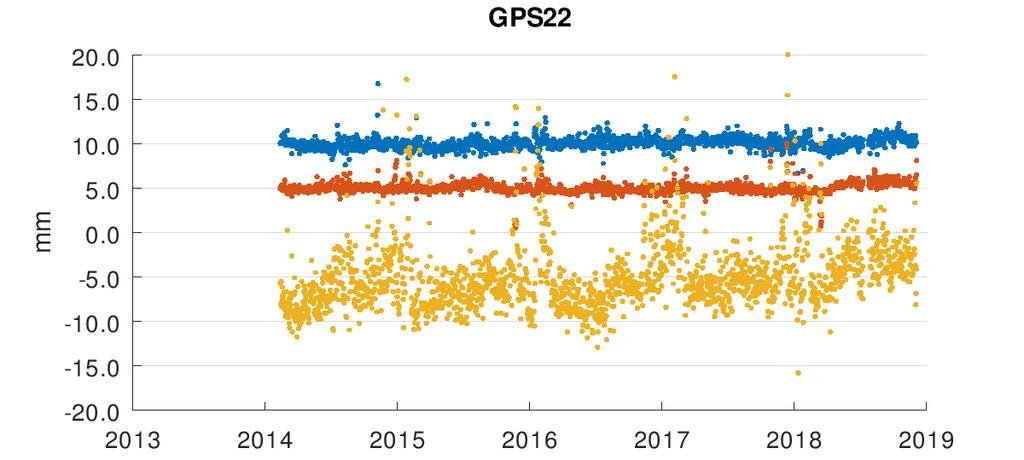
126 118
WindPRO version joulu 2012 Printed/Page :47 / 1. SHADOW - Main Result
 SHADOW - Main Result Assumptions for shadow calculations Maximum distance for influence Calculate only when more than 20 % of sun is covered by the blade Please look in WTG table WindPRO version 2.8.579
WindPRO version joulu 2012 Printed/Page :42 / 1. SHADOW - Main Result
 SHADOW - Main Result Assumptions for shadow calculations Maximum distance for influence Calculate only when more than 20 % of sun is covered by the blade Please look in WTG table 13.6.2013 19:42 / 1 Minimum
LYTH-CONS CONSISTENCY TRANSMITTER
 LYTH-CONS CONSISTENCY TRANSMITTER LYTH-INSTRUMENT OY has generate new consistency transmitter with blade-system to meet high technical requirements in Pulp&Paper industries. Insurmountable advantages are
Capacity Utilization
 Capacity Utilization Tim Schöneberg 28th November Agenda Introduction Fixed and variable input ressources Technical capacity utilization Price based capacity utilization measure Long run and short run
,0 Yes ,0 120, ,8
 SHADOW - Main Result Calculation: Alue 2 ( x 9 x HH120) TuuliSaimaa kaavaluonnos Assumptions for shadow calculations Maximum distance for influence Calculate only when more than 20 % of sun is covered
( ,5 1 1,5 2 km
 Tuulivoimala Rakennukset Asuinrakennus Liikerak. tai Julkinen rak. Lomarakennus Teollinen rakennus Kirkollinen rakennus Varjostus "real case" h/a 1 h/a 8 h/a 20 h/a 4 5 3 1 2 6 7 8 9 10 0 0,5 1 1,5 2 km
TM ETRS-TM35FIN-ETRS89 WTG
 SHADOW - Main Result Assumptions for shadow calculations Maximum distance for influence Calculate only when more than 20 % of sun is covered by the blade Please look in WTG table 5.11.2013 16:44 / 1 Minimum
1. SIT. The handler and dog stop with the dog sitting at heel. When the dog is sitting, the handler cues the dog to heel forward.
 START START SIT 1. SIT. The handler and dog stop with the dog sitting at heel. When the dog is sitting, the handler cues the dog to heel forward. This is a static exercise. SIT STAND 2. SIT STAND. The
TM ETRS-TM35FIN-ETRS89 WTG
 SHADOW - Main Result Calculation: N117 x 9 x HH141 Assumptions for shadow calculations Maximum distance for influence Calculate only when more than 20 % of sun is covered by the blade Please look in WTG
Precise Levelling Campaigns at Olkiluoto in 2010 and 2011
 Working Report 2012-64 Precise Levelling Campaigns at Olkiluoto in 2010 and 2011 Veikko Saaranen Paavo Rouhiainen Heli Suurmäki Finnish Geodetic Institute May 2013 Working Reports contain information on
National Building Code of Finland, Part D1, Building Water Supply and Sewerage Systems, Regulations and guidelines 2007
 National Building Code of Finland, Part D1, Building Water Supply and Sewerage Systems, Regulations and guidelines 2007 Chapter 2.4 Jukka Räisä 1 WATER PIPES PLACEMENT 2.4.1 Regulation Water pipe and its
TM ETRS-TM35FIN-ETRS89 WTG
 SHADOW - Main Result Assumptions for shadow calculations Maximum distance for influence Calculate only when more than 20 % of sun is covered by the blade Please look in WTG table 22.12.2014 11:33 / 1 Minimum
Rakennukset Varjostus "real case" h/a 0,5 1,5
 Tuulivoimala Rakennukset Asuinrakennus Liikerak. tai Julkinen rak. Lomarakennus Teollinen rakennus Kirkollinen rakennus Varjostus "real case" h/a 1 h/a 8 h/a 20 h/a 1 2 3 5 8 4 6 7 9 10 0 0,5 1 1,5 2 km
Efficiency change over time
 Efficiency change over time Heikki Tikanmäki Optimointiopin seminaari 14.11.2007 Contents Introduction (11.1) Window analysis (11.2) Example, application, analysis Malmquist index (11.3) Dealing with panel
Metsälamminkankaan tuulivoimapuiston osayleiskaava
 VAALAN KUNTA TUULISAIMAA OY Metsälamminkankaan tuulivoimapuiston osayleiskaava Liite 3. Varjostusmallinnus FCG SUUNNITTELU JA TEKNIIKKA OY 12.5.2015 P25370 SHADOW - Main Result Assumptions for shadow calculations
TM ETRS-TM35FIN-ETRS89 WTG
 SHADOW - Main Result Assumptions for shadow calculations Maximum distance for influence Calculate only when more than 20 % of sun is covered by the blade Please look in WTG table WindPRO version 2.8.579
Tynnyrivaara, OX2 Tuulivoimahanke. ( Layout 9 x N131 x HH145. Rakennukset Asuinrakennus Lomarakennus 9 x N131 x HH145 Varjostus 1 h/a 8 h/a 20 h/a
 , Tuulivoimahanke Layout 9 x N131 x HH145 Rakennukset Asuinrakennus Lomarakennus 9 x N131 x HH145 Varjostus 1 h/a 8 h/a 20 h/a 0 0,5 1 1,5 km 2 SHADOW - Main Result Assumptions for shadow calculations
7.4 Variability management
 7.4 Variability management time... space software product-line should support variability in space (different products) support variability in time (maintenance, evolution) 1 Product variation Product
Data quality points. ICAR, Berlin,
 Data quality points an immediate and motivating supervision tool ICAR, Berlin, 22.5.2014 Association of ProAgria Centres Development project of Milk Recording Project manager, Heli Wahlroos heli.wahlroos@proagria.fi
Information on preparing Presentation
 Information on preparing Presentation Seminar on big data management Lecturer: Spring 2017 20.1.2017 1 Agenda Hints and tips on giving a good presentation Watch two videos and discussion 22.1.2017 2 Goals
( ( OX2 Perkkiö. Rakennuskanta. Varjostus. 9 x N131 x HH145
 OX2 9 x N131 x HH145 Rakennuskanta Asuinrakennus Lomarakennus Liike- tai julkinen rakennus Teollinen rakennus Kirkko tai kirkollinen rak. Muu rakennus Allas Varjostus 1 h/a 8 h/a 20 h/a 0 0,5 1 1,5 2 km
TM ETRS-TM35FIN-ETRS89 WTG
 SHADOW - Main Result Assumptions for shadow calculations Maximum distance for influence Calculate only when more than 20 % of sun is covered by the blade Please look in WTG table WindPRO version 2.9.269
Results on the new polydrug use questions in the Finnish TDI data
 Results on the new polydrug use questions in the Finnish TDI data Multi-drug use, polydrug use and problematic polydrug use Martta Forsell, Finnish Focal Point 28/09/2015 Martta Forsell 1 28/09/2015 Esityksen
TM ETRS-TM35FIN-ETRS89 WTG
 SHADOW - Main Result Assumptions for shadow calculations Maximum distance for influence Calculate only when more than 20 % of sun is covered by the blade Please look in WTG table WindPRO version 2.8.579
TM ETRS-TM35FIN-ETRS89 WTG
 SHADOW - Main Result Assumptions for shadow calculations Maximum distance for influence Calculate only when more than 20 % of sun is covered by the blade Please look in WTG table WindPRO version 2.8.579
TM ETRS-TM35FIN-ETRS89 WTG
 VE1 SHADOW - Main Result Calculation: 8 x Nordex N131 x HH145m Assumptions for shadow calculations Maximum distance for influence Calculate only when more than 20 % of sun is covered by the blade Please
TM ETRS-TM35FIN-ETRS89 WTG
 SHADOW - Main Result Assumptions for shadow calculations Maximum distance for influence Calculate only when more than 20 % of sun is covered by the blade Please look in WTG table WindPRO version 2.8.579
( N117 x HH141 ( Honkajoki N117 x 9 x HH120 tv-alueet ( ( ( ( ( ( ( ( ( ( m. Honkajoki & Kankaanpää tuulivoimahankkeet
 Honkajoki & Kankaanpää tuulivoimahankkeet N117 x HH141 Honkajoki N117 x 9 x HH120 tv-alueet Alahonkajoki_kaava_alueen_raja_polyline Asuinrakennus Julkinen tai liiker rak. Lomarakennus Teollinen rak. Allas
Local Seismic Network at the Olkiluoto Site Annual Report for 2006
 Working Report 2007-55 Local Seismic Network at the Olkiluoto Site Annual Report for 2006 Jouni Saari Antti Lakio May 2007 POSIVA OY FI-27160 OLKILUOTO, FINLAND Tel +358-2-8372 31 Fax +358-2-8372 3709
TM ETRS-TM35FIN-ETRS89 WTG
 SHADOW - Main Result Assumptions for shadow calculations Maximum distance for influence Calculate only when more than 20 % of sun is covered by the blade Please look in WTG table WindPRO version 2.8.579
TM ETRS-TM35FIN-ETRS89 WTG
 SHADOW - Main Result Assumptions for shadow calculations Maximum distance for influence Calculate only when more than 20 % of sun is covered by the blade Please look in WTG table WindPRO version 2.8.579
Network to Get Work. Tehtäviä opiskelijoille Assignments for students. www.laurea.fi
 Network to Get Work Tehtäviä opiskelijoille Assignments for students www.laurea.fi Ohje henkilöstölle Instructions for Staff Seuraavassa on esitetty joukko tehtäviä, joista voit valita opiskelijaryhmällesi
Precise Levelling Campaigns at Olkiluoto in
 Working Report 2008-19 Precise Levelling Campaigns at Olkiluoto in 2006 2007 Pekka Lehmuskoski April 2008 POSIVA OY Olkiluoto FI-27160 EURAJOKI, FINLAND Tel +358-2-8372 31 Fax +358-2-8372 3709 Working
TM ETRS-TM35FIN-ETRS89 WTG
 SHADOW - Main Result Assumptions for shadow calculations Maximum distance for influence Calculate only when more than 20 % of sun is covered by the blade Please look in WTG table WindPRO version 2.8.579
Other approaches to restrict multipliers
 Other approaches to restrict multipliers Heikki Tikanmäki Optimointiopin seminaari 10.10.2007 Contents Short revision (6.2) Another Assurance Region Model (6.3) Cone-Ratio Method (6.4) An Application of
16. Allocation Models
 16. Allocation Models Juha Saloheimo 17.1.27 S steemianalsin Optimointiopin seminaari - Sks 27 Content Introduction Overall Efficienc with common prices and costs Cost Efficienc S steemianalsin Revenue
The CCR Model and Production Correspondence
 The CCR Model and Production Correspondence Tim Schöneberg The 19th of September Agenda Introduction Definitions Production Possiblity Set CCR Model and the Dual Problem Input excesses and output shortfalls
Precise Levelling Campaigns at Olkiluoto in 2008 and Working Report Pekka Lehmuskoski. June 2010
 Working Report 2010-30 Precise Levelling Campaigns at Olkiluoto in 2008 and 2009 Pekka Lehmuskoski June 2010 POSIVA OY Olkiluoto FI-27160 EURAJOKI, FINLAND Tel +358-2-8372 31 Fax +358-2-8372 3709 Working
LUONNOS RT 80260 EN AGREEMENT ON BUILDING WORKS 1 THE PARTIES. May 1998 1 (10)
") RT 80260 EN May 1998 1 (10) AGREEMENT ON BUILDING WORKS This agreement template is based on the General Terms and Conditions of Building Contracts YSE 1998 RT 16-10660, LVI 03-10277, Ratu 417-7, KH X4-00241.
RT 80260 EN May 1998 1 (10) AGREEMENT ON BUILDING WORKS This agreement template is based on the General Terms and Conditions of Building Contracts YSE 1998 RT 16-10660, LVI 03-10277, Ratu 417-7, KH X4-00241.
Gap-filling methods for CH 4 data
 Gap-filling methods for CH 4 data Sigrid Dengel University of Helsinki Outline - Ecosystems known for CH 4 emissions; - Why is gap-filling of CH 4 data not as easy and straight forward as CO 2 ; - Gap-filling
MIKES, Julkaisu J3/2000 MASS COMPARISON M3. Comparison of 1 kg and 10 kg weights between MIKES and three FINAS accredited calibration laboratories
 MITTATEKNIIKAN KESKUS CENTRE FOR METROLOGY AND ACCREDITATION Julkaisu J3/2000 MASS COMPARISON M3 Comparison of 1 kg and 10 kg weights between MIKES and three FINAS accredited calibration laboratories Kari
S Sähkön jakelu ja markkinat S Electricity Distribution and Markets
 S-18.3153 Sähkön jakelu ja markkinat S-18.3154 Electricity Distribution and Markets Voltage Sag 1) Kolmivaiheinen vastukseton oikosulku tapahtuu 20 kv lähdöllä etäisyydellä 1 km, 3 km, 5 km, 8 km, 10 km
Choose Finland-Helsinki Valitse Finland-Helsinki
 Write down the Temporary Application ID. If you do not manage to complete the form you can continue where you stopped with this ID no. Muista Temporary Application ID. Jos et onnistu täyttää lomake loppuun
Lämmitysjärjestelmät
 METSTA Rakennusten energiatehokkuusstandardit uudistuvat seminaari 26.4.2017 Lämmitysjärjestelmät Jarek Kurnitski HEAT GAINS BUILDING PROPERTIES CLIMATIC CONDITIONS INDOOR ENVIRONMENT REQUIREMENTS EN 16789-1
Characterization of clay using x-ray and neutron scattering at the University of Helsinki and ILL
 Characterization of clay using x-ray and neutron scattering at the University of Helsinki and ILL Ville Liljeström, Micha Matusewicz, Kari Pirkkalainen, Jussi-Petteri Suuronen and Ritva Serimaa 13.3.2012
KMTK lentoestetyöpaja - Osa 2
 KMTK lentoestetyöpaja - Osa 2 Veijo Pätynen 18.10.2016 Pasila YHTEISTYÖSSÄ: Ilmailun paikkatiedon hallintamalli Ilmailun paikkatiedon hallintamalli (v0.9 4.3.2016) 4.4 Maanmittauslaitoksen rooli ja vastuut...
Wärtsilä Corporation. Interim Report January-September 2003 Ole Johansson President & CEO. 29 October Wärtsilä
 Wärtsilä Corporation Interim Report January-September 2003 Ole Johansson President & CEO 29 October 2003 Highlights of the reporting period Order intake of Power Divisions increased. Clear improvement
Olet vastuussa osaamisestasi
 Olet vastuussa osaamisestasi Ohjelmistoammattilaisuuden uudet haasteet Timo Vehmaro 02-12-2015 1 Nokia 2015 Mitä osaamista tulevaisuudessa tarvitaan? Vahva perusosaaminen on kaiken perusta Implementaatio
HARJOITUS- PAKETTI A
 Logistiikka A35A00310 Tuotantotalouden perusteet HARJOITUS- PAKETTI A (6 pistettä) TUTA 19 Luento 3.Ennustaminen County General 1 piste The number of heart surgeries performed at County General Hospital
Kysymys 5 Compared to the workload, the number of credits awarded was (1 credits equals 27 working hours): (4)
: (4)") Tilasto T1106120-s2012palaute Kyselyn T1106120+T1106120-s2012palaute yhteenveto: vastauksia (4) Kysymys 1 Degree programme: (4) TIK: TIK 1 25% ************** INF: INF 0 0% EST: EST 0 0% TLT: TLT 0 0% BIO:
Tilasto T1106120-s2012palaute Kyselyn T1106120+T1106120-s2012palaute yhteenveto: vastauksia (4) Kysymys 1 Degree programme: (4) TIK: TIK 1 25% ************** INF: INF 0 0% EST: EST 0 0% TLT: TLT 0 0% BIO:
HITSAUKSEN TUOTTAVUUSRATKAISUT
 Kemppi ARC YOU GET WHAT YOU MEASURE OR BE CAREFUL WHAT YOU WISH FOR HITSAUKSEN TUOTTAVUUSRATKAISUT Puolitetaan hitsauskustannukset seminaari 9.4.2008 Mikko Veikkolainen, Ratkaisuliiketoimintapäällikkö
TIEKE Verkottaja Service Tools for electronic data interchange utilizers. Heikki Laaksamo
 TIEKE Verkottaja Service Tools for electronic data interchange utilizers Heikki Laaksamo TIEKE Finnish Information Society Development Centre (TIEKE Tietoyhteiskunnan kehittämiskeskus ry) TIEKE is a neutral,
COXAN PULSSI. Tuula Rantala Hoitotyön johtaja Ylpeys omasta työstä ja yhteishenki ovat tekemisen lähtökohtia.
 COXAN PULSSI Tuula Rantala Hoitotyön johtaja 22.10.2014 Ylpeys omasta työstä ja yhteishenki ovat tekemisen lähtökohtia. COXAN PULSSI Mittaa sekä kovia että pehmeitä arvoja ja niiden yhteisvaikutusta Liikennevalokäytäntö;
Särmäystyökalut kuvasto Press brake tools catalogue
 Finnish sheet metal machinery know-how since 1978 Särmäystyökalut kuvasto Press brake tools catalogue www.aliko.fi ALIKO bending chart Required capacity in kn (T) in relation to V-opening. V R A S = plates
Constructive Alignment in Specialisation Studies in Industrial Pharmacy in Finland
 Constructive Alignment in Specialisation Studies in Industrial Pharmacy in Finland Anne Mari Juppo, Nina Katajavuori University of Helsinki Faculty of Pharmacy 23.7.2012 1 Background Pedagogic research
Sähköjärjestelmän käyttövarmuus & teknologia Käyttövarmuuspäivä 25.11.2014
 Sähköjärjestelmän käyttövarmuus & teknologia Käyttövarmuuspäivä 25.11.2014 Jarmo Partanen, professori, Lappeenrannan yliopisto jarmo.partanen@lut.fi +358 40 5066 564 Electricity Market, targets Competitive
Organisaation kokonaissuorituskyvyn arviointi
 Organisaation kokonaissuorituskyvyn arviointi Aila Järveläinen, 13.3.2018 aila.jarvelainen@trafi.fi Responsible traffic. Courage and co-operation. Hallintojärjestelmä CMS + SMS CMS SMS 29.3.2018 Finnish
Satelliittikuvat osana öljypäästövalvontaa
 Öljypäästövalvonta Euroopan meriturvallisuusviraston (EMSA) satelliittikuvilta Kati Tahvonen Suomen ympäristökeskus Kaukokartoituspäivät 2007 Helsinki, 8.11.2007 Satelliittikuvat osana öljypäästövalvontaa
Menetelmät. Tilastolliset Deterministiset. Alustava tieto Monitoroinnin suunnittelu --> riskianalyysi
 3 parametriä Aika Paikka Suuruus Menetelmät Tilastolliset Deterministiset Tektoniikka [kulunut aika; lapse time] Fysikaalinen malli [monitorointi] Aikaskaalat Pitkä aikaväli [tilastot] Alustava tieto Monitoroinnin
Accommodation statistics
 Transport and Tourism 2011 Accommodation statistics 2011, January Nights spent by foreign tourists in Finland increased by per cent in January The number of recorded nights spent by foreign tourists at
anna minun kertoa let me tell you
 anna minun kertoa let me tell you anna minun kertoa I OSA 1. Anna minun kertoa sinulle mitä oli. Tiedän että osaan. Kykenen siihen. Teen nyt niin. Minulla on oikeus. Sanani voivat olla puutteellisia mutta
The Viking Battle - Part Version: Finnish
 The Viking Battle - Part 1 015 Version: Finnish Tehtävä 1 Olkoon kokonaisluku, ja olkoon A n joukko A n = { n k k Z, 0 k < n}. Selvitä suurin kokonaisluku M n, jota ei voi kirjoittaa yhden tai useamman
Wärtsilä Corporation. Interim Report January-June 2003 Ole Johansson President & CEO. 31 July Wärtsilä
 Wärtsilä Corporation Interim Report January-June 2003 Ole Johansson President & CEO 31 July 2003 Group structure Power Divisions Engine division Marine Power Plants Service Holding Assa Abloy 7.6% 2 Group
Sisällysluettelo Table of contents
 Sisällysluettelo Table of contents OTC:n Moodlen käyttöohje suomeksi... 1 Kirjautuminen Moodleen... 2 Ensimmäinen kirjautuminen Moodleen... 2 Salasanan vaihto... 2 Oma käyttäjäprofiili... 3 Työskentely
On instrument costs in decentralized macroeconomic decision making (Helsingin Kauppakorkeakoulun julkaisuja ; D-31)
") On instrument costs in decentralized macroeconomic decision making (Helsingin Kauppakorkeakoulun julkaisuja ; D-31) Juha Kahkonen Click here if your download doesn"t start automatically On instrument costs
On instrument costs in decentralized macroeconomic decision making (Helsingin Kauppakorkeakoulun julkaisuja ; D-31) Juha Kahkonen Click here if your download doesn"t start automatically On instrument costs
Tarua vai totta: sähkön vähittäismarkkina ei toimi? 11.2.2015 Satu Viljainen Professori, sähkömarkkinat
 Tarua vai totta: sähkön vähittäismarkkina ei toimi? 11.2.2015 Satu Viljainen Professori, sähkömarkkinat Esityksen sisältö: 1. EU:n energiapolitiikka on se, joka ei toimi 2. Mihin perustuu väite, etteivät
Miehittämätön meriliikenne
 Rolls-Royce & Unmanned Shipping Ecosystem Miehittämätön meriliikenne Digimurros 2020+ 17.11. 2016 September 2016 2016 Rolls-Royce plc The 2016 information Rolls-Royce in this plc document is the property
EUROOPAN PARLAMENTTI
 EUROOPAN PARLAMENTTI 2004 2009 Kansalaisvapauksien sekä oikeus- ja sisäasioiden valiokunta 2008/0101(CNS) 2.9.2008 TARKISTUKSET 9-12 Mietintöluonnos Luca Romagnoli (PE409.790v01-00) ehdotuksesta neuvoston
MUSEOT KULTTUURIPALVELUINA
 Elina Arola MUSEOT KULTTUURIPALVELUINA Tutkimuskohteena Mikkelin museot Opinnäytetyö Kulttuuripalvelujen koulutusohjelma Marraskuu 2005 KUVAILULEHTI Opinnäytetyön päivämäärä 25.11.2005 Tekijä(t) Elina
Curriculum. Gym card
 A new school year Curriculum Fast Track Final Grading Gym card TET A new school year Work Ethic Detention Own work Organisation and independence Wilma TMU Support Services Well-Being CURRICULUM FAST TRACK
Use of spatial data in the new production environment and in a data warehouse
 Use of spatial data in the new production environment and in a data warehouse Nordic Forum for Geostatistics 2007 Session 3, GI infrastructure and use of spatial database Statistics Finland, Population
Reliable diagnostic support Ultra-light design
 EN Powerful illumination Intelligent charging management Reliable diagnostic support Ultra-light design VISIOMED Optima UV original scale 1:1 VISIOMED Optima Quality Made Easy and an illumination close
TEST REPORT Nro VTT-S Air tightness and strength tests for Furanflex exhaust air ducts
 TEST REPORT Nro VTT-S-04515-08 19.5.008 Air tightness and strength tests for Furanflex exhaust air ducts Requested by: Hormex Oy TEST REPORT NRO VTT-S-04515-08 1 () Requested by Order Hormex Oy Linnanherrankuja
GOOD WORK LONGER CAREER:
 Juhani Ilmarinen, Ville Ilmarinen, Pekka Huuhtanen, Veikko Louhevaara, Ove Näsman GOOD WORK LONGER CAREER: WORK WELL-BEING IN FINNISH TECHNOLOGY INDUSTRIES 2010-2015 Background Collective agreement between
Innovative and responsible public procurement Urban Agenda kumppanuusryhmä. public-procurement
 Innovative and responsible public procurement Urban Agenda kumppanuusryhmä https://ec.europa.eu/futurium/en/ public-procurement Julkiset hankinnat liittyvät moneen Konsortio Lähtökohdat ja tavoitteet Every
Salasanan vaihto uuteen / How to change password
 Salasanan vaihto uuteen / How to change password Sisällys Salasanakäytäntö / Password policy... 2 Salasanan vaihto verkkosivulla / Change password on website... 3 Salasanan vaihto matkapuhelimella / Change
Vaisala s New Global L ightning Lightning Dataset GLD360
 Vaisala s New Global Lightning Dataset GLD360 Vaisala Global Lightning Dataset GLD360 Page 2 / Oct09 / Holle-SW Hydro / Vaisala Schedule GLD360 Validation Applications Demonstration Page 3 / Oct09 / Holle-SW
Accommodation statistics
 Transport and Tourism 2013 Accommodation statistics 2012, December Nights spent by foreign tourists in Finland up by 45 per cent in December 2012 The number of recorded nights spent by foreign tourists
FinFamily PostgreSQL installation ( ) FinFamily PostgreSQL
 FinFamily PostgreSQL") FinFamily PostgreSQL 1 Sisällys / Contents FinFamily PostgreSQL... 1 1. Asenna PostgreSQL tietokanta / Install PostgreSQL database... 3 1.1. PostgreSQL tietokannasta / About the PostgreSQL database...
FinFamily PostgreSQL 1 Sisällys / Contents FinFamily PostgreSQL... 1 1. Asenna PostgreSQL tietokanta / Install PostgreSQL database... 3 1.1. PostgreSQL tietokannasta / About the PostgreSQL database...
Returns to Scale II. S ysteemianalyysin. Laboratorio. Esitelmä 8 Timo Salminen. Teknillinen korkeakoulu
 Returns to Scale II Contents Most Productive Scale Size Further Considerations Relaxation of the Convexity Condition Useful Reminder Theorem 5.5 A DMU found to be efficient with a CCR model will also be
Accommodation statistics
 Transport and Tourism 2013 Accommodation statistics 2013, February Nights spent by foreign tourists in Finland down by 2.5 per cent in February 2013 The number of recorded nights spent by foreign tourists
Precise Levelling of the Olkiluoto GPS Network in 2005
 Working Report 2006-27 Precise Levelling of the Olkiluoto GPS Network in 2005 Pekka Lehmuskoski July 2006 POSIVA OY FI-27160 OLKILUOTO, FINLAND Tel +358-2-8372 31 Fax +358-2-8372 3709 Working Report 2006-27
Research plan for masters thesis in forest sciences. The PELLETime 2009 Symposium Mervi Juntunen
 Modelling tree and stand characteristics and estimating biomass removals and harvesting costs of lodgepole pine (Pinus contorta) plantations in Iceland Research plan for masters thesis in forest sciences
The Finnish healthcare service grid and access in rural Finland
 The Finnish healthcare service grid and access in rural Finland Kimmo Parhiala, M.Soc.Sc Development Manager, National Institute for Health and Welfare TW: @parhialakimmo 20.6.2017 The Finnish healthcare
Alternative DEA Models
 Mat-2.4142 Alternative DEA Models 19.9.2007 Table of Contents Banker-Charnes-Cooper Model Additive Model Example Data Home assignment BCC Model (Banker-Charnes-Cooper) production frontiers spanned by convex
Rotarypiiri 1420 Piiriapurahoista myönnettävät stipendit
 Rotarypiiri 1420 Piiriapurahoista myönnettävät stipendit Ø Rotarypiiri myöntää stipendejä sille osoitettujen hakemusten perusteella ensisijaisesti rotaryaatteen mukaisiin tarkoituksiin. Ø Stipendejä myönnetään
HIRLAM diagnostics for operations and experiments
 HIRLAM diagnostics for operations and experiments HIRLAM-ALADIN-MF miniworkshop on mesoscale physics and diagnostic tools Met.No, 12-13 December 2005 Carl Fortelius, FMI 11.12.05 HIRLAM diagnostics Purpose
Työsuojelurahaston Tutkimus tutuksi - PalveluPulssi 11.3.2016. Peter Michelsson Wallstreet Asset Management Oy
 Työsuojelurahaston Tutkimus tutuksi - PalveluPulssi 11.3.2016 Peter Michelsson Wallstreet Asset Management Oy Wallstreet lyhyesti Perustettu vuonna 2006, SiPa toimilupa myönnetty 3/2014 Täysin kotimainen,
Tutkimusdata ja julkaiseminen Suomen Akatemian ja EU:n H2020 projekteissa
 Tutkimusdata ja julkaiseminen Suomen Akatemian ja EU:n H2020 projekteissa Tutkimusasiamies Kaisa Männikkö Tutkimus- ja innovaatiopalvelut Suomen Akatemian projektit Suomen Akatemia kehottaa avoimeen tieteelliseen
TAMPEREEN TEKNILLINEN YLIOPISTO Teollisuustalous
 Muista merkita nimesi Ja opiskeliianumerosi iokaiseen paperiin. Myös optiseen lomakkeeseen. Älii irroita papereita nipusta. Kaikki paperit on palautettava. TAMPEREEN 290 10 10 Tuotannonohjauksen tentti
Security server v6 installation requirements
 CSC Security server v6 installation requirements Security server version 6.4-0-201505291153 Pekka Muhonen 8/12/2015 Date Version Description 18.12.2014 0.1 Initial version 10.02.2015 0.2 Major changes
On instrument costs in decentralized macroeconomic decision making (Helsingin Kauppakorkeakoulun julkaisuja ; D-31)
") On instrument costs in decentralized macroeconomic decision making (Helsingin Kauppakorkeakoulun julkaisuja ; D-31) Juha Kahkonen Click here if your download doesn"t start automatically On instrument costs
On instrument costs in decentralized macroeconomic decision making (Helsingin Kauppakorkeakoulun julkaisuja ; D-31) Juha Kahkonen Click here if your download doesn"t start automatically On instrument costs
AYYE 9/ HOUSING POLICY
 AYYE 9/12 2.10.2012 HOUSING POLICY Mission for AYY Housing? What do we want to achieve by renting apartments? 1) How many apartments do we need? 2) What kind of apartments do we need? 3) To whom do we
GPS operations at Olkiluoto. Kivetty and Romuvaara for 1998
 Working Report 99-31 GPS operations at Olkiluoto. Kivetty and Romuvaara for 1998 Matti Ollikainen Juhani Kakkuri April 1999 POSIVA OY Mikonkatu 15 A, FIN-1 HELSINKI, FINLAND Tel. +358-9-228 3 Fax +358-9-228
EU FP7 EURATOM vuoden 2011 työohjelman valmistelu, mitä tiedetää. ään n? Reaktoriturvallisuus
 EU FP7 EURATOM vuoden 2011 työohjelman valmistelu, mitä tiedetää ään n? Reaktoriturvallisuus Eija Karita Puska, VTT EURATOM in FP 7 (from FP7 factsheets www.ec.europa.eu/research) 2 Budget: 2.7 billion
Siirtymä maisteriohjelmiin tekniikan korkeakoulujen välillä Transfer to MSc programmes between engineering schools
 Siirtymä maisteriohjelmiin tekniikan korkeakoulujen välillä Transfer to MSc programmes between engineering schools Akateemisten asioiden komitea Academic Affairs Committee 11 October 2016 Eija Zitting
Social and Regional Economic Impacts of Use of Bioenergy and Energy Wood Harvesting in Suomussalmi
 Social and Regional Economic Impacts of Use of Bioenergy and Energy Wood Harvesting in Suomussalmi Green Cities and Settlements 18.2.2014 Ville Manninen Writers Project group Sirpa Korhonen, Anna Mari
Valuation of Asian Quanto- Basket Options
 Valuation of Asian Quanto- Basket Options (Final Presentation) 21.11.2011 Thesis Instructor and Supervisor: Prof. Ahti Salo Työn saa tallentaa ja julkistaa Aalto-yliopiston avoimilla verkkosivuilla. Muilta
7. Product-line architectures
 7. Product-line architectures 7.1 Introduction 7.2 Product-line basics 7.3 Layered style for product-lines 7.4 Variability management 7.5 Benefits and problems with product-lines 1 Short history of software
3 9-VUOTIAIDEN LASTEN SUORIUTUMINEN BOSTONIN NIMENTÄTESTISTÄ
 Puhe ja kieli, 27:4, 141 147 (2007) 3 9-VUOTIAIDEN LASTEN SUORIUTUMINEN BOSTONIN NIMENTÄTESTISTÄ Soile Loukusa, Oulun yliopisto, suomen kielen, informaatiotutkimuksen ja logopedian laitos & University