CONTAINERSHIPS GROUP FINANCIAL STATEMENTS AND REPORT OF THE BOARD OF DIRECTORS Business identifi cation code: Domicile: Espoo
|
|
|
- Ilmari Mäkelä
- 6 vuotta sitten
- Katselukertoja:
Transkriptio
1 CONTAINERSHIPS GROUP FINANCIAL STATEMENTS AND REPORT OF THE BOARD OF DIRECTORS 2018 Business identifi cation code: Domicile: Espoo
2 TABLE OF CONTENTS page REPORT OF THE BOARD OF DIRECTORS CONSOLIDATED STATEMENT OF COMPREHENSIVE INCOME (IFRS) CONSOLIDATED BALANCE SHEET (IFRS) CONSOLIDATED STATEMENT OF CASH FLOWS (IFRS) CONSOLIDATED STATEMENT OF CHANGES IN EQUITY (IFRS) NOTES TO THE CONSOLIDATED FINANCIAL STATEMENTS (IFRS) Note 1 Corporate information Note 2 Basis of preparation of the Financial Statements Note 3 Significant accounting policies Note 4 Operating segments Note 5 Group structure Note 6 Revenue Note 7 Other income Note 8 Other expenses Note 9 Materials and services Note 10 Employee benefit expenses Note 11 Depreciation, amortisation and impairment losses Note 12 Finance income and costs Note 13 Income taxes Note 14 Property, plant and equipment Note 15 Intangible assets Note 16 Inventories Note 17 Other financial assets Note 18 Trade and other receivables Note 19 Cash and cash equivalents Note 20 Capital and reserves Note 21 Classification of financial assets and liabilities Note 22 Interest-bearing loans and borrowings Note 23 Other financial liabilities Note 24 Trade and other payables Note 25 Financial risk management Note 26 Operating leases Note 27 Commitments and contingencies Note 28 Related party disclosures Note 29 Events after the reporting period PARENT COMPANY CLOSING OF THE ACCOUNTS Parent company income statement Parent company balance sheet Parent company cash flow statement Notes to the parent company financial statements Signing by the Board of Directors and Auditors note List of accounting journals AUDITOR S REPORT Business identification code: Main office: Espoo, Finland Address: Linnoitustie 6 C, Espoo, Finland Website: The consolidated statements of comprehensive income should be read in conjunction with the accompanying notes. 2 CONTAINERSHIPS CONSOLIDATED FINANCIAL STATEMENTS 2018
3 REPORT OF THE BOARD OF DIRECTORS 2018 GROUP OVERVIEW Containerships is a Finnish full-service logistics company providing safe, fast container transportation in the Baltic Sea, North Sea and the Mediterranean. Containerships offers both standard and customised containers and variable logistics solutions from door to door. The Group s business focus is in the Baltics, where Containerships is one of the leading companies in the business. In the 2010s, the Group successfully expanded operations to the Mediterranean Sea, where operations currently account for 13% of the Group s revenue. Our service promise about seamless logistic chain from door to door is based on a special equipment which enables the optimizing of logistics chain, as well as on a close cooperation with selected port operators. The door-to-door service includes sea transportation on container vessels as well as land transportation by truck, train or ferry from or to the port. The service includes also warehousing. Containerships administers directly both vessels and containers as well as a significant part of the trucks it operates. Together with its agents, Containerships has sales and operational offices in 21 countries. The Group s revenue in 2018 was million. Containerships plc s bond totalling 60.0 million is listed on Nasdaq Helsinki (Helsinki stock exchange) and is repayable in The combination agreement between Container Finance Ltd Oy and CMA CGM was closed on Upon closing the agreement, Containerships plc became part of CMA CGM s intra-regional market offering in Europe and Mediterranean area. The CMA CGM group is world leader of maritime transport. CMA CGM group s CEO is Rodolphe Saadé. Groups 494 ships serve more than 420 ports worldwide on the five continents. In 2017, they transported nearly 19 million TEU. CMA CGM employs more than persons in the world and in Marseilles where its headquarters is located. CMA CGM is present in 160 countries via its network of 755 agencies. CMA CGM is committed to LNG technology by having ordered nine TEU LNG vessels. Containerships Corporate Governance is published on the Group s Internet page > Corporate Governance. OPERATING ENVIRONMENT In 2018, various geopolitical, economic and legislative events impacted the logistics market in Containerships area of operation. Nevertheless, there were no changes in the operating environment dramatically affecting the Group s activities or performance in Oil prices impact the logistics sector in various ways. Sharp increase in bunker prices that started from the last quarter of 2017 impacted directly on the Group s operating expenses. At the same time, Russia and Libya, two markets important for the Group, are expected to see economic growth in the future as the price of oil rises. The Russian import ban continues to have an impact, particularly on cargo flow from Europe to Russia. When the ban entered into force in 2014, Containerships successfully changed its strategy in the Russian market and replaced grocery cargoes with other cargoes and increased cargo flow from Russia to Europe. In 2018, Russian exports continued to increase. Some markets in North Africa are exposed to political and economic insecurity. For instance, growing insecurity in the Group s important market Libya has increased handling times in ports. Growing political unrest in Turkey has not yet impacted the Group s freight volumes. In June 2016, the United Kingdom voted to withdraw from the European Union. Brexit did not have an impact on cargo volumes in In the future, the UK s withdrawal from the EU may cause a decrease in cargo flows to the UK. However, on the other hand, it may strengthen the country s exports. THE MARKET OVERVIEW Overall freight volumes in the Group s area of operation increased in The share of unitised cargoes containers and trailers continued growing as in previous years. Cargo units between North and Continental Europe remained in balance in 2018, while overall volume growth was 18%. In the Mediterranean the shipping between Turkey and North Africa grew 4% compared to SIGNIFICANT EVENTS DURING THE REPORTING PERIOD First of the new LNG vessels was delivered in December 2018 and the rest three of the previously ordered LNG cargo ships will be delivered during According to the strategy, the Group continued to invest in sustainable development. At the end of the year, Containerships Group had 40 LNG-powered trucks in Great Britain and 16 units in other markets. Figures include contracted 15 units in Netherlands market. The Group paid special attention to increase its operational efficiency. Through this special focus, the utilisation rates of vessels, containers and trucks were improved. These activities had a positive impact on the Group s performance. CONTAINERSHIPS CONSOLIDATED FINANCIAL STATEMENTS
4 FINANCIAL PERFORMANCE 2018 (2017) Group consolidated net sales for the period grew from previous year and were million ( million) but the operational result weakened. Recorded EBITDA was 13.3 million ( 15.2 million) a decrease of 1.9 million (12.4%). One-off item adjusted EBITDA was 15.3 million. The decrease was caused by increased bunker costs due to increase in oil price in the world market. The consolidated operating profit of 4.1 million ( 7.8 million) was also decreased. One-off adjusted EBIT was 8.4 million. The result was also affected by intangible assets write-off of 2.3 million. The investments in the Group s growth according to the strategy have increased financial costs. Group s net result decreased 1.9 million and was a loss of 1.7 million ( 0.2 million). One-off adjusted net profit was 2.6M million, which is split in detail in below table. The Group s equity ratio was 11.6% (16.0%). The Parent Company has two equity loans totalling 11 million. One of which, 5 million, is reported from 2016 onwards as a hybrid capital loan as part of the equity in the financial report, and the other, 6 million, as a converted capital loan reported as debt. According to the terms of secured senior callable bond, both equity loans are considered as equity. Therefore, the adjusted equity ratio is 15.4% (20.8%). The Group s operational cash flow improved to 12.3 million (1.6 million). Net investments were, in total, 35.1 million ( 0.8 million). The Group s cash position was at the satisfactory level of 10.2 million ( 11.3 million) by the end of the year. GROUP KEY FIGURE CHANGE 2016 IFRS IFRS IFRS IFRS Net sales, M 268,0 226,7 18,2 % 197,9 EBITDA, M 13,3 15,2-12,4 % 13,9 EBITDA- % 5,0 % 6,7 % -25,9 % 7,0 % EBITDA, M, adjusted* 15,3 15,2 0,8 % 13,9 EBITDA %, adjusted 5,7 % 6,7 % -14,8 % 7,0 % EBIT, M 4,1 7,8-47,2 % 5,9 EBIT- % 1,5 % 3,4 % -55,3 % 3,0 % EBIT, M, adjusted** 8,4 7,8 8,2 % 5,9 EBIT- %, adjusted 3,1 % 3,4 % -8,5 % 3,0 % Net profit, M -1,7 0,2-1,4 Net profit % -0,6 % 0,1 % -0,7 % Net profit, M, adjusted*** 2,6 1,7-1,4 Net profit %, adjusted 1,0 % 0,8 % -3,4 % ROE % -9,4 % 0,8 % -7,8 % ROE %, adjusted 14,8 % 8,7 % -7,8 % Equity ratio % 11,6 % 16,0 % -27,7 % 16,8 % Equity ratio, adjusted % 15,4 % 20,8 % -25,7 % 21,3 % Net interest bearing debt, M **** 56,2 64,1-12,3 % 46,2 % from Net sales 21,0 % 28,3 % -25,9 % 27,3 % Personnel, on average***** ,0 % 608 FORMULAS USED TO CALCULATE THE KEY FIGURES: Return on equity Profit or loss / Equity * 100 Equity ratio Equity / total assets * 100 Equity ratio, adjusted (Equity + capital loans) / Total assets * 100 * EBITDA has been adjusted according to bond terms with following one-off items: one-off transaction costs 0.9 M, hedging related one-off costs 0,7 M and other one-off costs 0.4 M ** EBIT has been adjusted according to bond terms with intangible asset write-off 2.3 M *** Net profit includes above mentioned EBITDA and EBIT adjustments **** Net interest bearing debt is calculated according to bond terms (does not include the capital loans or LNG vessel leasing liability) ***** Number of personnel on average figure on 2018 is 725. Updated number of personnel for is 633, original figure of 2017 (562) did not include part of the truck drivers. 4 CONTAINERSHIPS CONSOLIDATED FINANCIAL STATEMENTS 2018
5 The Group s CEO is Kari-Pekka Laaksonen. The management team of the Group consists of the CEO, CCO, Head of Financial services, Head of Management reporting & BI, COO, CBDO and Director of Land Operations. Group companies employed an average of 671 (633) persons in Out of increase 40 persons came through increase of own truck drivers in United Kingdom. Total personnel costs were 26.7 million ( 23.1 million), of which the members of management and the members of the Board of Directors accounted for 1.6 million ( 1.2 million). Group had personnel in 15 countries, of which in Finland 111 employees. TARGETS AND STRATEGY The main targets in Containerships strategy are growth and consolidation of market presence. According to the strategy, the Group will be the leading door-to-door operator in the Baltic Sea in the short-sea segment, as well as one of the leading container distributors in Russia by The Group has established transport services between the Baltic Sea and the Mediterranean, and has also a strong position in Central and Eastern European markets. Containerships aims for its service selection to evolve into an entirety of different multimodal logistics solutions. This objective rests on the service selection based on transport time and distance, as well as on the industry s best customer experience and operational reliability. A strong partnership network supports the target. OUTLOOK FOR 2019 Commercial activity within the core market is expected to increase modestly according to the current views of economists. Therefore, the Group s comparable transport volumes are expected to grow. Strengthened oil price is expected to support the economies of, for example, Russia and Libya which are important to the Group. In the current business environment, the Group is aiming to approximately 10% growth and to further improve its profitability. The Group continues its growth through investments in LNG technology. Non-financial information ENVIRONMENTAL RESPONSIBILITY Containerships Group has defined minimising adverse environmental impacts as a strategic objective and sees environmental awareness as competitive edge. Containerships has identified the environmental impacts deriving from its operations and actively strives to minimise them. The most significant environmental impacts are airborne emissions originating in transport operations. Containerships complies with the environmental legislation, which acts as the minimum requirement level for operations, in each of the countries in which it operates. Containerships has actively invested in technologies to reduce emissions. This includes Sulphur scrubbers aboard ships and LNG trucks with regard to road traffic. Already in 2011, the first close-loop scrubber was installed on board MV Containerships VII, and this system has been installed in four other vessels during January Containerships is also committed to reduce the environmental impact on the Baltic Sea by prohibiting ships from emptying wastewater into it. Containerships has ordered four new cargo ships, which will be fuelled by Liquefied Natural Gas (LNG). LNG is colourless, odourless and non-toxic. Gas liquefaction condenses the gas for ease of transport and storage on land and at sea. Besides new ships, the company has also invested in LNG-driven trucks in Finland, Netherlands and Great Britain. The Group has currently over 56 LNG-fuelled trucks in use. Reducing fuel consumption and economical driving are important aspects in developing and monitoring road transport using vehicles running on traditional fuels. Transport management systems are used to, among other things, track location, and the efficient and economical use of the fleet. Containerships trucks are fitted with monitoring systems that report fuel consumption and key aspects, such as braking and idling, in the driver s driving technique. Natural phenomena and accidents in particular cause sudden environmental risks in the logistics industry. The Group has an ISO 9001:2015 quality management system in use in Finland, Russia, Lithuania, Latvia, the Netherlands, Great Britain and Ireland, and an ISO 14001:2015 environmental management system in Finland, Russia and the Netherlands. All the Group s offices use the same Operations Manual in their activities. The Group is committed to reducing the environmental impact of its operations, specially concentrating on reducing the CO 2 emissions. In 2018, the Group succeeded in reducing its CO 2 emissions by 2.7%. SOCIAL RESPONSIBILITY Containerships Group is committed to ensuring a safe, healthy and motivating work environment for its employees. Containerships aims to be a good workplace community by training supervisors and encouraging all employees to be responsible for contributing to building a good workplace community. Containerships Group provides occupational healthcare for its employees in Finland and recommends similar solutions, taking into account local practices, for persons responsible in each country in which we operate. Containerships maintains the working capacity of its employees by, among other things, organising wellbeing at work events and by contributing to the cost of employees exercise and sports activities in their free time. Safety at work is a priority in the Containerships operations. All our drivers participate regularly occupational health and safety training. Containerships ensures that all drivers are provided with the proper training and safety equipment to carry out their work safely and oversees implementation of and compliance with driving and working hours legislation. CONTAINERSHIPS CONSOLIDATED FINANCIAL STATEMENTS
6 We individually train all our LNG truck drivers in the refueling process and they all are equipped with the required personal protective equipment. The Group ensures occupational safety aboard the Containerships CVII vessel it owns. The Group has separate health & safety guidelines, which are regularly monitored and upgraded. The vessel operates in compliance with the ILO s Maritime Labour Convention and the Company recommends similar practices to its partners from whom it charters vessels. Crews have been trained to meet new STCW regulations requirements. Containerships Group complies with the labour legislation in each operational country. Each newcomer to the Company is given induction training in accordance with the Company s general induction plan to ensure effective, equal induction for all new employees. HUMAN RIGHTS Containerships complies with the principles of equality and non-discrimination and respects human rights in all its operations. Containerships is committed to support the culture, where multidiversity of employed people is valued regardless of their ethnical and national background, gender or sexual orientation. The Group employs and complies with a separate Code of Conduct. Containerships is following each countries local legislation regarding child labour and does not accept child labour. If child labour is noticed in own or supplier s operations, it has to be reported immediately to Head Office either to Human Resources or HSEQ. ANTI-BRIBERY Containerships Group is committed to conducting all of its business in an transparent and ethical manner, and has a zero-tolerance policy towards fraud, bribery and any form of dishonesty in its transactions. Containerships employs and complies with Anti-Bribery and Corruption Policy. Containerships Group will uphold all laws relevant to countering bribery, fraud and corruption in all the jurisdictions in which it operates. However, no matter where Containerships, its staff or agents operate they must abide by the laws in respect of conduct both at home and abroad. Bribery and corruption are punishable for individuals. The Group must keep financial records and have appropriate internal controls in place which will evidence the business reason for making payments to third parties. All expenses claims relating to hospitality, gifts or expenses incurred to third parties must be submitted in accordance with the Company s Corporate Governance Policy and specifically record the reason for the expenditure. All accounts, invoices, memoranda and other documents and records relating to dealings with third parties, such as clients, suppliers and business contacts, should be prepared and maintained with strict accuracy and completeness. All employees of the Group are encouraged to raise concerns about any issue or suspicion of malpractice at the earliest possible stage. The CEO together with Regional Management will monitor the effectiveness and review the implementation of this Policy, regularly considering its suitability, adequacy and effectiveness. INVESTMENTS Group s investments were 35.1 million. Investments consisted mainly of vessel, trucks and containers and also ICT-software. THE RISKS The Group s main risks currently relate to the possibility of an escalation in political tension in its operating areas in the Baltic Sea and in the Mediterranean Sea. In addition, the sudden increase of the oil price will cause an increase of the operational costs, which the Group can compensate only with a delay. Changes in the World economic fluctuations may have an impact on good s demand and by that on cargo amounts, and this requires operational sensibility from Group s operations. Group s economic risks are described more precisely in Financial Statement s annexes. DISPUTES Group has on going arbitration concerning the open payments of the ex-agent in Algeria. The Group has made a claim of approximately 1.8 million to the ex-agent. According to the agency agreement, the possible dispute will be solved in mediation handling in London. The Group estimates this procedure to finalised during EVENTS AFTER THE END OF THE FINANCIAL YEAR The combination agreement between Container Finance Ltd Oy and CMA CGM was closed on Upon closing the agreement, Containerships plc will integrate CMA CGM s intra-regional market offering in Europe and Mediterranean area. As result, bondholders could require the repurchase of the Bonds they held as provided in the terms and conditions of the Bonds. The deadline for bondholders to require the repurchase of their Bonds was January 4, By the deadline, Containerships plc received Bonds representing an aggregate nominal principal amount of 11.4 million, which represents approximately 19 per cent of the aggregate nominal principal amount of all the Bonds. Containerships plc paid, on the repurchase date of February 1, 2019, in accordance with the terms of the Bonds upon a Change of Control Put option, 101 per cent of the nominal amount of the Bonds to be repurchased, together with the accrued and unpaid interest. DISTRIBUTION OF PROFIT The Board of Directors proposes that the loss for the year is transferred to the Retained Earnings, and no dividend shall be paid for CONTAINERSHIPS CONSOLIDATED FINANCIAL STATEMENTS 2018
7 Consolidated statement of comprehensive income (IFRS) EUR 1,000 NOTE REVENUE Other income Materials and services Employee benefit expenses Depreciation, amortisation and impairment losses Other expenses Operating profit Finance income Finance costs Net finance costs Profit (-loss) before taxes Income taxes Profit (-loss) for the financial year OTHER COMPREHENSIVE INCOME NOTE ITEMS THAT MAY BE SUBSEQUENTLY RECLASSIFIED TO PROFIT OR LOSS Foreign currency translation differences Other comprehensive income (-loss), net of tax Total comprehensive income (-loss) for the year PROFIT (-LOSS) ATTRIBUTABLE TO: Owners of the company Non-controlling interests TOTAL COMPREHENSIVE INCOME (-LOSS) ATTRIBUTABLE TO: Owners of the company Non-controlling interests The above consolidated statement of comprehensive income should be read in conjunction with the accompanying notes. CONTAINERSHIPS CONSOLIDATED FINANCIAL STATEMENTS
8 Consolidated balance sheet (IFRS) EUR 1,000 NOTE 31 DEC DEC 2017 ASSETS Non-current assets Goodwill Other intangible assets Property, plant and equipment Other non-current financial assets Deferred tax assets Other receivables Total non-current assets Current assets Inventories Trade and other receivables Other current financial assets Current tax assets Cash and cash equivalents Total current assets Total assets EQUITY Share capital Share premium Fund for invested non-restricted equity Translation reserve Retained earnings Hybrid capital loan Equity attributable to owners of the Company Non-controlling interests Total equity LIABILITIES Non-current liabilities Convertible capital loan Bond Other non-current liabilities Trade and other payables Other non-current financial liabilities Deferred tax liabilities Total non-current liabilities Current liabilities Convertible capital loan Interest-bearing loans and borrowings Trade and other payables Other current financial liabilities Current tax liabilities Total current liabilities Total liabilities Total equity and liabilities CONTAINERSHIPS CONSOLIDATED FINANCIAL STATEMENTS 2018
9 Consolidated statement of cash flows (IFRS) EUR 1,000 NOTE CASH FLOWS FROM OPERATING ACTIVITIES Profit before tax Adjustments: Other operating income Other operating cost Depreciation, amortisation and impairment losses Finance income Finance costs Other adjustments Changes in working capital: Change in trade and other receivables Change in inventories Change in trade and other payables Interest received Income taxes paid Other financing items Net cash from operating activities CASH FLOWS FROM INVESTING ACTIVITIES Proceeds from sale of property, plant and equipment Acquisition of property, plant and equipment Net from investing activities CASH FLOWS FROM FINANCING ACTIVITIES Proceeds from loans and borrowings Other receivable (Escrow-accounts)* Interest paid Proceeds from settlement of derivatives Transaction costs related to loans and borrowings Payment of finance lease liabilities Paid finance lease interest Net cash from financing activities NET CHANGE IN CASH AND CASH EQUIVALENTS Cash and cash equivalents at 1 January Net foreign exchange difference on cash held Cash and cash equivalents 31 December CONTAINERSHIPS CONSOLIDATED FINANCIAL STATEMENTS
10 Consolidated statement of changes in equity (IFRS) Equity attributable to shareholders of the parent company 2018 EUR 1,000 Note Share capital Share premium Fund for invested nonrestricted equity Translation reserve Retained earnings Hybrid loan Total Noncontrolling interests Total equity EQUITY AT Comprehensive income Profit for the reporting period Foreign currency translation differences Total comprehensive income for the year TRANSACTIONS WITH OWNERS OF THE COMPANY Subsidiaries with NCI Share capital increase Hybrid capital loan Convertible capital loan - reclassification Other changes 0 0 Total transactions with owners Equity at Equity attributable to shareholders of the parent company 2017 EUR 1,000 Note Share capital Share premium Fund for invested nonrestricted equity Translation reserve Retained earnings Hybrid loan Total Noncontrolling interests Total equity EQUITY AT Comprehensive income Profit for the reporting period Foreign currency translation differences Total comprehensive income for the year TRANSACTIONS WITH OWNERS OF THE COMPANY Subsidiaries with NCI 5 0 Share capital increase Hybrid capital loan Convertible capital loan - reclassification Other changes 0 0 Total transactions with owners Equity at The above consolidated statement of changes in equity should be read in conjunction with the accompanying notes. 10 CONTAINERSHIPS CONSOLIDATED FINANCIAL STATEMENTS 2018
11 NOTES TO THE CONSOLIDATED FINANCIAL STATEMENTS (IFRS) NOTE 1 Corporate information The principal activities of the Containerships Group contains international door-to-door transportation by sea or by land. Group offers safe, fast and environmental friendly container transportation in the Baltic Sea, North Sea and the Mediterranean areas. Containerships offers both standard and customised containers and variable logistics solutions from door to door. The Group s business focus is in the Baltics, where Containerships is one of the leading companies in the business. Containerships Group has from 1st of November 2018 been part of the CMA CGM -group. MacAndrews GmbH, subsidiary of CMA CGM -group, owns 100 per cent of Container Finance LTD Oy s shares, which owns 100 per cent of Containerships plc shares. Containerships plc is the parent company of Containerships Group. Containerships plc is a Finnish private limited company, which operates under Finnish jurisdiction and legislation. The parent company is domiciled in Espoo and is registered in Espoo at Linnoitustie 6 C, Espoo, Finland. Copies of the financial statements can be obtained from com or the Containerships Group s headquarters. These financial statements were authorised for issue by the Board of Directors of Containerships plc on 26 February In accordance with the Finnish Limited Liability Companies Act, the annual general meeting has the right to approve, reject or take the decision to amend the financial statements following their publication. NOTE 2 Basis of preparation of the financial statements The consolidated financial statements of the Containerships Group are prepared in accordance with International Financial Reporting Standards (IFRSs), using the IAS and IFRS standards and SIC and IFRIC interpretations, which were valid on 31 December 2018 as adopted by the European Union. The International Financial Reporting Standards refer to the standards implemented in the EU by Regulation (EC) 1606/2002, and the related interpretations. The notes to the Consolidated Financial Statements also comply with Finnish accounting and corporate legislation supplementing the IFRS. The consolidated financial statements for the year ended 31 December 2018 comprise of the parent company and its subsidiaries together referred to as the Group. In addition to the ownership of the subsidiaries, the company has a representative office in Denmark. More detailed information regarding the Group structure is presented in Note 5. The Consolidated Financial Statements are prepared for the calendar year, which is the financial year of the parent company and the other Group companies. Consolidated financial statements are presented in thousands of euro. The consolidated financial statements have been prepared on a historical cost basis except for the derivative financial instruments, which are measured at fair value and financial instruments held for trading, which are classified as at fair value through profit or loss and measured at fair value. At the beginning of the financial year, the Group has adopted IFRS 9 Financial Instruments and IFRS 15 Revenue from Contracts with Customers that came into force on 1 January Other amendments or interpretations of the standard have had no effect on the financial statements of the Container ships Group. IFRS 9 replaced the former IAS 39 Financial Instruments: Recognition and Measurement. IFRS 9 includes revised guidance on the classification, recognition and measurement of financial instruments. The Group s financial assets and liabilities are classified as financial assets and liabilities at amortized cost or at fair value through profit or loss in accordance with IFRS 9. The Group does not have financial instruments valued at fair value through other comprehensive income. IFRS 9 also includes a new model for accounting for expected credit losses that is applied to determine impairment losses on financial assets. Containerships apply the simplified procedure in the standard, which recognizes impairment losses to an amount that is expected to be impaired throughout the life of the asset. The standard for general hedge accounting has also been revised. Containerships does not apply hedge accounting. Derivatives are classified as financial assets and liabilities at fair value through profit or loss. The provisions of IAS 39 on the recognition and derecognition of financial instruments have been retained. The IFRS 9 standard was applied retrospectively, with no reclassification of financial assets and liabilities except for the impact on the consolidated financial statements. IFRS 15 replaced the existing guidance on income recognition and provides a comprehensive reference framework for determining whether and how much sales revenue can be CONTAINERSHIPS CONSOLIDATED FINANCIAL STATEMENTS
12 recognized. IFRS 15 includes a five-step model for identifying and determining the amount of revenue. Revenue is recognized when the control is transferred to the customer, which is deemed to occur when the entity transfers ownership of the asset to the customer over time or at a specific time. The IFRS 15 standard was applied retrospectively using practical measures. Door-to-door shipments consist of ship and inland container shipments, which are treated as separate performance obligations. Sales revenue is mainly recorded over time. Introduction of IFRS 15 has not had any major impact on the consolidated financial statements, with the exception of the increased amount of information on the notes. Amendments to other standards were not relevant for Containerships Group. USE OF JUDGEMENTS AND ASSUMPTIONS The preparation and presentation of the consolidated financial statements in accordance with IFRSs requires management to make judgements, estimates and assumptions that affect the application of accounting policies and the reported amounts of assets, liabilities, income and expenses. These estimates are based on management s best knowledge of current events and actions and actual results may differ from these estimates. Estimates and underlying assumptions are reviewed on an ongoing basis. Revisions to accounting estimates are recognised in the period in which the estimates are revised and in any future periods affected. In preparing these consolidated financial statement areas involving significant judgements made in applying accounting policies relate to recognition of deferred tax asset for carried forward tax, valuation of receivables and estimation of useful lives and residual values of ships, containers and other non-current assets. Assumptions and estimation uncertainty Information about assumptions and estimation uncertainties that have a significant risk of resulting in a material adjustment within the next financial year are included in the following notes: Impairment test: key assumptions underlying recoverable amounts. Impairment exists when the carrying value of an asset or cash generating unit exceeds its recoverable amount, which is the higher of its fair value less costs of disposal and its value in use. The value in use calculation is based on a DCF model and the cash flows are derived from the budget for the next five years. The recoverable amount is sensitive to the discount rate used for the DCF model as well as the expected future cash-inflows and the growth rate used for extrapolation purposes. The key assumptions used to determine the recoverable amount for the different CGUs, including a sensitivity analysis, are disclosed in Note 15. Recognition of deferred tax assets: availability of future taxable profit against which tax losses carried forward can be used. Deferred tax assets are recognised for unused tax losses to the extent that it is probable that taxable profit will be available against which the losses can be utilised. Significant management judgement is required to determine the amount of deferred tax assets that can be recognised, based upon the likely timing and the level of future taxable profits, together with future tax planning strategies. Further details on taxes are disclosed in Note 13. NOTE 3 Significant accounting policies BASIS OF CONSOLIDATION Business combinations Acquisitions of businesses are accounted for using the acquisition method. The Group measures goodwill as the fair value of the consideration transferred including the recognised amount of any non-controlling interest in the acquiree, less the net recognised fair value of the identifiable assets acquired and liabilities assumed, all measured as of the acquisition date. Any goodwill that arises is tested annually for impairment. Transaction costs, other than those associated with the issue of debt or equity securities, that the Group incurs in connection with a business combination are expensed as incurred. For acquisitions that took place before 1 January 2014 (IFRS transition date), goodwill has been recognised at the cost corresponding to the carrying amount under the previous accounting principles, hence Containerships applied the business combinations exemption in IFRS 1. Subsidiaries The Consolidated Financial Statements include the parent company, Containerships plc, and its subsidiaries. All companies in which Containerships plc directly or indirectly holds more than 50 per cent of the voting rights, or over which it otherwise has control, are included. Subsidiaries are entities controlled by the Group. The control exists when the Group is exposed to, or has rights to, variable returns from its involvement with the entity and has the ability to affect those returns through its power over the entity. The financial statements of the subsidiaries used in the preparation of the consolidated financial statements are prepared as at the same reporting date. Subsidiaries are fully consolidated from the date of acquisition, being the date on which the Group obtains control, and continue to be consolidated until the date that such control ceases. All intra-group transactions, balances, income and expenses are eliminated in full upon consolidation. The subsidiaries accounting principles have been adjusted in the consolidation to correspond to the Group s accounting principles where appropriate. Non-controlling interests are measured at their proportionate share of the acquiree s identifiable net assets. 12 CONTAINERSHIPS CONSOLIDATED FINANCIAL STATEMENTS 2018
13 Translation of foreign currency items Items in each Group company s accounts are valued in the principal currency of the operating environment of the company in question (the functional currency ). These consolidated financial statements are presented in euro, which is the functional and presentation currency of the parent company. All amounts have been rounded to the nearest thousand, unless otherwise indicated. The total sum of individual figures can deviate from the presented sum figure. Foreign currency transactions Transactions in foreign currencies are translated into the respective functional currencies of the Group companies at the exchange rates at the dates of the transactions. Monetary assets and liabilities denominated in foreign currencies at the reporting date are retranslated to the functional currency at the exchange date rate at that date. Non-monetary items that are measured in terms of historical cost in a foreign currency are translated using the exchange rate at the date of the transaction. Profits and losses arising from foreign currency valued transactions and translation of foreign currency valued monetary items are recognised in the profit and loss. Foreign operations Assets and liabilities of foreign operations, including goodwill and fair value adjustments arising on acquisition, are translated to euros at exchange rates at the reporting date. Income and expenses of foreign operations are translated to euros using the average exchange rates of the reporting period. Translation differences relating to the elimination of acquisition costs and goodwill in foreign currency and accumulated post-acquisition items classified as equity are recognised in other comprehensive income, and presented in the foreign currency translation reserve in equity. Changes in translation difference are presented in other comprehensive income. When a foreign operation is disposed of such that control or significant influence is lost the cumulative amount in the foreign currency translation reserve related to that foreign operation is reclassified to profit or loss as part of the gain or loss on disposal. When the Group disposes of only part of its interest in a subsidiary that includes a foreign operation while retaining control, the relevant proportion of the cumulative amount is reattributed to non-controlling interests. Containerships has applied the IFRS transition relief, which assumes that the accumulated translation differences of all foreign entities are assumed to be zero on the IFRS transition date 1 January FINANCIAL INSTRUMENTS Financial assets Financial assets are classified into loans and receivables and financial assets at fair value through profit or loss. The classification is dependent on the original purpose of the acquisition of the financial assets. The classification is determined at the time of the acquisition of the financial assets. Transaction costs are included in the original carrying value of financial assets for assets that are not recognised at fair value through profit or loss. All financial asset acquisitions and sales are recognised at the transaction date or settlement date. The Group s financial assets are classified into the following categories: financial assets at amortized cost and financial assets at fair value through profit or loss. The classification is based on the objective of the business model and on the contractual cash flows of the investments or by applying the fair value option in the initial acquisition. Purchases and sales of financial assets are recognized on the trade date, which is the date on which the Group commits to purchase or sell the financial instrument. In initial recognition, the Group recognizes a financial asset at fair value and, in the case of a financial asset other than a financial asset at fair value through profit or loss, adds or subtracts transaction costs directly attributable to the item. Financial assets are recognized at fair value through profit or loss on initial recognition and transaction costs are recognized in profit or loss. Financial assets that are measured at amortized cost are classified as financial assets whose business objective is to hold financial assets up to maturity to collect contractual cash flows, and cash flows from batches consist exclusively of capital and residual interest. The Group s financial assets at amortized cost consist of ships and other non-derivative receivables and cash. After initial valuation, the value of these financial assets is determined at amortized cost using the effective interest method and deducting any impairment. The Group recognizes a deduction of expected credit losses from a financial asset recognized at amortized cost. Expected credit losses are presented in other operating expenses. Impairment losses are recognized in the profit and loss. The Group applies a simplified procedure for determining expected credit losses on sales and lease receivables recognized at amortized cost and, if applicable, for IFRS 15 client contracts. Expected credit losses are recorded using the booking matrix and recorded in the amount of expected credit losses for the entire term. Expected credit losses are estimated based on historical credit losses. In addition, the assessment takes into account the prevailing economic conditions and expectations for future. The carrying amount of current trade receivables and other receivables is considered to be equal to their fair value. Trade and other receivables are presented in the balance sheet as current assets if they are expected to be realized within 12 months after the end of the reporting period. Financial assets at fair value through profit or loss are classified as financial assets that have been acquired for trading or are classified at fair value through profit or loss at fair value through profit or loss. Financial assets held for trading are acquired primarily for the purpose of obtaining a profit in the short or long term and are presented in either long or shortterm financial assets. CONTAINERSHIPS CONSOLIDATED FINANCIAL STATEMENTS
14 Derocognising Financial Assets Financial assets are derecognised when the Group s contractual rights to cash flows have expired or been transferred to another party or when the Group has transferred substantially all the risks and rewards of ownership to the Group. Cash and cash equivalents Cash and cash equivalents comprise of cash balances, call deposits, short-term bank deposits and short-term highly liquid investments that are readily convertible to known amounts of cash with original maturities of three months or less, which are subject to an insignificant risk of changes in value. Assets on escrow accounts, which are held for procurement of vessels in future periods, are included in current assets. Bank overdrafts are included in current liabilities. Financial liabilities The Group s financial liabilities are classified as financial liabilities at amortized cost and recognized at fair value through profit or loss. Financial liabilities are initially recognized in the accounts at fair value less transaction costs directly attributable to the acquisition or issue of the financial liability. Subsequently, financial liabilities, except for derivative liabilities, are measured at amortized cost using the effective interest method. Transaction costs are included in the original carrying amount of financial liabilities at amortized cost. The Group s financial liabilities at amortized cost consist of interest-bearing loans, finance lease liabilities and other noninterest bearing liabilities, such as trade payables. Other financial liabilities are classified at fair value through profit or loss. Financial liabilities are included in non-current and current liabilities and may be interest-bearing or non-interest-bearing. Financial liabilities are presented as current liabilities if they mature within less than 12 months and the Group has no unconditional right to transfer the debt at least 12 months after the reporting period. The fair value of the debt component of the convertible loan has been determined using the market rate of the corresponding debt at the time the loan was issued. The debt component is recorded at amortized cost until it is amortized by converting the loan into equity or repaying the loan. The remainder of the amount received, in other words, the equity component, is recognized as deferred tax, less accumulated retained earnings. Derecognising financial liabilities from the balance sheet A financial liability is derecognised when the debt has ceased to exist, that is, the obligation specified in the contract has been discharged or cancelled or it has expired. Derivative financial instruments The Group uses derivative financial instruments such as swaps, options and forwards to manage its risks associated with exchange rates, interest rates and oil price fluctuations. Such derivative financial instruments are initially recognised at fair value on the date on which a derivative contract is entered into and are subsequently measured at fair value. Changes in fair value are recognised in profit or loss. Derivatives are carried as assets when the fair value is positive and as liabilities when the fair value is negative. Hedge accounting is not applied to derivative instruments, so they are classified as financial instruments at fair value through profit or loss. Group items are measured at fair value and the fair values of derivative instruments are presented in the balance sheet at long-term or short-term assets and negative fair values are presented in the current or current liabilities of the balance sheet. Both unrealized and realized gains and losses arising from changes in fair value are recognized in profit or loss in the period in which they arise. Fair value changes of interest rate and foreign exchange rate derivatives are recognised in finance income and finance costs. Fair value changes of commodity derivatives are recognised in other income and expenses. The Group uses derivative instruments for hedging purposes, but does not apply hedge accounting in accordance with IAS 39. BORROWING COSTS Borrowing costs that are directly attributable to the acquisition, construction or production of a qualifying asset are included in the cost of that asset, when it is probable that they will result in future economic benefits to the entity and the costs can be measured reliably. Capitalisation is ceased when substantially all the activities necessary to prepare the qualifying asset for its intended use or sale are complete. All other borrowing costs are recognised in profit or loss in the period in which they are incurred. PROPERTY, PLANT AND EQUIPMENT Property, plant and equipment are measured at cost, less accumulated depreciation and any impairment. Cost includes expenditure that is directly attributable to the acquisition of the asset. When parts of an item of property, plant and equipment have different useful lives, they are accounted for as separate items of property, plant and equipment. The cost of replacing a part of an item of property, plant and equipment is recognised in the carrying amount of the item if it is probable that the future economic benefits embodied within the part will flow to the Group, and its cost can be measured reliably. The carrying amount of the replaced part is derecognised. The costs of the day-to-day servicing of property, plant and equipment are recognised in profit or loss as incurred. Also ordinary repair and maintenance expenses are recognised as expenses for the reporting period during which they were incurred. 14 CONTAINERSHIPS CONSOLIDATED FINANCIAL STATEMENTS 2018
15 Depreciation is calculated on a straight-line basis over the estimated useful life of the asset. The estimated useful lives are as follows: Buildings Machinery and equipment Ships Other long-term expenditures Docking costs years 3 10 years 25 years 3 5 years 2 3 years Land is not depreciated. Depreciation of the ships is divided to two components, the vessel and dry-docking as separate components. The estimated useful lives and the residual values of assets are revised at the each end of the reporting period and, when necessary, adjusted to reflect changes that have taken place to the expected future economic benefits. An item of property, plant and equipment is derecognised upon disposal or when no future economic benefits are expected from its use or disposal. Any gain or loss arising on derecognition of the asset is included in profit or loss (in other income or other expenses) in the financial year that the asset is derecognised. A previously recorded impairment loss on property, plant and equipment is reversed if the estimates used in determining the recoverable amount change. An increased carrying amount due to reversal of impairment loss may not exceed the carrying amount that would have been determined for the asset if no impairment loss had been recorded. INTANGIBLE ASSETS Intangible assets are recognised on the balance sheet only if their acquisition costs can be reliably measured and if it is likely that the future economic benefits from the asset will flow to the Group. Goodwill Goodwill arises on the acquisition of subsidiaries and represents the excess of the consideration transferred over the Group s interest in net fair value of the net identifiable assets and liabilities of the acquiree and the fair value of the non-controlling interest in the acquiree. Goodwill is not amortised, but is tested for impairment annually, or whenever there is an indication that goodwill may be impaired. For the purposes of impairment testing, goodwill is allocated to cash-generating unit or group of units that are expected to benefit from the synergies of the combination. A cash-generating unit or group of units to which goodwill has been allocated is tested for impairment annually, or more frequently when there is indication that the unit may be impaired. If the recoverable amount of the cash-generating unit or group of units is less than its carrying amount, the impairment loss is allocated first to reduce the carrying amount of any goodwill allocated to the unit and then to the other assets of the unit pro rata based on the carrying amount of each asset in the unit. Any impairment loss for goodwill is recognised directly in profit or loss. An impairment loss recognised for goodwill is not reversed in subsequent periods. The recoverable amount is the higher of the fair value less costs to sell and value in use. The value in use is determined as the present value of the estimated future cash flows. The discount rate used in the calculations is based on the weighted average cost of capital (WACC). Research and development costs Research expenses are recognised as expenses in the reporting period in which they arise. Development expenses are capitalised only when the Group is able to satisfy the criteria for capitalisation included in IAS 38. Capitalised development costs are amortised over their useful lives. Amortisation of the asset begins when development is completed and the asset is available for use. Other development costs are recognised as expenses. Development expenses that have previously been recognised as expenses are not capitalised in subsequent periods. Research and development costs that have been recognised as expenses are included in the consolidated profit and loss as other expenses. Other intangible assets Other intangible assets are initially recognised at cost. Following initial recognition, intangible assets with finite useful lives are carried at cost less accumulated amortisation and any accumulated impairment losses. Intangible assets with finite lives are amortised over the useful economic life on a straight-line basis and assessed for impairment whenever there is an indication that the intangible asset may be impaired. The useful lives for an intangible asset with a finite life are reviewed at each financial year-end. Amortisation is recognised in profit or loss on a straight-line basis over the estimated useful lives of intangible assets, other than goodwill, from the date that they are available for use. The estimated useful lives are determined separately for each intangible asset. Gains or losses arising from the derecognition of an intangible asset are measured as the difference between the net disposal proceeds and the carrying amount of the asset and are recognised in profit or loss when the asset is derecognised. The intangible assets in-process comprise of software development projects, which cannot be separately tested for impairment, because they do not generate cash flows independently. If at the reporting date it is considered that projects will be completed and software will be phased in, it is concluded that no impairment loss is to be recognised. The intangible assets in-process are, however, tested for impairment as part of that cash-generating units for which they are included in. CONTAINERSHIPS CONSOLIDATED FINANCIAL STATEMENTS
16 IMPAIRMENT Financial assets A financial asset is assessed at each reporting date to determine whether there is any objective evidence that it is impaired. A financial asset is considered to be impaired if objective evidence indicates that one or more events have had a negative effect on the estimated future cash flows of the asset. An impairment loss in respect of a financial asset measured at amortised cost is calculated as the difference between its carrying amount and the present value of its estimated future cash flows discounted at the original effective interest rate. All impairment losses are recognised in profit or loss. When the Group considers that there are no realistic prospects of recovery of the asset, the relevant amounts are written off. An impairment loss is reversed if the reversal can be related objectively to an event occurring after the impairment loss was recognised. For financial assets measured at amortised cost, the reversal is recognised in profit or loss. Non-financial assets The carrying amounts of the Group s non-financial assets are reviewed at each reporting date to determine whether there is any indication of impairment. If any such indication exists, then the asset s recoverable amount is estimated. The recoverable amount of an asset or cash-generating unit is the greater of its value in use and its fair value less costs to sell. In assessing value in use, the estimated future cash flows are discounted to their present value using a pre-tax discount rate that reflects current market assessment of the time value of money and the risks specific to the asset. For the purpose of impairment testing, assets are grouped together or into the smallest group of assets that generates cash inflows from continuing use that are largely independent of the cash inflows of other assets or groups of assets (cash-generating unit). The goodwill acquired in a business combination, for the purpose of impairment testing, is allocated to the cash-generating units that are expected to benefit from the synergies of the combination. An impairment loss is recognised if the carrying amount of an asset or its cash-generating unit exceeds its estimated recoverable amount. Impairment losses are recognised in profit or loss. Impairment losses are allocated first to reduce the carrying amount of any goodwill allocated to the unit and then to reduce the carrying amount of the other assets in the unit (group of units) on a pro rata basis. An impairment loss in respect of goodwill is not reversed. In respect of other assets, impairment losses recognised in prior periods are assessed at each reporting date for any indication that the loss has decreased or no longer exists. An impairment loss is reversed if there has been a change in the estimates used to determine the recoverable amount. An impairment loss is reversed only to the extent that the asset s carrying amount does not exceed the carrying amount that would have been determined, net of depreciation or amortisation, if no impairment loss had been recognised. INVENTORIES Inventories are measured at the lower of cost and net realisable value. The cost of inventories is based on the FIFO principle (first-in first-out), and includes expenditure incurred in acquiring the inventories, production or conversion costs and other costs incurred in bringing them to their existing location and condition. Net realisable value is the estimated purchase price in the ordinary course of business. The Group s inventories comprise mostly bunker (fuel for the ships). EQUITY Instruments issued by the Group, which do not contain a contractual obligation to transfer cash or financial assets or to exchange financial assets or financial liabilities with other entities under potentially unfavourable terms, and which evidence a residual interest in the assets of the Group after deducting all of its liabilities, are classified as equity. Costs arising from issues or acquisitions of equity instruments are accounted for as a deduction from equity. The share capital consists of ordinary shares. Hybrid loans are classified as equity. EMPLOYEE BENEFITS Post-employment benefit plans are classified as either defined contribution plans or defined benefit plans. A defined contribution plan is a post-employment benefit plan under which an entity pays fixed contributions into a separate entity and will have no legal or constructive obligation to pay further amounts. Obligations for contributions to defined contribution pension plans are recognised as an employee benefit expense in profit or loss in the periods during which services are rendered by employees. The Group s post-employment benefit plans are classified as defined contribution pension plans. Payments to these are recognised in profit or loss in the periods they relate to. Short-term employee benefit obligations are measured on an undiscounted basis and are expensed as the related service is provided. PROVISIONS AND CONTINGENT LIABILITIES Provisions are recognised when the Group has a present obligation (legal or constructive) as a result of a past event, it is probable that an outflow of resources embodying economic benefits will be required to settle the obligation and a reliable estimate can be made of the amount of the obligation. If the effect of the time value of money is material, provisions are discounted using a current pre-tax rate that reflects the risk specific to the liability. The expense relating to any provision is presented in profit or loss net of any reimbursement. Where discounting is used, the increase in the provision due to the passage of time is recognised in finance costs. 16 CONTAINERSHIPS CONSOLIDATED FINANCIAL STATEMENTS 2018
17 A provision for onerous contracts is recognised when the expected benefits to be derived by the Group from a contract are lower than the unavoidable cost of meeting its obligations under the contract. A contingent liability is a possible obligation that arises from past events and whose existence will be confirmed only by the occurrence or non-occurrence of one or more uncertain future events not wholly within the control of the Group. An existing obligation that probably does not require a settlement or the amount of which cannot be reliably measured is also a contingent liability. Contingent liabilities are disclosed in note 27. LEASES THE GROUP AS LESSEE Leases in terms of which the Group assumes substantially of all the risks and rewards of ownership are classified as finance leases. Upon initial recognition, the leased asset is measured at an amount equal to the lower of its fair value and the present value of the minimum lease payments. Subsequent to initial recognition, the asset is accounted for in accordance with the accounting policy applicable to that asset. Lease payments are apportioned between the finance charge and the reduction of the lease liability so as to achieve a constant rate of interest on the remaining balance of the liability. Finance charges are recognised as an expense. Capitalised leased assets are depreciated over the shorter of the estimated useful life of the asset and the lease term. If there is reasonable certainty that the Group will obtain ownership of an asset before the end of its lease period, the asset s estimated useful life is the same as its economic life. Leases, where the lessor retains substantially all the risks and benefits of ownership of the asset, are classified as operating leases and lease payments are recognised as operating lease expensed on a straight-line basis over the lease term. Regarding operating leases, the leased assets are not recognised in the Group s balance sheet. LEASES THE GROUP AS LESSOR Leases where the Group is the lessor, are accounted for as finance leases when a substantial part of the risks and rewards of ownership are transferred to the lessee. All the other leases are accounted for as operating leases and the assets are included in the Group s balance sheet and they are depreciated during their useful life. REVENUE RECOGNITION The Group s revenue is mainly generated through sales of services. Revenue is recognised to the extent that it is probable that economic benefits will flow to the Group and the revenue can be reliably measured. Revenue is measured at the fair value of the consideration received or receivable, excluding indirect taxes, trade discounts and volume rebates and adjusted according to exchange rate differences. The Containerships Group s sales revenue consists of services from which sales revenue is recognized when control is transferred to the customer over time. Revenue from transport services is recorded when the service is completed, including the portion of revenue for the year that is in progress at the end of the reporting period, for intermediate deliveries, the completion rate of which is determined on the basis of transport days. Land and sea transport form separate performance obligations if sold together. Revenue from port, logistics, brokerage, and towing services is recorded when the service is completed. Revenue from shipping activities is recognised as the service is provided, including a share of revenue from incomplete voyages at the balance sheet date. Invoiced revenue related to an estimated proportion of remaining voyage time and activities at the destination port is deferred. Revenue from terminal operations, logistics, forwarding activities and towing activities is recognised upon completion of the service. The Group applies general terms of payment for the sector in the agreements and does not include significant financial components or variable remuneration. The Group does not have any significant assets to be recorded from the contract. The Group makes use of a practical aid measure and does not present a portion of the consideration received for part or all of the outstanding performance obligations, if the duration of the contract is no more than one year or the Group has the right to receive from the customer an amount equal to the value of the services rendered to the customer by the time of the review. OPERATING PROFIT According to the definition used by the Group, operating profit is the net amount formed when other income is added to the net sales, and the following items are the subtracted from the total: Materials and services adjusted for the change in inventories of finished goods and work in progress Employee benefit expenses Depreciation, amortisation and impairment losses Other expenses Any other items in profit or loss are shown under operating profit. GOVERNMENT GRANTS Government grants are initially recognised as deferred income at fair value if there is reasonable assurance that the grant will be received and all attaching conditions will be complied with. Grants related to an expense item are recognised as a reduction of the expense over the period necessary to match the grant on a systematic basis to the costs that it is intended to compensate. Government grants relating to seaman salary social costs are deferred and recognised in the profit or loss as an adjustment of the personnel expenses over the period necessary to match CONTAINERSHIPS CONSOLIDATED FINANCIAL STATEMENTS
18 them with the costs that they are intended to compensate. Grants that compensate the Group for the cost of an asset are deducted from the related asset and recognised in profit or loss on a systematic basis over the useful life of the asset. INCOME TAXES Income tax expense comprises current and deferred tax. Current tax and deferred tax are recognised in profit or loss except to the extent these relate to a business combination, or items recognised directly in equity or in other comprehensive income. Current tax is the expected tax payable or receivable on the taxable income or loss for the year, using tax rates enacted or substantively enacted at the reporting date of each country. Taxes are adjusted by possible taxes relating to previous periods. Deferred tax is recognised in respect of temporary differences between the carrying amounts of assets and liabilities for financial reporting purposes and the amounts used for taxation purposes. Deferred tax is measured at the tax rates that are expected to be applied to temporary differences when they reverse, based on the laws that have been enacted or substantively enacted by the reporting date. Deferred tax liabilities are recognised for all taxable temporary differences, except in respect of taxable temporary differences associated with investments in subsidiaries, when the timing of the reversal of the temporary differences can be controlled and it is probable that the temporary differences will not reverse in the foreseeable future. Deferred tax asset is recognised for all deductible temporary differences and any unused tax losses. A deferred tax asset is recognised to the extent that it is probable that future taxable profits will be available against which they can be utilised. Deferred tax assets are reviewed at each reporting date and are reduced to the extent that it is no longer probable that the related tax benefit will be realised. Deferred tax assets and liabilities are offset if there is a legally enforceable right to offset current tax liabilities and assets, and they relate to income taxes levied by the same tax authority on the same taxable entity, or on different tax entities, but they intend to settle current tax liabilities and assets on a net basis or their tax assets and liabilities will be realised simultaneously. In the balance sheet current taxes are reported under current items and deferred taxes are reported under non-current assets or liabilities. NEW AND REVISED STANDARDS AND INTERPRETATIONS INTRODUCED ON At the beginning of the financial year, the Group has adopted the IFRS 9 Financial Instruments and IFRS 15 Revenue from Contracts with Customers that entered into force on 1 January The other new amended standards or interpretations have had no effect on the financial statements of the Containerships Group. IFRS 15, Revenue from Contracts with Customers, creates a comprehensive framework for determining whether, and when, revenue is recognized. IFRS 15 supersedes current guidance on income recognition. IFRS 15 shall be applied for annual periods beginning on or after 1 January IFRS 15 includes a five-step model for identifying and measuring sales revenue. Revenue is realized when the company transfers the ownership of the goods to the customer over time or at a specific moment. IFRS 15 also increases the amount of notes presented. The Containerships Group estimates that the application of IFRS 15 will have no significant impact on the consolidated financial statements. Door-to-door shipments consist of ship and inland container shipments that have separate commitments to sell revenue. Significant rights, which would be separate performance obligations or variable fees that would have a material impact, have not been identified. The Group has adopted the standard effective from 1 January 2018 at the beginning of the financial year. The IFRS 9 Financial Instruments standard replaces the current IAS 39 Financial Instruments: Recognition and Measurement. IFRS 9 shall be applied for annual periods beginning on or after 1 January IFRS 9 includes revised guidance on the recognition and measurement of financial instruments. This also includes a new model of accounting for expected credit losses that is applied to determine impairment of financial assets. The Group will apply the simplified procedure for recognition of credit risk in sales and lease receivables in IFRS 9, according to which write-downs are recognized at the amount expected to be impaired during the lifetime of the receivable. The provisions of IAS 39 on the recognition and derecognition of financial instruments have been retained. The impact of the new standard on the Group depends on the financial instruments used and the current commercial conditions. The Group does not apply hedge accounting in accordance with IAS 39. The Containerships Group estimates that the application of the new IFRS 9 standard will have no significant impact on the consolidated financial statements. The standard will have an impact on the notes to the consolidated financial statements. The Group has adopted the standard effective from 1 January 2018 at the beginning of the financial year. FUTURE NEW STANDARDS AND INTERPRETATIONS The IASB has published new and revised IFRS standards and interpretations that will come into force in the future. The Group has not yet applied the published standards when preparing this consolidated financial statements. The Group will adopt them as of the effective date of each standard and interpretation or, if the effective date is other than the first day of the financial year, from the beginning of the next financial year following the effective date. The Group has assessed their impact on the financial statements: The IFRS 16 Leases standard supersedes IAS 17 and related interpretations. The standard shall be applied for annual periods beginning on or after 1 January IFRS 16 requires lessees to include leases in the balance sheet as a lease payment and an associated asset. Entry in the balance sheet 18 CONTAINERSHIPS CONSOLIDATED FINANCIAL STATEMENTS 2018
19 is very similar to the accounting treatment of financial leasing in accordance with IAS 17. There are two reliefs from entering the balance sheet: short-term leases of up to 12 months and commodities up to $ 5,000. The accounting treatment of lessors will remain largely in line with current IAS 17. IFRS 16 will have a significant impact on the financial statements of the Containerships Group, as the Group has operational leases related to premises, ships and transport equipment currently classified as other leases. The Group estimates that IFRS 16 will increase long-term assets and interest-bearing liabilities in the balance sheet and affect key ratios, such as the ratio of debt to equity. In addition, the application of IFRS 16 also has an impact on the income statement, as depreciation of the asset item and interest expense on the lease liability are recognized instead of the recognition of the lease cost. The Group will apply a simplified method during the transition. The figures for the comparison year will not be corrected. The Group has determined the quantitative effects of the adoption of IFRS 16 as follows: EUR 57.2 million in asset assets and EUR 57.2 million in finance lease liabilities. In the future, Containerships will utilise the above-mentioned practical benefits regarding short term and low-value leasing contracts. IFRIC 23 Uncertainty on Income Tax Treatment (effective for annual periods beginning on or after 1 January 2019) The interpretation clarifies the accounting treatment in a situation where the Community tax solution still awaits the approval of the tax authority. The essential question is to assess whether the tax authority will accept the solution chosen by the Community. In considering this, it is assumed that the tax authority has access to all relevant information when assessing the solution. Other new and amended IFRS standards or interpretations are not expected to have a significant impact on the consolidated financial statement. NOTE 4 Operating segments BASIS FOR SEGMENTATION The Group s segment reporting is based on two strategic business segments which are managed as seperate businesses. The Group has two business segments: CSL Baltics and CSL MED. The Board of Directors (as CODM) reviews internal management reports on at least a quarterly basis. The following summary describes the operations of the Group s reportable segments. CSL BALTICS (BALTIC AND NORTH SEA) The Group is one of the leading short sea door-to-door operators in this region, vessels linking ports in North West Europe and the United Kingdom with ports in Finland, Scandinavia, the Baltic States and Russia. Containerships has been operating in this market since the first container vessel arrived in the UK from Finland in The bulk of activity is centred on and between the hubs of Helsinki (Finland) St. Petersburg (Russia), Teesport (United Kingdom) and Rotterdam (The Netherlands). CSL MED (INTRA-MEDITERRANEAN SERVICES) The Intra-Mediterranean operations were established in 2009 through the acquisition of the Turkish operator Contaz Lines. Today, the Group operates container services between Turkish ports and North African countries, with three vessels offering up to two direct weekly sailings with very short transit times. The Group provides the service coverage from and to Turkey within Libya, Tunis and Algeria. From it s Turkish terminals in Istanbul, Mersin and Izmir door-to-door delivery can be accommodated throughout Turkey. The segments are divided by the geographical areas and they offer similar door-to-door logistics services. The Group s segment performance are assested based on segments results before interest and taxes. ADJUSTMENTS, ELIMINATIONS AND ALLOCATIONS The Group s assets and liabilities are not allocated to operating segments since the Chief operating decision maker does not allocate resources based on segments assets and liabilities or monitor the segments assets and liabilites. Assets and liabilities are managed on a Group basis. Finance income, finance costs and income taxes are not allocated to individual segments. Inter-segment revenues are eliminated on consolidation. Inter-segment pricing is determined on a arm s lenght basis. Segment performance is for the most part measured consistently with profit or loss in the consolidated financial statements. However, FAS-accounting principles, as described in the session covering the financial statements of the parent company, are partly used as a basis for the segment reporting. No operating segments have been aggregated to form the reportable segments. Information regarding the results of reportable segments is included on the next page. CONTAINERSHIPS CONSOLIDATED FINANCIAL STATEMENTS
20 OPERATING SEGMENTS 2018 EUR 1,000 CSL BALTICS CSL MED TOTAL SEGMENTS UNALLOCATED AMOUNTS AND ELIMINATIONS TOTAL GROUP External revenue Inter-segment revenue Total revenue Operating expenses General expenses Other income EBITDA Depreciation and amortisation EBIT Finance income and costs Profit before taxes -878 Income taxes -794 Profit (-loss) for the financial year OPERATING SEGMENTS 2017 EUR 1,000 CSL BALTICS CSL MED TOTAL SEGMENTS UNALLOCATED AMOUNTS AND ELIMINATIONS TOTAL GROUP External revenue Inter-segment revenue Total revenue Operating expenses General expenses Other income EBITDA Depreciation and amortisation EBIT Finance income and costs Profit before taxes 334 Income taxes -165 Profit (-loss) for the financial year CONTAINERSHIPS CONSOLIDATED FINANCIAL STATEMENTS 2018
21 REVENUE BY GEOGRAPHICAL LOCATION EUR 1, FINLAND Russia Turkey United Kingdom Lithuania Other Europe Total The revenue from the geographical areas is reported according to the location of the responsible sales office or subsidiary. NON-CURRENT ASSETS BY LOCATION OF ASSETS EUR 1, FINLAND Russia Turkey United Kingdom Lithuania Other Europe Total Assets are reported according to the geographical location of the assets. The Group had no customers whose revenue exceeded 10 per cent of the Group s total revenues in 2018 and Non-current assets comprise property, plant and equipment and intangible assets. The Group s vessels and containers are also allocated in the reported assets even though they are by nature mobile and their location can be easily changed. Non-current assets exclude financial instruments and deferred tax assets. CONTAINERSHIPS CONSOLIDATED FINANCIAL STATEMENTS
22 NOTE 5 Group structure THE CONSOLIDATED FINANCIAL STATEMENTS OF THE GROUP INCLUDE THE FOLLOWING COMPANIES: NAME OF SUBSIDIARY DOMICILE SEGMENT OWNERSHIP INTEREST OF THE GROUP % CONTAINERSHIPS PLC FINLAND CSL BALTICS PARENT COMPANY Containerships GmbH Germany CSL Baltics 100 CS LNG Holding Oy Finland CSL Baltics 100 Triangle Transport System GmbH Germany CSL Baltics 100 Containerships Rotterdam BV Netherlands CSL Baltics 100 Containerships Dublin Ltd Ireland CSL Baltics 100 Containerships UK Ltd Great Britain CSL Baltics 100 UAB Containership Lithuania CSL Baltics 100 Containerships Latvia SIA Latvia CSL Baltics 100 Containerships Polska Poland CSL Baltics 100 Containerships Belgium N.V. Belgium CSL Baltics 100 Containerships Ukraine Ukraine CSL Baltics 100 ZAO Containerships Russia CSL Baltics 100 CSD Containerships Deutschland GmbH Germany CSL Baltics 100 Nordic Bergen Schifffahrtsgesellschaft mbh & Co KG Germany CSL Baltics 90*) Nordic Turku, Schifffahrtsgesellschaft mbh & Co KG Germany CSL Baltics 90*) Nordic Copenhagen, Schifffahrtsgesellschaft mbh & Co KG Germany CSL Baltics 90*) Nordic Kotka, Schifffahrtsgesellschaft mbh & Co KG Germany CSL Baltics 90*) Containerships Denizcilik Nakliyat Turkey CSL MED 100 Containerships Algerie Sarl Algeria CSL MED 100 Containerships Group is part of Container Finance group, which is based in Finland. The ultimate parent company of the Container Finance group is CMA CGM group, which is based in France. Changes in the Group structure On October 31, 2018, CMA CGM acquired entire share capital of Container Finance LTD Oy, the parent company of the Containerships Group, through a structural reorganization and Containerships Plc and its subsidiaries became part of the CMA CGM Group. 22 CONTAINERSHIPS CONSOLIDATED FINANCIAL STATEMENTS 2018
23 NON-CONTROLLING INTERESTS The following table summarizes the Group s subsidiaries, which have a significant proportion of non-controlling interests. 31 DECEMBER 2018 Information on these subsidiaries with non-controlling interests is presented above. In the following table the financial information presented is roughly evenly distributed to the four subsidiaries concerned. SUBSIDIARIES WITH NCI EUR 1, NCI PERCENTAGE* 10 % 6 % Non-current assets Current assets Non-current liabilities Current liabilities Net Assets 100 % Carrying amount of NCI Revenue Profit OCI 0 0 Total comprehensive income 100 % Profit allocated to NCI -8-8 OCI allocated to NCI 0 0 Cash flows from operating activities Cash flows from investment activities Cash flows from financing activities Net increase (decrease) in cash and cash equivalents *) The share of the Non-controlling interests from the above mentioned four German subsidiaries was 10% at the end of the year CONTAINERSHIPS CONSOLIDATED FINANCIAL STATEMENTS
24 NOTE 6 Revenue REVENUE BY FUNCTION: EUR 1, Vessel operations Terminal operations Haulage Other Total The Group s revenue comprises only rendering of services. NOTE 7 Other income EUR 1, Gains from sales of containers Gains from sales of trucks Changes in fair values of commodity derivatives 0 90 Realised commodity derivatives Other operating income Total NOTE 8 Other expenses EUR 1, Vessel insurances, repairs and maintenance costs Consulting and other external services Rents and maintenance costs Leases Travelling expenses and other voluntary personnel expenses IT costs Sales and marketing costs Impairment of trade receivables Realised commodity derivatives Other operating expenses Total AUDITOR S FEES Audit Tax services Other services Total KPMG Ab Oy share of the audit fees for year 2018: audit 102 thousand euro, tax services 17 thousand euro and other services 17 thousand euro. 24 CONTAINERSHIPS CONSOLIDATED FINANCIAL STATEMENTS 2018
25 NOTE 9 Materials and services EUR 1, Materials and supplies Purchases during reporting period Change in inventories Purchased services Total These costs are mainly related to vessel operation costs (hired crew, commissions, port, bunkering and chartering). In addition costs include maintenance and repair as well as transportation and warehousing costs. NOTE 10 Employee benefit expenses EUR 1, Salaries and wages Social security costs Pension costs defined contribution plans Government grants Other employee benefits Total Government grants relating to seaman salary and social costs are deferred and recognised in profit or loss on a systematic basis over the periods in which the entity recognises as expenses the related costs for which the grants are intended to compensate. There are no unfulfilled conditions or contingencies attached to these grants. AVERAGE GROUP PERSONNEL IN THE REPORTING PERIOD Office Other Total NUMBER OF EMPLOYEES ON 31 DECEMBER In both tables the number of part-time employees has been converted to full-time equivalent. Management s employee benefits are presented in Note 28 Related party transactions. NOTE 11 Depreciation, amortisation and impairment losses AMORTISATION AND DEPRECIATION BY ASSET CATEGORY EUR 1, INTANGIBLE ASSETS Other intangible assets Total PROPERTY, PLANT AND EQUIPMENT Buildings Vessels Containers Machinery and equipment Total Total depreciation and amortisation Impairment losses of EUR 2.3 million were made in intangible assets during the financial year There were no impairment losses in CONTAINERSHIPS CONSOLIDATED FINANCIAL STATEMENTS
26 NOTE 12 Finance income and costs RECOGNISED IN PROFIT OR LOSS EUR 1, FINANCE INCOME Interest income 0 0 Bank deposits Loans to ultimate parent company Accounts receivable 1 0 Foreign exchange gains Fair value changes of derivatives Foreign exchange forward contracts 0 0 Interest rate swaps Interest income finance leases Other finance income 0 13 Total FINANCE COSTS Interest expenses Loans and borrowings measured at amortised cost Foreign exchange losses Fair value changes of derivatives Foreign exchange derivative contracts Interest rate swaps 0 0 Other financial assets at fair value through profit or loss 0 0 Finance charges payable under finance leases Other finance costs Total Net finance costs Foreign exchange gains and losses arises on translation of trade receivables, trade payables and intercompany items in foreign currency as well as from the hedging of the foreign currency positions. Other financial expenses include bank charges, interest expenses and reorganization of loans. 26 CONTAINERSHIPS CONSOLIDATED FINANCIAL STATEMENTS 2018
27 NOTE 13 Income taxes AMOUNTS RECOGNISED IN PROFIT OR LOSS EUR 1, CURRENT TAX EXPENSE Current tax for the year Current tax adjustments for prior years Total DEFERRED TAX EXPENSE Changes in deferred tax assets Changes in deferred tax liabilities Total Total income tax expense RECONCILIATION OF TAX EXPENSES IN THE CONSOLIDATED INCOME STATEMENT AND TAXES CALCULATED USING FINNISH TAX RATES (20%) EUR 1, PROFIT BEFORE TAXES Tax calculated using Finnish tax rate (20 %) Effect of tax rates in foreign jurisdictions Non-taxable income Non-deductible expenses Adjustments for current tax of prior periods Other differences Income taxes in the statement of comprehensive income EFFECTIVE TAX RATE % -90,4 % 49,6 % AMOUNTS RECOGNISED IN OTHER COMPREHENSIVE INCOME EUR 1, FOREIGN CURRENCY TRANSLATION DIFFERENCES Before tax Tax effect 0 0 Net of tax CONTAINERSHIPS CONSOLIDATED FINANCIAL STATEMENTS
28 MOVEMENT IN DEFERRED TAX BALANCES 2018 EUR 1,000 BALANCE AT 1 JAN RECOGNISED THROUGH PROFIT OR LOSS RECOGNISED DIRECTLY IN EQUITY EXCHANGE RATE DIFFERENCES AND OTHER CHANGES BALANCE AT 31 DEC DEFERRED TAX ASSETS Property, plant and equipment Derivatives Loans and borrowings Provisions 3 3 Tax losses carried forward Deferred income Finance leases Other temporary differences Deferred tax assets total DEFERRED TAX LIABILITIES Property, plant and equipment Derivatives Loans and borrowings 0 0 Convertible notes Finance leases Other temporary differences Deferred tax liabilities total MOVEMENT IN DEFERRED TAX BALANCES 2017 EUR 1,000 BALANCE AT 1 JAN RECOGNISED THROUGH PROFIT OR LOSS RECOGNISED DIRECTLY IN EQUITY EXCHANGE RATE DIFFERENCES AND OTHER CHANGES BALANCE AT 31 DEC DEFERRED TAX ASSETS Property, plant and equipment Derivatives Loans and borrowings Provisions 3 3 Tax losses carried forward Deferred income Finance leases Other temporary differences Deferred tax assets total DEFERRED TAX LIABILITIES Property, plant and equipment Derivatives Loans and borrowings Convertible notes Finance leases Other temporary differences Deferred tax liabilities total CONTAINERSHIPS CONSOLIDATED FINANCIAL STATEMENTS 2018
29 RECOGNISED DEFERRED TAX ASSETS EUR 1, TAX LOSSES Tax losses DEFERRED TAX ASSET RECOGNISED ON THE BALANCE SHEET Tax losses The Group has recognised deferred tax assets of thousand (EUR thousand at 31 December 2017) relating to the parent company s unused tax losses carried forward. Management anticipates that the company will generate taxable income against which the losses can be utilized. In making the assessment management has taken into consideration investments in three new LNG vessels coming next two years. As a result of these investments the profitability of the company is expected to improve due to more efficient fleet and lower operating expenses. In addition, the parent company has the possibility, if necessary, to carry out sales arrangements related to the owned containers and other Containerships Plc assets. RECOGNISED TAX LOSSES CARRIED FORWARD EXPIRE AS FOLLOWS EXPIRY YEAR EUR 1, CONTAINERSHIPS CONSOLIDATED FINANCIAL STATEMENTS
30 NOTE 14 Property, plant and equipment PROPERTY, PLANT AND EQUIPMENT 2018 EUR 1,000 BUILDINGS CONTAINERS MACHINERY & EQUIPMENT VESSELS* UNDER CONSTRUCTION TOTAL COST 1 JAN Increases Disposals Reclassification -1-1 Exchange rate differences Cost 31 Dec ACCUMULATED DEPRECIATION AND IMPAIRMENT LOSSES 1 JAN Depreciation for the reporting period Accumulated depreciation on disposals Reclassification Exchange rate differences Accumulated depreciation and impairment losses 31 Dec Carrying amount 1 Jan Carrying amount 31 Dec *) The year-end 2018 carrying amount of Containerships VII ( 11.3 M) was tested for impairment. The recoverable amount (value in use) of the vessel was estimated to be higher than its carrying amount. Borrowing costs amounting to 2018 EUR thousand (2017 EUR thousand) were capitalized during the financial year regarding construction project of new LNG vessels. Total interest capitalised at the year-end 2018 was EUR thousand (2017 EUR thousand). The capitalisation rate used during 2018 was approximately 6,25% (2017 7,5%). PROPERTY, PLANT AND EQUIPMENT 2017 EUR 1,000 BUILDINGS CONTAINERS MACHINERY & EQUIPMENT VESSELS* UNDER CONSTRUCTION TOTAL COST 1 JAN Increases Disposals Reclassification Exchange rate differences Cost 31 Dec ACCUMULATED DEPRECIATION AND IMPAIRMENT LOSSES 1 JAN Depreciation for the reporting period Accumulated depreciation on disposals Reclassification Exchange rate differences Accumulated depreciation and impairment losses 31 Dec Carrying amount 1 Jan Carrying amount 31 Dec CONTAINERSHIPS CONSOLIDATED FINANCIAL STATEMENTS 2018
31 FINANCE LEASES Property, plant and equipment include assets acquired under finance leases as follows: EUR 1,000 CONTAINERS EUR 1,000 CONTAINERS Cost 1 Jan Increases 0 Disposals -263 Accumulated depreciation Exchange rate differences 0 Carrying amount 31 Dec Cost 1 Jan Increases 0 Disposals Accumulated depreciation Exchange rate differences 0 Carrying amount 31 Dec The Group leases containers under a number of finance lease agreements. Some leases provide the Group with the option to purchase the equipment at the end of the lease period. The Group has also entered into sale and leaseback transactions and the lease contracts have been classified as finance leases. CONTAINERSHIPS CONSOLIDATED FINANCIAL STATEMENTS
32 NOTE 15 Intangible assets RECONCILIATION OF CARRYING AMOUNT INTANGIBLE ASSETS 2018 EUR 1,000 GOODWILL OTHER INTANGIBLE ASSETS TOTAL ACQUISITION COST 1 JAN Increases Disposals Reclassification 0 Exchange rate differences Acquisition cost 31 Dec ACCUMULATED AMORTISATION AND IMPAIRMENT LOSSES 1 JAN Amortisation for the reporting period Impairments Exchange rate differences 0 Accumulated amortisation and impairment losses 31 Dec Carrying amount 1 Jan Carrying amount 31 Dec INTANGIBLE ASSETS 2017 EUR 1,000 GOODWILL OTHER INTANGIBLE ASSETS TOTAL ACQUISITION COST 1 JAN Increases Disposals Reclassification Exchange rate differences Acquisition cost 31 Dec ACCUMULATED AMORTISATION AND IMPAIRMENT LOSSES 1 JAN Amortisation for the reporting period Reclassification 0 0 Exchange rate differences 0 0 Accumulated amortisation and impairment losses 31 Dec Carrying amount 1 Jan Carrying amount 31 Dec Other intangible assets include development costs of the following IT-systems: Vessel Fleet Management, Quoting and Pricing, Sales Order Management, Business Intelligence, Container Fleet Management and Transport Management system. The costs meeting the criteria for development costs are capitalized and amortised over five years. 32 CONTAINERSHIPS CONSOLIDATED FINANCIAL STATEMENTS 2018
33 Impairment test IMPAIRMENT TESTING FOR CGUS CONTAINING GOODWILL The Group performs its annual impairment tests for goodwill during last quarter of the financial period. For the purposes of impairment testing, goodwill has been allocated to the Group s CGUs, which are also the Group s operating and reportable segments, as follows: EUR 1,000 NOTES CSL Baltics CSL MED Total Goodwill increase arises from translation differences. CSL BALTICS The recoverable amount of the CGU was based on its value in use, determined by discounting the future cash flows to be generated from the continuing use of the CGU and also future cash flows of four new LNG vessels of CGU. The carrying amount of the CGU was determined to be EUR million (2017: EUR million) lower than its recoverable amount. The key assumptions used in the estimation of the recoverable amount are set out below. IN PERCENT Sales volume (annual average growth rate of next five years) 7,8 9,5 Budgeted EBITDA (average growth rate of next five years) 10,4 11 Terminal value growth rate 2,0 2,0 Pre-tax discount rate (WACC) 8,1 8,1 Management has assessed that no reasonably possible change in the key assumptions would cause the carrying amount to exceed the recoverable amount. The following table shows the amount by which these assumptions would need to change individually for the estimated recoverable amount to be equal to the carrying amount. IN PERCENTAGE POINTS Budgeted EBITDA (average of next five years) -4,5-6,1 Terminal value growth rate Discount rate (WACC) 10 15,1 CONTAINERSHIPS CONSOLIDATED FINANCIAL STATEMENTS
34 CSL MED The recoverable amount of the CGU was based on its value in use, determined by discounting the future cash flows to be generated from the continuing use of the CGU. The carrying amount of the CGU was determined to be EUR 4.7 million (2017: EUR 4.8 million) lower than its recoverable amount. IN PERCENT Sales volume (annual average growth rate of next five years) 6,4 5,2 Budgeted EBITDA (average growth rate of next five years) 6,1 4,6 Terminal value growth rate 2,0 2,0 Pre-tax discount rate (WACC) 16,6 18,2 Management has identified that a reasonably possible change in key assumptions will not cause the carrying amount to exceed the recoverable amount. The following table shows the amount by which these assumptions would need to change individually for the estimated recoverable amount to be equal to the carrying amount. IN PERCENTAGE POINTS Budgeted EBITDA (average of next five years) -3,5-3,0 Terminal value growth rate Discount rate (WACC) 8,0 7,3 KEY ASSUMPTIONS USED IN IMPAIRMENT TESTING (CSL BALTICS AND CSL MED) Management have considered and reasonably assessed possible changes for other key assumptions and have not identified any instances that could cause the carrying amount of the CGU to exceed its recoverable amount. APPROACH USED TO DETERMINING VALUES ASSUMPTION Turnover APPROACH FOR VALUE DETERMINATION Average annual growth rate over the five-year forecast period; based on past performance and management s expectations of market development. Budgeted EBITDA Budgeted EBITDA growth rate over the five-year forecast period; Based on past performance and management s expectations for the future. Growth is projected taking into account the average growth levels experienced over the past five years and the estimated growth for the next five years. Terminal value growth rate Terminal value growth rate is a growth rate used to extrapolate cash flows beyond the budget period. Five years of cash flows were included in the discounted cash flow model. Terminal value growth rate into perpetuity has been assumed to be equal 2.0%, estimated by management. Pre-tax discount rate The discount rate is a pre-tax measure iterated based on the weighted average cost of capital (WACC), which reflects the risks of the predicted cash flows. WACC reflects risk of the specific CGU including capital structure and beta of the industry, average market risk premium, risk-free rate, required return on debt and small company risk premium. 34 CONTAINERSHIPS CONSOLIDATED FINANCIAL STATEMENTS 2018
35 NOTE 16 Inventories EUR 1, Raw materials and supplies 5 4 Bunker Total The Group s inventories mainly consist of bunker. Inventories also include truck spare parts. No write-downs of the inventories were recognised during the reporting periods. CONTAINERSHIPS CONSOLIDATED FINANCIAL STATEMENTS
36 NOTE 17 Other financial assets FINANCIAL ASSETS AT FAIR VALUE THROUGH PROFIT OR LOSS EUR 1, Derivatives - hedge accounting not applied Foreign exchange derivative contracts 0 Interest rate swaps 0 0 Commodity forward contracts Other investments 0 2 Total Current Non-current 2 2 The Group s other financial assets include derivatives and investments in equity shares. These financial assets are measured at fair value through profit or loss and classified as held for trading. Other financial assets measured at fair value through profit or loss include derivatives not designated as hedging instruments and reflect the positive change in fair value of foreign exchange forward contracts, commodity forwards contracts and interest rate swaps that are not designated in hedge relationships, but are, nevertheless, intended to reduce the level of foreign currency and interest rate risk and risk for price the changes of expected oil purchases. Fair values of these derivative instruments are determined by reference to published price quotations in an active market. Other financial assets also include investments in equity shares. These instruments are classified as held for trading and are measured at fair value. Fair values of quoted equity shares are determined by published price quotations in an active market. Investments in equity instruments that do not have a quoted price in an active market and whose fair value cannot be reliably measured, are measured at cost or a lower probable market price. More detailed information regarding fair value measurement is presented in the note CONTAINERSHIPS CONSOLIDATED FINANCIAL STATEMENTS 2018
37 NOTE 18 Trade and other receivables EUR 1, Trade receivables Trade receivables from related parties Loans to parent company Loan receivables Finance lease receivables Other receivables Total Non-current Current SPECIFICATION FOR OTHER RECEIVABLES, PREPAYMENTS AND ACCRUALS EUR 1, Current tax assets Prepayments Finnish transport agency Container rent accruals Rents Insurance Escrow accounts *) Employee benefits Port expenses, cargo handling and other voyage-related costs VAT accrued receivables Other accruals Total TRADE RECEIVABLES BY CURRENCY EUR 1, EUR GBP USD RUB DZD UAH TRY 13 9 Other 0 0 Total The book values of trade and other receivables are reasonable approximation of their fair values. The maximum credit risk related to accounts receivable and other receivables is their carrying amount. *) Cash in escrow accounts is Algerian s non-liquid cash in 2018 and CONTAINERSHIPS CONSOLIDATED FINANCIAL STATEMENTS
38 AS AT 31 DECEMBER, AGEING ANALYSIS OF TRADE RECEIVABLES AND ITEMS RECOGNISED AS IMPAIRMENT LOSSES ARE AS FOLLOWS: EUR 1, IMPAIRMENT LOSSES NET 2018 Not past due Past due 1-30 days days days days Over 180 days Total past due Total EUR 1, IMPAIRMENT LOSSES NET 2017 Not past due Past due 1-30 days days days days Over 180 days Total past due Total Information about the Group s exposure to credit and market risks, and information how the Group manages and measures the credit quality of trade receivables is included in note 25. The Group s trade receivables include an impairment loss of EUR thousand in 2018 (2017 EUR 312 thousand). According to internal accounting policy 50% of trade receivables past due over 180 days and 100% past due over 360 days are written down, unless there is a justified reason not to recognise impairment loss. The impact of adoption of IFRS 9 standard on credit losses is approximately EUR 200 thousand. The exception of this rule has been made with the receivables from the two agents of the Turkish company. Major part of the receivables overdue more than 180 days are from the Algerian and Libyan agents. The company has replaced the Algerian agent with its own agency operations in Algeria in August To support the receivables collection from the former Algerian agent company has started settlement case with the agent according to agency agreement. The book value of a former Algerian agent s receivables is consistent with the company s management s perception and the third party s legal view and the company believes it will receive most of the claim through legal action. The amount of impairment that differs from the internal operating model is approximately EUR 1.7 million. This is not written down, because company has received a deposit from the agent in local Libyan bank in local currency. This bank account is in the company s control based on the agreement made between the agent and company. This deposit covers most of the overdue balance, but naturally has a risk of a local Libyan currency. The other exception is that company has also older receivables from the Libyan agent. The amount of impairment that differs from the internal operating model is approximately EUR 2.5 million. This is due to unstable political and currency situation in Libya. There are signs for the economic and political recovery in Libya, which should lower this risk during 2019 and stabilize the situation with the overdue balances. Receivables from a Tunisian agent are mainly due to the business between the agent and the principal, and the local guarantee covers part of the outstanding claim. 38 CONTAINERSHIPS CONSOLIDATED FINANCIAL STATEMENTS 2018
39 FINANCE LEASE RECEIVABLES EUR 1, TOTAL AMOUNT OF MINIMUM LEASE PAYMENTS Within 12 months years After five years 0 0 Total PRESENT VALUE OF MINIMUM LEASE PAYMENTS Within 12 months years After five years 0 0 Total FUTURE INTEREST INCOME FROM FINANCE LEASE AGREEMENTS Finance income Total NOTE 19 Cash and cash equivalents EUR 1, Cash and bank accounts Cash and cash equivalents in the balance sheet At 31 December 2018, the Group did not have any undrawn committed loan facilities in use. Cash and cash equivalents match with the consolidated statement of cash flows. CONTAINERSHIPS CONSOLIDATED FINANCIAL STATEMENTS
40 NOTE 20 Capital and reserves EUR 1,000 NUMBER OF SHARES 1,000 PCS. SHARE CAPITAL SHARE PREMIUM FUND FOR INVESTED NON-RESTRICTED EQUITY TOTAL 1 January December January December SHARE CAPITAL The share capital (ordinary shares) consists of shares in two series (A and B). The ordinary shares do not have any nominal value, A-shares carry one vote and 10 B-shares carry one vote. All issued shares have been fully paid. The Group companies do not hold any own shares. The subscription price of a share received in connection with share issues is credited to the share capital, unless it is provided in the share issue decision, that a part of the subscription price is to be recorded in the fund for unrestricted free equity. DIVIDENDS The Board of Directors proposes that no dividend will be distributed and that the loss of 31 December 2018 will be transferred to the retained earnings in the balance sheet. No dividends were paid during financial years 2018 and 2017 SHARE PREMIUM Share premium account generated during the former Finnish Companies Act. FUND FOR INVESTED NON-RESTRICTED EQUITY The fund for invested non-restricted equity includes other equity investments and the part of the subscription price of the shares that according to the related decision is not to be credited to the share capital. TRANSLATION RESERVE The translation reserve comprises of all foreign exchange differences arising from the translation of the financial statements of foreign operations. CONVERTIBLE CAPITAL LOAN The subordinated loan is linked to the company s shares. The equity component of the subordinated loan has been recognized as accrued earnings. HYBRID CAPITAL LOAN Hybrid capital loan is recognised in equity as a separate item. The loan have no maturity date but the company has the right to repay the loan at the moment bond is expiring. The loan and the interest are subordinated to all other liabilities of the company. The annual coupon rate until the first possible redemption date of the loan is 8%. If interest is paid to the hybrid capital loan it is recognised directly in retained earnings and unpaid interest is accrued. Loan capitalised interests are 470 thousand euro for Group s equity includes one hybrid capital loan with nominal value of EUR thousand. The loan from related party was initially issued in 2015 and presented as a convertible capital loan in non-current liabilities in 2015 financial statements. Due to amendments in the terms of the contract in 2016 the loan is reclassified from non-current liabilities to equity. Accumulated interest for the loan is 921 thousand euro for the period CONTAINERSHIPS CONSOLIDATED FINANCIAL STATEMENTS 2018
41 NOTE 21 Classification of financial assets and liabilities 31 DECEMBER 2018 CARRYING AMOUNT FAIR VALUE EUR 1,000 NOTE FINANCIAL ASSETS AND LIABILITIES AT FAIR VALUE THROUGH PROFIT OR LOSS LOANS AND OTHER RE- CEIVABLES VALUED AT ACQUISITION COST OTHER FINANCIAL LIABILITIES VALUED AT ACQUISITION COST TOTAL LEVEL 1 LEVEL 2 LEVEL 3 TOTAL FINANCIAL ASSETS MEASURED AT FAIR VALUE Foreign exchange derivative contracts Commodity forward contracts Equity securities Total FINANCIAL ASSETS NOT MEASURED AT FAIR VALUE Trade and other receivables Loans to the ultimate parent company Cash and cash equivalents Total FINANCIAL LIABILITIES MEASURED AT FAIR VALUE Foreign exchange derivative contracts Interest rate swaps Commodity forward contracts Total FINANCIAL LIABILITIES NOT MEASURED AT FAIR VALUE Bond issue Convertible capital loan - liability component Finance lease liabilities Trade payables Total DECEMBER 2017 FINANCIAL ASSETS MEASURED AT FAIR VALUE Foreign exchange derivative contracts Commodity forward contracts Equity securities Total FINANCIAL ASSETS NOT MEASURED AT FAIR VALUE Trade and other receivables Loans to the ultimate parent company Cash and cash equivalents Total FINANCIAL LIABILITIES MEASURED AT FAIR VALUE Foreign exchange derivative contracts Interest rate swaps Commodity forward contracts Total FINANCIAL LIABILITIES NOT MEASURED AT FAIR VALUE Bond issue Convertible capital loan - liability component Finance lease liabilities Trade payables Total CONTAINERSHIPS CONSOLIDATED FINANCIAL STATEMENTS
42 ACCOUNTING CLASSIFICATIONS AND FAIR VALUES The table on the previous page shows the carrying amounts and fair values of financial assets and financial liabilities, including their levels in the fair value hierarchy. It does not include fair value information for financial assets and financial liabilities not measured at fair value if the carrying amount is a reasonable approximation of fair value. MEASUREMENT OF FAIR VALUES Fair value of financial asset and liabilities is the price that would be received to sell an asset or paid to transfer a liability in an orderly transaction between market participants at the measurement date. The management assessed that the fair values of cash and cash equivalents, trade receivables, trade payables, bank overdrafts, finance lease liabilities and other liabilities approximate their carrying amounts due to the short-term maturities of these instruments. LEVEL DEFINITIONS Level 1 = quoted prices (unadjusted) in active markets for identical assets or liabilities Level 2 = other than quoted prices included within Level 1 that are observable for the asset or liability, either directly (i.e. as prices) or indirectly (i.e. derived from prices) Level 3 = not based on observable market data TRANSFERS BETWEEN LEVELS There were no transfers between fair value hiearchy levels in 2018 and LEVEL 3 FAIR VALUES Reconciliation of Level 3 fair values FINANCIAL INSTRUMENTS MEASURED AT FAIR VALUE Derivative instruments Market comparison technique: The fair values are based on broker quotes. Similar contracts are traded in an active market and the quotes reflect the actual transactions in similar instruments. Publicly traded equity securities The fair values of publicly quoted instruments are based on price quotations at the reporting date. Private equity investments Investments in equity instruments that do not have a quoted price in an active market and whose fair value cannot be reliably measured, are measured at cost or a lower probable market price. Financial instruments not measured at fair value Discounted cash flows: The valuation model considers the present value of expected payments, discounted using a riskadjusted discount rate. 42 CONTAINERSHIPS CONSOLIDATED FINANCIAL STATEMENTS 2018
43 NOTE 22 Interest-bearing loans and borrowings This note provides information about the contractual terms of the Group s interest-bearing loans and borrowings, which are measured at amortised cost. For more information about the Group s exposure to interest rate, currency and liquidity risks, see note 25. TERMS AND REPAYMENT SCHEDULE EUR 1,000 INTEREST RATE % MATURITY NON-CURRENT LIABILITIES MEASURED AT AMORTISED COST CARRYING AMOUNT 2018 CARRYING AMOUNT 2017 Convertible capital loans 8,00 30/04/ Bond issue 6,25 + 3M Euribor 22/11/ Finance lease liabilities Other liabilities Total CURRENT LIABILITIES MEASURED AT AMORTISED COST Convertible notes 8,00 30/04/ Finance lease liabilities Other liabilities Total Interest bearing loans and borrowings total The interest rates of the group s interest-bearing loans are both fixed and variable rates. The variable rate loans are mainly derived from Euribor 3 months. The weighted average interest is 6,4% (2017: 6,4%). Information about the Group s exposure to interest rate, currency and liquidity risk is included in the note 25. BOND ISSUE Secured bond has nominal value EUR thousand and is repayable in full on Secured EUR thousand bond was raised in November The interest rate is 6,25% plus Euribor 3 month. CONVERTIBLE CAPITAL LOAN Convertible capital loan with nominal value EUR thousand, interest rate is 8% accrueing from the issue date until, and be payable at, the time of repayment of the convertible capital loan. HYBRID CAPITAL LOAN The other loan previously presented as a convertible capital loan was converted to a hybrid capital loan at whit a nominal value of EUR thousand.the hybrid capital loan has an interest rate of 8% accrueing from the issue date until, and be payable at, the time of repayment of the hybrid capital loan. Loan capitalised interests are 921 thousand euro for the period The Hybrid capital loan and the Interests are subordinated to all other debts in the liquidation and bankruptcy of the company. If the Investors have not chosen to exercise its right to subscribe for shares, the hybrid capital loan shall not be repaid, but the interest level will increase from after the bond has been refinanced or latest by April 30, 2019, according to the agreement. The Convertible capital loan and the Interests are subordinated to all other debts in the liquidation and bankruptcy of the company. If the Investors have not chosen to exercise its right to subscribe for shares, the convertible capital loan shall be repaid together with interest on April 30, CONTAINERSHIPS CONSOLIDATED FINANCIAL STATEMENTS
44 CONVERTIBLE CAPITAL LOAN EUR 1, Carrying amount of liability at 1 January Proceeds from issue of convertible capital loan 0 0 Transaction costs 0 0 Net proceeds Amount classified as equity 0 0 Reclassification - hybrid capital loan 0 0 Accrued interest Carrying amount of liability at 31 December FINANCE LEASE LIABILITIES EUR 1, TOTAL AMOUNT OF MINIMUM LEASE PAYMENTS Within 12 months years After five years Total PRESENT VALUE OF MINIMUM LEASE PAYMENTS Within 12 months years After five years Total FUTURE INTEREST EXPENSES FROM FINANCE LEASE AGREEMENTS Finance costs Total CHANGE IN INTEREST BEARING LOANS AND BORROWINGS EUR 1, CASH FLOWS NO CASH FLOW CHANGES Long-term interest bearing loans and borrowings Short-term interest bearing loans and borrowings Total CONTAINERSHIPS CONSOLIDATED FINANCIAL STATEMENTS 2018
45 NOTE 23 Other financial liabilities FINANCIAL LIABILITIES AT FAIR VALUE THROUGH PROFIT OR LOSS EUR 1, DERIVATIVES - HEDGE ACCOUNTING NOT APPLIED Foreign exchange derivative contracts Interest rate swaps Commodity forward contracts Total Current Non-current The Group s other financial liabilities include derivative instruments and these financial instruments are measured at fair value through profit or loss. Derivatives not designated as hedging instruments reflect the negative change in fair value of foreign exchange forward contracts, commodity forwards contracts and interest rate swaps that are not designated in hedge relationships, but are, nevertheless, intended to reduce the level of currency and interest rate risk and risk for the price changes of expected oil purchases. Fair values of these derivative instruments are determined by reference to published price quotations in an active market. More detailed information regarding fair value measurement is presented in note 21. CONTAINERSHIPS CONSOLIDATED FINANCIAL STATEMENTS
46 NOTE 24 Trade and other payables EUR 1, Trade payables Trade payables to related parties Deferred income Other payables Total Total current Total non-current The carrying amount of accounts payable and other liabilities is the reasonable approximation of their fair values. The tables below show the significant items in other payables and the distribution of accounts payable by currency. Maturity analysis of financial liabilities is presented in note 25. Information about the Group s exposure to currency and liquidity risks is included in note 25. SIGNIFICANT ITEMS IN OTHER PAYABLES EUR 1, Current tax liabilities Employee benefits Cargo handling costs 0 0 Port expenses and voyage-related costs Repairs, vessels Interest payable VAT accrued payable Long term Scrubber liability 0 0 EU-support payable to project partners Other accrued liabilities Total DISTRIBUTION OF TRADE PAYABLES BY CURRENCY EUR 1, EUR DKK GBP USD RUB UAH TRY DZD Other Total CONTAINERSHIPS CONSOLIDATED FINANCIAL STATEMENTS 2018
47 NOTE 25 Financial risk management THE PRINCIPLES AND ORGANISATION OF FINANCIAL RISK MANAGEMENT The Group s risk management policies are established to identify and analyse the risks faced by the Group, to set appropriate risk limits and controls, and to monitor risks and adherence to limits. Risk management policies and systems are reviewed regularly to reflect changes in market conditions and the Group s activities. The Group and its operating activities are subject to financial risks. The main financial risks are currency risk, interest rate risk, credit risk, liquidity risk and oil price risk. The financial risks related to the business are monitored by the company s management. The management of financial risks aims to reduce the volatility in earnings, balance sheet and cash flow, while securing effective and competitive financing for the Group. For risk management the Group may use currency forwards and options, interest rate swaps, oil derivatives and oil price clauses included in customer contracts. MARKET RISK Market risk is the risk that changes in market prices, such as foreign exchange rates, interest rates and equity investments will affect the Group s income or the value of its holdings of financial instruments. The objective of market risk management is to manage and control market risk exposures within acceptable parameters, while optimising the return. CURRENCY RISK The Group operates internationally and is therefore exposed to transaction risks through different currency positions. The main foreign currencies used by the Group are USD, GBP, RUB, DZD and TRY. Currency risks arise from commercial transactions, monetary items in the balance sheet and net investments in foreign subsidiaries. A possible strengthening or weakening of the USD, GBP, RUB, TRY, DZD and UAH against all other currencies at 31 December would have affected the measurement of financial instruments denominated in a foreign currency and affected equity and profit or loss by the amounts shown below in the sensitivity analyses. TRANSLATION RISK The Group has net investments abroad and is thus exposed to risks which arise when investments in RUB, DZD, PLN TRY, GBP and UAH are converted into the parent company s functional currency. The Group s principle is not to hedge net investments made in foreign subsidiaries. The tables below shows the translation position at the end of 2018 and TRANSLATION RISK EXPOSURE BY CURRENCY EUR 1,000 NET INVESTMENT 2018 NET INVESTMENT 2017 GBP RUB TRY UAH PLN DZD CONTAINERSHIPS CONSOLIDATED FINANCIAL STATEMENTS
48 SENSITIVITY ANALYSIS The following table describes the Group s sensitivity to changes in the GBP, RUB, TRY, UAH, DZD and PLN exchange rate. 31 DECEMBER 2018 CHANGE IN EQUITY EUR 1,000 STRENGTHENING WEAKENING GBP (10 % movement) RUB (20 % movement) TRY (20 % movement) UAH (20 % movement) PLN (10 % movement) -1 1 DZD (20 % movement) DECEMBER 2017 CHANGE IN EQUITY EUR 1,000 STRENGTHENING WEAKENING GBP (10 % movement) RUB (20 % movement) TRY (20 % movement) UAH (20 % movement) PLN (10 % movement) -2 2 DZD (20 % movement) Transaction risk In 2017, over 80 per cent of Baltic sales were invoiced in EUR, and the rest in RUB, GBP and USD. Purchases are mainly made in EUR, except for bunker purchases in USD. Local UK purchases are made in GBP, local Russian purchases are made in RUB. In MED, the main currencies for sales and purchases are USD, TRY and DZD. The functional currency for the Turkish company operations is TRY and for Algerian company DZD. TRANSACTION RISK EXPOSURE BY CURRENCY AT 31 DECEMBER 2018 IN THOUSANDS OF USD RUB TRY GBP Trade receivables Trade payables Net balance sheet exposure Next six months forecast sales Next six months forecast purchases Net forecast transaction exposure Forward exchange contracts Net exposure TRANSACTION RISK EXPOSURE BY CURRENCY AT 31 DECEMBER 2017 IN THOUSANDS OF USD RUB TRY GBP Trade receivables Trade payables Net balance sheet exposure Next six months forecast sales Next six months forecast purchases Net forecast transaction exposure Forward exchange contracts Net exposure CONTAINERSHIPS CONSOLIDATED FINANCIAL STATEMENTS 2018
49 SENSITIVITY ANALYSIS The following table describes the Group s sensitivity to changes in the exchange rates. The impacts of exchange rate changes of other currencies are not significant. 31 DECEMBER 2018 CHANGE IN PROFIT OR LOSS EUR 1,000 STRENGTHENING WEAKENING USD (10 % movement) RUB (20 % movement) TRY (20 % movement) GBP (10 % movement) DECEMBER 2017 CHANGE IN PROFIT OR LOSS EUR 1,000 STRENGTHENING WEAKENING USD (10 % movement) RUB (20 % movement) TRY (20 % movement) GBP (10 % movement) THE FOLLOWING SIGNIFICANT EXCHANGE RATES HAVE BEEN APPLIED AVERAGE RATE YEAR-END SPOT RATE EUR GBP 0,8847 0,8767 0, ,8872 RUB 74, , , ,392 USD 1,181 1,1297 1,145 1,1993 TRY 5,7077 4,1206 6,0588 4,5464 UAH 32,119 30,039 31,714 33,495 PLN 4,2615 4,257 4,3014 4,177 DZD 137,65 125,46 135,52 137,49 CONTAINERSHIPS CONSOLIDATED FINANCIAL STATEMENTS
50 Interest rate risk Interest-bearing debt exposes the Group to interest risk, i.e. re-pricing and price risk caused by interest rate movements. The objective of the interest rate risk management is to reduce interest rate fluctuation impact on the results in different accounting periods, enabling a more stable net income. The Group may manage interest rate risk by using interest rate swaps and interest rate forwards. The level of hedging against interest rate risks are reviewed regurlary against interest rate movements for hedging purposes. The following table shows the Group s sensitivity to variations in market interest rates. The following assumptions were made when calculating the sensitivity: The interest rate variation is assumed to be +/-0.50 per cent from the interest rate of individual instruments at the end of the reporting period. The analysis includes the instruments with an interest adjustment date within the following 12 months. The position includes variable-rate loans from financial institutions, convertible debts and commercial papers. The position excludes finance lease obligations, because the change in finance costs caused by the interest rate variation is not relevant to these. When calculating the sensitivity, it is assumed that the variable-rate debt portfolio remains unchanged for (no instalments, no new debt) and that the whole year interest rate changes as stated above on the next interest change date of the debt instrument. It is assumed that if a variable-rate instrument is fully amortised within the next 12 months, this instrument would be reacquired if the above mentioned interest rate is prevailing. EXPOSURE TO INTEREST RATE RISK The interest rate profile of the Group s interest-bearing financial instruments is as follows. NOMINAL AMOUNT EUR 1, FIXED-RATE INSTRUMENTS Financial liabilities VARIABLE-RATE INSTRUMENTS Financial liabilities Effect of interest rate swaps Net exposure CONTAINERSHIPS CONSOLIDATED FINANCIAL STATEMENTS 2018
51 FAIR VALUE SENSITIVITY ANALYSIS FOR FIXED-RATE INSTRUMENTS The Group does not account for any fixed-rate financial assets or financial liabilities at fair value through profit or loss, and the Group does not designate derivatives (interest rate swaps) as hedging instruments under a cash flow hedge accounting model. CASH FLOW SENSITIVITY ANALYSIS FOR VARIABLE-RATE INSTRUMENTS A change of +/- 0,5 per cent in interest rates at the reporting date would have increased or decreased profit or loss by the amounts shown below. This analysis assumes that all other variables remain constant. SENSITIVITY AT CLOSING DATE 2018, CHANGE IN INTEREST RATES, INCREASING / DECREASING 0.5% FROM VALID RATE OF THE INSTRUMENT AT 31 DEC 2017 CHANGE IN PROFIT OR LOSS EUR 1, ,5 % - 0,5 % Debt portfolio - net exposure Swaps - change in fair value Change before tax effect SENSITIVITY AT CLOSING DATE 2017, CHANGE IN INTEREST RATES, INCREASING /DECREASING 0.5 % FROM VALID RATE OF THE INSTRUMENT AT 31 DEC 2016 CHANGE IN PROFIT OR LOSS EUR 1, ,5 % - 0,5 % Debt portfolio - net exposure Swaps - change in fair value Change before tax effect CREDIT RISK Credit risk is the risk of financial loss to the Group if a customer or counterparty to a financial instrument fails to meet its contractual obligations, and arises principally from the Group s receivables from customers. The Group is exposed to credit risk from its commercial receivables. The Group policy sets out the credit rating requirements and investment principles related to customers, investment transactions and derivative contract counterparts. Apart from subsidiary in Turkey, the Group has no significant concentrations of credit risk, since it has a broad clientele distributed across various sectors. The Turkish operations have two major receivable with its agents in Algeria and Libya. The company has possible settlement case with its former Algerian agent, but does not expect any major write down on this. The receivable from the Libyan agent is covered with the local currency deposit, but it has some uncertainty based on the liquidity of the local currency. The Group makes derivative contracts and investment transactions only with counterparts with high credit ratings. The ageing analysis of trade receivables has been presented in note 18 Trade and other receivables. LIQUIDITY RISK Liquidity risk is the risk that the Group will encounter difficulty in meeting the obligations associated with its financial liabilities that are settled by delivering cash or another financial asset. The Group s approach to managing liquidity is to ensure, as far as possible, that it will always have sufficient liquidity to meet its liabilities when due, under both normal and stressed conditions, without incurring unacceptable losses or risking damage to the Group s reputation. The Group continuously strives to evaluate and monitor the amount of financing required for its operations to ensure that it will have sufficient liquid assets to finance its business activities and investments and to repay loans. The Group aims to guarantee the availability and flexibility of financing. At the end of the financial period 2017 loans do not include any financial covenants. More detailed information regarding the Groups restrictions on disposal of assets and restructurings is included in note 27 Commitments and contingencies. The cash-flows in the tables below include both repayments and expected interests. CONTAINERSHIPS CONSOLIDATED FINANCIAL STATEMENTS
52 MATURITY ANALYSIS OF FINANCIAL LIABILITIES 2018 EUR 1,000 CARRYING AMOUNT TOTAL 0-6 MONTHS 7-12 MONTHS NON-DERIVATIVE FINANCIAL LIABILITIES Bond issue Convertible capital loans Finance lease liabilities Trade and other payables DERIVATIVE FINANCIAL INSTRUMENTS Foreign exchange derivative contracts 0 0 Interest rate swaps Commodity forward contracts Total MATURITY ANALYSIS OF FINANCIAL LIABILITIES 2017 EUR 1,000 CARRYING AMOUNT TOTAL 0-6 MONTHS 7-12 MONTHS NON-DERIVATIVE FINANCIAL LIABILITIES Bond issue Convertible capital loans Finance lease liabilities Trade and other payables DERIVATIVE FINANCIAL INSTRUMENTS Foreign exchange derivative contracts Interest rate swaps Commodity forward contracts 0 0 Total COMMODITY RISK The Group is exposed to commodity risk relating to the availability and price fluctuations of oil. The Group seeks to minimise this risk by making framework agreements with known counterparts and by including bunker price clauses in its contracts with customers. In the long-term, these clauses can hedge more than 60 per cent of oil and currency risk. The hedging level of bunker oil fluctuates depending on the utilisation of the number of vessels. The rest of the risk is covered with oil hedging derivatives to reduce the open position not covered by the bunker price clauses agreements with the customers. However, oil price movements has a significant meaning for the company s financial result. Hedging covers that risk only partly. In 2018, The Group purchased bunker oil 73,5 ktons in Baltics and 14,6 ktons in MED. In the end of 2018 the group engaged in the oil price hedge that final installments due in June CONTAINERSHIPS CONSOLIDATED FINANCIAL STATEMENTS 2018
53 SENSITIVITY OF THE GROUP S PRE-TAX PROFIT ARISING FROM FINANCIAL INSTRUMENTS TO CHANGES IN THE PRICE OF OIL: EUR 1, CHANGE IN PROFIT OR LOSS 2017 CHANGE IN PROFIT OR LOSS +/- 10 % change in oil price -3,677 3,677-2,437 2,437 CAPITAL MANAGEMENT The Group s objective in managing capital is to secure normal operating conditions in all circumstances and to enable optimal capital costs. The table below shows the interest-bearing net liabilities and total equity with the leverage ratio. CAPITAL RISK MANAGEMENT EUR 1, Interest bearing liabilities Cash and cash equivalents *) Net liabilities Total equity Net gearing % *) Cash and cash equivalents does not include Escrow accounts EUR 582 thousand (2017: EUR 574 thousand). Escrow accounts are presented in the current other receivables. NOTE 26 Operating leases The adjusted interest-bearing net debt of EUR 56.2 million mentioned in the Board of Directors report has been calculated by deducting from interest bearing debt of of EUR 93.7 million EUR 27.3 million of financial leasing related to LNG vessels and EUR 10.2 million in cash and cash equivalents. THE GROUP AS A LESSEE EUR 1, MINIMUM LEASE PAYMENTS ON NON-CANCELLABLE OPERATING LEASES ARE PAYABLE AS FOLLOWS: Within 12 months years After five years Total AMOUNTS RECOGNISED IN PROFIT OR LOSS Lease expense Total The Group leases a number of office facilities and one land premise under operating leases. The Group has also entered into operating leases on certain office supplies, IT machinery, trucks and cars with lease terms mostly between three and five years. The Group has an option, under some of its leases, to lease the assets for additional terms of three to five years. CONTAINERSHIPS CONSOLIDATED FINANCIAL STATEMENTS
54 NOTE 27 Commitments and contingencies COLLATERALS EUR 1, COLLATERALS FOR OWN COMMITMENTS Pledges 0 0 Customs' guarantee Vessel mortgage Company mortgage Corporate mortgages Total COMMITMENTS At 31 December 2018, the Group had commitments of EUR 155 thousand (2017 EUR 156 thousand) mainly relating to the completion of the bond issue to finance the new vessel investments and secure daily operations. Company has a general pledge of EUR thousand with the financial institution for the financing of the working capital. Company has a pledge of EUR 79 thousand with the financial institution for the rented real estate premises. During 2017 company has obtained a bond financing, details provided in note 22. The bond financing is secured with all the assets of the company as follows: (a) a first ranking pledge over all of the shares currently issued by the Issuer, provided that any shares issued as a result of a conversion of the Equity Contribution are not required to be pledged by the Equity Investors (b) a floating charge over the assets in the Issuer in the amount of EUR thousand with priority after the EUR thousand floating charge provided to Nordea Bank Finland plc (c) a first priority mortgage in the amount of EUR thousand over the Existing Vessel (d) the Vessel Funding Account Pledge Agreement; (e) the Container Funding Account Pledge Agreement; These funding accounts have currently a balance of EUR 203 thousand in Container Funding Account. During 2016 the Group entered into a construction and sale & leaseback contract regarding four new LNG vessels. These vessels are being built for the Group and one vessel has been delivered during 2018 and other three are in construction phase that is scheduled for compeltion during Lease period begins after the completion of construction project, upon delivery of the vessels and execution of sale & leaseback transaction. Lease period is 12 years and the Group has obligation to purchase the vessels for fixed price at the latest 12 years from the commencement of lease period. The total undiscounted lease commitment for four LNG vessels is approximately EUR thousand including the purchase obligations. These amounts are not included in the table above at the end of the financial period LEGAL PROCEEDINGS The Group has no material pending legal cases at the end of the year The Group profit is not affected by any major non-recurring legal expense. Company has a settlement case with the former Algerian agency company relating to open receivables from the agent. The company has represented claims to these and other actions related to closing the co-operation with the agent. These claims are totaling to about 1,8 million euro. Leasing commitments are presented in note CONTAINERSHIPS CONSOLIDATED FINANCIAL STATEMENTS 2018
55 NOTE 28 Related party disclosures Group s related parties were the parent company Container Finance Ltd Oy and its subsidiaries and related companies,such as Positen Oy, until 31 October Container Finance Ltd Oy was jointly owned by Karita, Harri and Kimmo Nordström. As of 1 November 2018 Groups related parties are the Group s parent company, CMA CGM S.A. with its subsidiaries and Container Finance Ltd Oy including it s associated companies. CMA CGM S.A. ownership is divided into: Merit Corporation SAL (70%), Yildirim Asset Management Holding B.V. and BPIFrance Participations (6%). List of subsidiaries see note 5. In addition the related parties include key management personnel of the Containerhips Group comprising the Board of Directors, the CEO and the members of the Containerships Group Management team including their family members. TRANSACTIONS AND OUTSTANDING BALANCES WITH RELATED PARTIES EUR 1, Rendering of services and other income Purchases from related parties Interest income Interest expense 0 0 Receivables Liabilities Loans from previous related parties Loans to related parties Sales and purchases from related parties are made on terms equivalent to those that prevail in arm s lenght transactions. LOANS FROM / TO RELATED PARTIES During 2015 the parent company has received a convertible capital loan of EUR thousand from related party company of the ultimate parent company. In 2016 the terms of the loan was amended and the loan was reclassified as hybrid capital loan. More detailed information in Note 20 and 22. The parent company has granted a loan to the ultimate parent company of EUR thousand Terms: Interest: 3 months Euribor (minimum 0%) plus 7,5%. Interest paid quartely. Maturity: April 2, The Borrower is entitled to prepay the loan prematurely either in installments or in one payment anytime. The Hybrid capital loan and the Interests are subordinated to all other debts in the liquidation and bankruptcy of the company. CONTAINERSHIPS CONSOLIDATED FINANCIAL STATEMENTS
56 EMPLOYEE BENEFITS OF THE KEY MANAGEMENT PERSONNEL EUR 1, Salaries and other short-term benefits Total The amounts disclosed in the table are the amounts recognised as an expense during the reporting period related to key management personnel. Containerships Group s key management personnel consists of the members of the parent company s Board of Directors including CEO and the Group Management team. Compensation of the Group s key management personnel includes salaries, non-cash benefits and contributions to a post-employment defined contribution plan. The Company s management has no defined benefit plans or share-based incentive programs. COMPENSATION TO THE BOARD OF DIRECTORS AND CEO RECOGNISED AS EXPENSE BY PERSON AS FOLLOWS: EUR 1, CEO Board of Directors: Chairman 0 20 Board member A 0 20 Board member B 0 20 Total NOTE 29 Events after the reporting period The combination agreement between Container Finance Ltd Oy and CMA CGM was closed on Upon closing the agreement, Containerships plc, will integrate CMA CGM s intra-regional market offering in Europe and Mediterranean area. As result, bondholders could require the repurchase of the Bonds they held as provided in the terms and conditions of the Bonds. The deadline for bondholders to require the repurchase of their Bonds was January 4, By the deadline, Containerships plc received Bonds representing an aggregate nominal principal amount of 11.4 million, which represents approximately 19 per cent of the aggregate nominal principal amount of all the Bonds. Containerships plc paid, on the repurchase date of February 1, 2019, in accordance with the terms of the Bonds upon a Change of Control Put option, 101 per cent of the nominal amount of the Bonds to be repurchased, together with the accrued and unpaid interest. 56 CONTAINERSHIPS CONSOLIDATED FINANCIAL STATEMENTS 2018
57 CONTAINERSHIPS PLC INCOME STATEMENT 2018 Business identifi cation code: Domicile: Espoo CONTAINERSHIPS CONSOLIDATED FINANCIAL STATEMENTS
58 CONTAINERSHIPS PLC Income statement (FAS) EUR NOTE NET SALES Other operating income Material and service expenses Personnel benefit expenses Depreciation, amortisation and reduction in value Other operating expenses Operating profit (loss) Financial income Financial expenses PROFIT (LOSS) BEFORE APPROPRIATIONS AND TAXES Income taxes Other taxes 0 0 Profit (loss) for the financial year CONTAINERSHIPS CONSOLIDATED FINANCIAL STATEMENTS 2018
59 CONTAINERSHIPS PLC Balance sheet (FAS) ASSETS, EUR NOTE 31 DEC DEC 2017 NON-CURRENT ASSETS Intangible assets Tangible assets Investments 12 Shares and similar rights of ownership in Group companies Other shares and similar rights of ownership Total non-current assets CURRENT ASSETS Inventories Long-term receivables Short-term receivables in Group companies Short-term receivables Cash and cash equivalents Total current assets TOTAL ASSETS Balance sheet EQUITY AND LIABILITIES, EUR NOTE 31 DEC DEC 2017 EQUITY 17 Share capital Premium fund Fund for invested unrestricted equity Retained earnings Profit (loss) for the financial year Hybrid Capital Loan Total Equity LIABILITIES Long-term liabilities 17 Convertible Capital Loans Bonds Other long-term debt Short-term liabilities 18 Convertible Capital Loans Short-term liabilities to Group companies Short-term liabilities Total liabilities TOTAL EQUITY AND LIABILITIES CONTAINERSHIPS CONSOLIDATED FINANCIAL STATEMENTS
60 CONTAINERSHIPS PLC Cash flow statement (FAS) EUR CASH FLOW FROM OPERATING ACTIVITIES Profit (loss) before appropriations and taxes Adjustments Financial income and expenses Depreciation, amortisation and impairment losses Profit/loss on sale of tangible non-current assets Other adjustments Change in working capital Change in trade and other receivables Change in inventories Change in non-interest bearing current liabilities Interest received Net cash generated from operating activites (A) CASH FLOW FROM INVESTING ACTIVITIES Investments in tangible and intangible non-current assets Investments in subsidiaries and other shares Sales gains from non-current and current assets Net cash flow from investing activities (B) CASH FLOW FROM FINANCING ACTIVITES Borrowings and repayments of long-term debt (net) Change in Other receivables (Escrow-accounts) Paid interests and financial costs Net cash flow of financing activites (C) EXCHANGE DIFFERENCE FROM THE BANK ACCOUNTS Net change in cash and cash equivalents during the financial year ( A+B+C) Cash and cash equivalents on Cash and cash equivalents on CONTAINERSHIPS CONSOLIDATED FINANCIAL STATEMENTS 2018
61 CONTAINERSHIPS PLC NOTES TO THE FINANCIAL STATEMENT NOTES CONCERNING THE PREPARATION OF THE CONSOLIDATED FINANCIAL STATEMENTS The financial statements are prepared in accordance Finnish Accounting Principles (FAS). The accounts are to be presented in euro and are prepared with the going concern principle. REVENUES Revenues comprise sales income, exluding discounts and indirect taxes such as VAT. REVENUE RECOGNITION The company revenue is mainly generated through sales of service. All operative revenues and costs have been recognized according voyage principle meaning that all partial deliveries in door to door delivery chain has been recognized to certain voyage and month. Individual voyages e.g. in month end having sailing in two calendar month have been booked to one specified month. OTHER OPERATING INCOME Other operating income includes gain on the sale of fixed assets. FOREIGN CURRENCY TRANSACTIONS The debts and the receivables in foreign currency are translated in euros using the exchange rate at the closing date. Currency fluctuations related to sales, purchases, accounts receivables, accounts payables and financing are recognised as financial items. DERIVATE CONTRACTS The realized gain and loss of derivate contracts used for controlling the currency risks, such as currency swaps, are recogniced as financial items. The interest income and expenses of the derivates used for controlling the interest risk are booked on quarterly basis according to the settlement schedule defined in the derivative agreement. OIL HEDGING Company is exposed to oil s price- and availability risk. This risk is minimised by operating with wellknown partners and making derivate contracts. Realized gains and losses are included into materials and services. INTANGIBLE AND TANGIBLE ASSETS Intangible and tangible assets are measured using the historical acquistion cost less accumulated amortizations and depreciations according to plan. The amortization according to plan of intangible and depreciation according to plan of tangible assets have been calculated as straight-line depreciation based on the useful lives of the assets. In the depreciation plan of the vessel the scrap value is recognised. Write-off periods: Intangible assets Buildings Machinery and equipments Ship Other long-term expenditures 5 years years 3 10 years 25 years 3 5 years Other intangible assets include development costs of the following IT-systems: Vessel Fleet Management, Quoting and Pricing, Sales Order Management, Business Intelligence, Container Fleet Management and Transport Management system. The costs meeting the criteria for development costs are capitalized and amortised over five years. INVENTORIES Vessel stocks of fuel and lubricating oil are recogniced as inventories. The inventories are stated using according to FIFO, at the acquisition cost or at lower replacement value or the net realisable value. CASH AND CASH EQUIVALENTS Cash and cash equivalents consists of cash and bank accounts. LEASE LIABILITIES Leasing payments are recognised as expenses regardless of the form of leasing. IMPAIRMENT OF TRADE RECEIVABLES According to internal accounting policy 50% of the overdues over overdues over 180 days and 100% over 360 days to be classified as impairment loss, unless there is a confirmed reason to adjust this amount. STATUTORY PROVISIONS Future expenses and losses that no longer generate corresponding revenues in the foreseeable future, which the company is committed or obliged to settle and whose monetary value can be reasonably be assessed are recognised as expenses in the profit and loss account and recognised as provisions in the balance sheet. INCOME TAXES The income taxes are composed of the accrued taxes based on to taxable profit. They contain also adjustments of the income tax on previous years. DEFERRED TAX The Group has recognised deferred tax assets of thousand (EUR 6724 thousand at 31 December 2017) to the parent company s unused tax losses carried forward. Management anticipates that the company will taxable income against which the losses can be utilized. In making the assessment management has taken into consideration investments in six new LNG vessels in coming year. As a result of these investments the profitability of the company is expected to improve due to the more efficient fleet and lower operating expenses. In addition, the company has the opportunity to sell its own containers and thus utilize deferred tax assets. CONTAINERSHIPS CONSOLIDATED FINANCIAL STATEMENTS
62 CONTAINERSHIPS PLC Notes to the income statement EUR NET SALES Segment information Sea transportation / Freights Haulage Stevedoring and terminal operations Other Total Turnover by geographical area Finland and EU Russia Total OTHER OPERATING INCOME Sales gain on sold of current assets MATERIAL AND SUPPLIES Purchases in the financial year Change in inventories Total PURCHASED SERVICES Total PERSONNEL BENEFIT EXPENSES Wages and salaries , Pension expenses , Other personnel costs , Total , Wages and salaries of Government and Management Members of the Government and Management Average number of employees during the financial year Average number of blue collars Total CONTAINERSHIPS CONSOLIDATED FINANCIAL STATEMENTS 2018
63 CONTAINERSHIPS PLC EUR DEPRECIATION, AMORTISATION AND IMPAIRMENT LOSSES Depreciation according to plan Intangible assets Other long-term assets Machinery and equipment Total OTHER OPERATING EXPENSES Other personnel costs Office costs Purchased services Other operating expences Total Auditor fees and services Group s main auditor has been in 2018 KPMG Oy Ab. Audit Tax services Other services Total FINANCIAL INCOME AND EXPENSES Financial income Dividend income 0 0 Interest income Interest income from group companies Exchange rate income 0 0 Total Financial expenses Interest expenses Other financial expenses Exchange rate gaines Exchange rate losses Total TAXES Changes for deferred taxes Total CONTAINERSHIPS CONSOLIDATED FINANCIAL STATEMENTS
64 CONTAINERSHIPS PLC NOTES TO THE BALANCE SHEET (ASSETS), EUR INTANGIBLE ASSETS Development expenditure Acquisition cost Increases Acquisition cost Accumulated amortisations Amortisations under the financial year Impairments Accumulated amortisations Book value Other long-term assets Acquisition cost Increases Disposals Acquisition cost Accumulated amortisations Amortisations under the financial year Accumulated amortisations Book value Advance payments Acquisition cost Increases Disposals Acquisition cost Total intangible assets TANGIBLE ASSETS Machinery and equipment Acquisition cost Increases Disposals Acquisition cost Accumulated depreciations on Depreciations of disposals and reclassifications Depreciations under the financial year Accumulated depreciations on Book value Total tangible assets CONTAINERSHIPS CONSOLIDATED FINANCIAL STATEMENTS 2018
65 CONTAINERSHIPS PLC NOTES TO THE INCOME STATEMENT, EUR INVESTMENTS Shares in consolidated companies Acquisition cost Increases Acquisition cost ZAO Containerships, Russia 100 % 100 % Containerships GmbH, Germany 100 % 100 % CSD Containerships Deutschland GmbH, Germany 100 % 100 % Containerships Rotterdam BV, Netherlands 100 % 100 % Containerships Dublin Ltd, Ireland 100 % 100 % Containerships UK Ltd, Great Britain 100 % 100 % UAB Containership, Lithuania 100 % 100 % Containerships Latvia SIA, Latvia 100 % 100 % Containerships Polska, Poland 100 % 100 % Containerships Belgium N.V., Belgium 100 % 100 % Containerships Denizcilik Nakliyat, Turkey 100 % 100 % CS LNG Holding Oy 100 % 100 % Nordic Bergen Schifffahrtsgesellschaft 90 % 90 % Nordic Turku Schifffahrtsgesellschaft 90 % 90 % Nordic Copenhagen Schifffahrtsgesellschaft 90 % 90 % Nordic Kotka Schifffahrtsgesellschaft 90 % 90 % The ultimate parent company of the Containerships Group is Container Finance Ltd Oy, which is based in Finland. In addition to the ownership of the subsidiaries company has representative offices in Denmark. Other shares and associates Historical cost Historical cost Zeeland Family Oyj 0,06 % Total investments CONTAINERSHIPS CONSOLIDATED FINANCIAL STATEMENTS
66 CONTAINERSHIPS PLC NOTES TO THE INCOME STATEMENT, EUR INVENTORIES LONG-TERM RECEIVABLES Long term receivables Deferred tax assets Change Deferred tax assets Interest accruals Long-term receivables from group companies Other long-term receivables Long-term receivables total SHORT-TERM RECEIVABLES Short-term receivables from group companies Sales receivables Group account receivable Loan receivables Other receivables Total Short-term receivables from other companies Sales receivables Other receivables Prepayments and accrued income Total Short-term prepayments and accrued income Insurances Finnish Maritime Administration Container rent accruals Rent accruals Interest accruals Accrued costs Other Total Short-term receivables total CONTAINERSHIPS CONSOLIDATED FINANCIAL STATEMENTS 2018
67 CONTAINERSHIPS PLC NOTES TO THE BALANCE SHEET (EQUITY AND LIABILITIES), EUR EQUITY CAPITAL Restricted equity capital Share capital Increase 0 0 Share capital Premium fund Premium fund Restricted equity capital total Unrestricted equity capital Fund for invested unrestricted equity Change 0 0 Invested unrestricted equity capital Retained earnings Retained earnings Profit/loss from the financial year Unrestricted equity capital total Hybrid capital loan Increase 0 0 Hybrid capital loan Total equity Development expenditure Distributable funds HYBRID CAPITAL LOAN Hybrid capital loan, total of EUR thousand. The loan have no maturity date but the company has the right to repay the loan at the moment bond is expiring. The loan interest rate is 8% and the Interest accrues from the issue date until, and be payable at, the time of repayment of the hybrid capital loan. If interest is paid to the hybrid capital loan it is recognised directly in retained earnings and unpaid interest is accrued. The hybrid capital loan and the Interests are subordinated to all other debts in the liquiditation and bankruptcy of the company. If the Investors have not chosen to exercise its right to subscribe for shares, the hybrid capital loan shall not be repaid, but the interest level will increase from after the bond has been refinanced or latest by April 30, 2019, according to the agreement. The loan from related party was initially issued in 2015 and presented as a convertible notes in non-current liabilities in 2015 financial statements. Due to amendments in the terms of the contract, the loan was reclassified from non-current liabilities to equity. Accumulated interest for the loan is 921 thousand euro. CONTAINERSHIPS CONSOLIDATED FINANCIAL STATEMENTS
68 CONTAINERSHIPS PLC NOTES TO THE INCOME STATEMENT, EUR LONG-TERM LIABILITIES Loans from financial institutions Bonds Convertible capital loans Other long-term liabilities Total Long-term liabilities total BOND ISSUE EUR thousand bond issue is secured and is repayable in full on CONVERTIBLE CAPITAL LOANS Convertible capital loans, total of EUR thousand, interest rate is 8% and the interest accrues from the issue date until, and is payable at, the time of repayment of the convertible capital loans. If the investors have not chosen to exercise their right to subscribe for shares, the convertible capital loan shall be repaid together with interest on April 30, The capitalised interest of convertible loan is thousand euro. NOTES TO THE INCOME STATEMENT, EUR SHORT-TERM LIABILITIES Short-term liabilities to group companies Trade payables Group account debt Loans Total Short-term liabilities to other companies Trade payables Convertible capital loans Other liabilities Short-term accrued expenses Total Short-term accrued expenses Salaries Loan interests Accrued costs Other accrued expenses Total Short-term liabilities total Loan interests include bond interest ,33. The terms and conditions of the subordinated loan are presented in Note CONTAINERSHIPS CONSOLIDATED FINANCIAL STATEMENTS 2018
69 CONTAINERSHIPS PLC NOTES TO THE INCOME STATEMENT, EUR COMMITMENTS AND CONTINGENT LIABILITIES Loans for which the collateral is given Bond security Other collaterals Vessel mortage Company mortgage General pledging Other collaterals Customs' guarantee DERIVATE CONTRACTS MARKET-VALUE MARKET-VALUE Currency- and interest derivates Currency swaps Interest derivates MATURITY ANALYSIS 2018 EUR AMOUNT TOTAL 0-6 M 7-12 M Derivatives Foreign exchange derivative contracts Interest rate swaps Commodity forward contracts Total The interest rate swaps are utilized in order to cover the interest expenses of the bond. The interest expenses of the bond is divided to the maturity period. Therefore, it is reasonable reasonable to handle the interest rate swaps as commitments and contingent liability in order to harmonize swap and underlying interest expenses to the same accounting period. The interest rate swap can be terminated before maturity. Current market value of interest rate swap reflects the termination costs. Oil hedging Oil hedging CONTAINERSHIPS CONSOLIDATED FINANCIAL STATEMENTS
70 CONTAINERSHIPS PLC 21. FUTURE LEASING PAYMENTS Due within one year from balance sheet date Container leases Other leases Due later than one year from balance sheet date Container leases Other leases Total Term of notice for leased containers is generally 2 months. Other equipment leaseagreements terminate during Generally these leaseagreements do not have redemption clauses. 70 CONTAINERSHIPS CONSOLIDATED FINANCIAL STATEMENTS 2018
71 CONTAINERSHIPS GROUP BOARD PROPOSAL FOR THE DISTRIBUTION OF PARENT COMPANY PROFIT The parent company s distributable funds according to the balance sheet at 31 December 2018 were EUR 0 thousand. The Board of Directors proposes that no dividend will be paid on the company s shares and the loss for the financial year 2018 EUR thousand will be carried further in the retained earnings. Espoo, February 2019 SIGNATURES OF THE BOARD OF DIRECTORS AND THE CEO TO THE REPORT OF THE BOARD OF DIRECTORS AND THE FINANCIAL STATEMENTS Lars Kastrup Chairman of the Board Guillaume Lathelize Member of the Board Kari-Pekka Laaksonen CEO Michel Sirat Member of the Board AUDITORS NOTE Our auditor s report has been issued today. Helsinki, February 2019 KPMG Oy Ab Kimmo Antonen Authorized Public Accountant
72 CONTAINERSHIPS PLC List of accounting journals ACCOUNTING JOURNAL VOUCHER TYPE STORAGE METHOD Financial Statement Journal and general ledger Cash journal Tied IT IT Sales ledger vouchers CI, BR, DR Paper Purchase ledger vouchers FL, KR, BP, DG, IT, DK Paper Bank and cash vouchers BD, BS, CD Paper Journal entries SA, PY, PD Paper 72 CONTAINERSHIPS CONSOLIDATED FINANCIAL STATEMENTS 2018


73


74

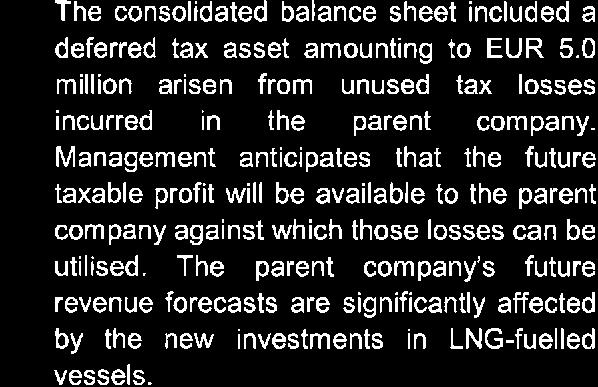


75
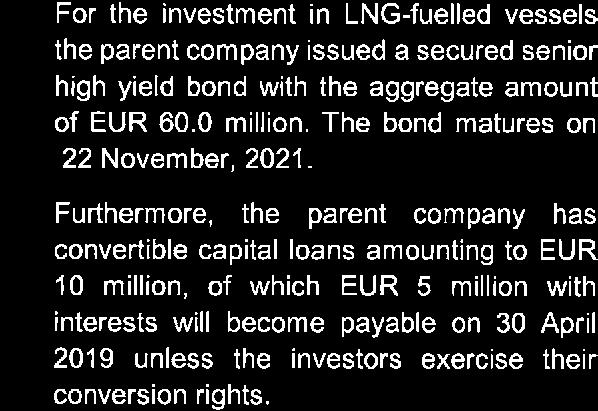
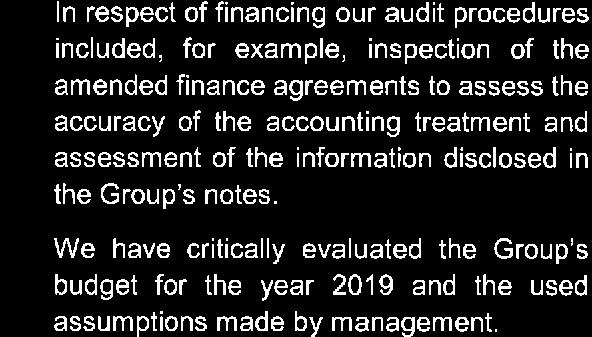

76
77

78
Wärtsilä Corporation. Interim Report January-September 2003 Ole Johansson President & CEO. 29 October Wärtsilä
 Wärtsilä Corporation Interim Report January-September 2003 Ole Johansson President & CEO 29 October 2003 Highlights of the reporting period Order intake of Power Divisions increased. Clear improvement
Wärtsilä Corporation. Interim Report January-June 2003 Ole Johansson President & CEO. 31 July Wärtsilä
 Wärtsilä Corporation Interim Report January-June 2003 Ole Johansson President & CEO 31 July 2003 Group structure Power Divisions Engine division Marine Power Plants Service Holding Assa Abloy 7.6% 2 Group
IFRS standards roadmap
 IFRS standards roadmap Updated: 13.5. Based on IASB work plan as of April 30, (EU endorsement status as at April 5, ) Taru Kettunen IASB Completed projects: Recently published, major projects MAJOR PROJECTS
Interim Report 1 Jan. 31 Mar. 2014
 Interim Report 1 Jan. 31 Mar. 2014 Ilkka-Yhtymä Oyj s Interim Report for Q1/2014 Net sales: EUR 10.1 million (EUR 11.0 million) Circulation revenues increased slightly and total expenses decreased Operating
LUONNOS RT 80260 EN AGREEMENT ON BUILDING WORKS 1 THE PARTIES. May 1998 1 (10)
") RT 80260 EN May 1998 1 (10) AGREEMENT ON BUILDING WORKS This agreement template is based on the General Terms and Conditions of Building Contracts YSE 1998 RT 16-10660, LVI 03-10277, Ratu 417-7, KH X4-00241.
RT 80260 EN May 1998 1 (10) AGREEMENT ON BUILDING WORKS This agreement template is based on the General Terms and Conditions of Building Contracts YSE 1998 RT 16-10660, LVI 03-10277, Ratu 417-7, KH X4-00241.
Capacity Utilization
 Capacity Utilization Tim Schöneberg 28th November Agenda Introduction Fixed and variable input ressources Technical capacity utilization Price based capacity utilization measure Long run and short run
ProAgria. Opportunities For Success
 ProAgria Opportunities For Success Association of ProAgria Centres and ProAgria Centres 11 regional Finnish ProAgria Centres offer their members Leadership-, planning-, monitoring-, development- and consulting
Appendix 6. Proposal for the Split of Assets and Liabilities
 Appendix 6. Proposal for the Split of Assets and Liabilities BALANCE SHEET (EUR) Demerging New New Kone Oyj KONE Oyj Cargotec Oyj companies (30.9.2004) total Note Assets FIXED ASSETS Intangible assets
Efficiency change over time
 Efficiency change over time Heikki Tikanmäki Optimointiopin seminaari 14.11.2007 Contents Introduction (11.1) Window analysis (11.2) Example, application, analysis Malmquist index (11.3) Dealing with panel
Biotie Therapies Corp.
 Biotie Therapies Corp. Timo Veromaa, President and CEO EGM 28.11.2006 Future outlook 2006 (1/2) (As presented in the AGM 30 March 2006) Commercialize the European and Asian rights of nalmefene Bring the
Olet vastuussa osaamisestasi
 Olet vastuussa osaamisestasi Ohjelmistoammattilaisuuden uudet haasteet Timo Vehmaro 02-12-2015 1 Nokia 2015 Mitä osaamista tulevaisuudessa tarvitaan? Vahva perusosaaminen on kaiken perusta Implementaatio
Business definitions Nordea Mortgage Bank Plc
 Business definitions Nordea Mortgage Bank Plc Return on equity Net profit for the year excluding non-controlling interests as a percentage of average equity for the year. Average equity including net profit
Wärtsilä Corporation. Interim Report January-March 2006 Ole Johansson, President & CEO. 4 May Wärtsilä
 Wärtsilä Corporation Interim Report January-March 26 Ole Johansson, President & CEO 4 May 26 First-quarter highlights 26 Net sales from comparable operations grew to EUR 591.9 million (483.8) Operating
TIEKE Verkottaja Service Tools for electronic data interchange utilizers. Heikki Laaksamo
 TIEKE Verkottaja Service Tools for electronic data interchange utilizers Heikki Laaksamo TIEKE Finnish Information Society Development Centre (TIEKE Tietoyhteiskunnan kehittämiskeskus ry) TIEKE is a neutral,
Pricing policy: The Finnish experience
 Pricing policy: The Finnish experience Esa Österberg Senior Researcher Alcohol and Drug Research, STAKES, Helsinki, Finland esa.osterberg@stakes.fi Three pillars of traditional Nordic alcohol control Strict
Miehittämätön meriliikenne
 Rolls-Royce & Unmanned Shipping Ecosystem Miehittämätön meriliikenne Digimurros 2020+ 17.11. 2016 September 2016 2016 Rolls-Royce plc The 2016 information Rolls-Royce in this plc document is the property
Innovative and responsible public procurement Urban Agenda kumppanuusryhmä. public-procurement
 Innovative and responsible public procurement Urban Agenda kumppanuusryhmä https://ec.europa.eu/futurium/en/ public-procurement Julkiset hankinnat liittyvät moneen Konsortio Lähtökohdat ja tavoitteet Every
Interim Report 1 Jan. 30 Jun. 2014
 Interim Report 1 Jan. 30 Jun. 2014 Ilkka-Yhtymä Oyj s Interim Report 1 Jan. 30 Jun. 2014 JANUARY JUNE 2014 Net sales: EUR 20.9 million (EUR 22.6 million) Total expenses decreased by 5.5% Operating profit:
16. Allocation Models
 16. Allocation Models Juha Saloheimo 17.1.27 S steemianalsin Optimointiopin seminaari - Sks 27 Content Introduction Overall Efficienc with common prices and costs Cost Efficienc S steemianalsin Revenue
Wärtsilä Corporation. Interim Report January-June 2006 Ole Johansson, President & CEO. 4 August Wärtsilä
 Wärtsilä Corporation Interim Report January-June 26 Ole Johansson, President & CEO 4 August 26 Highlights Second-quarter Order intake EUR 1,19.1 million (841.8), growth 41.4%. Net sales from comparative
Karkaavatko ylläpitokustannukset miten kustannukset ja tuotot johdetaan hallitusti?
 For professional use only Not for public distribution Karkaavatko ylläpitokustannukset miten kustannukset ja tuotot johdetaan hallitusti? 08.02.2012 Jyrki Merjamaa, Head of Asset Management Aberdeen Asset
Accommodation statistics
 Transport and Tourism 2013 Accommodation statistics 2013, February Nights spent by foreign tourists in Finland down by 2.5 per cent in February 2013 The number of recorded nights spent by foreign tourists
Export Demand for Technology Industry in Finland Will Grow by 2.0% in 2016 GDP growth 2016/2015, %
 Russia Rest of Eastern Europe Brazil America Middle East and Africa Export Demand for Technology Industry in Finland Will Grow by 2.% in 216 GDP growth 216/215, % 9 8 7 6 5 4 3 2 1-1 -2-3 -4 Average growth:
Other approaches to restrict multipliers
 Other approaches to restrict multipliers Heikki Tikanmäki Optimointiopin seminaari 10.10.2007 Contents Short revision (6.2) Another Assurance Region Model (6.3) Cone-Ratio Method (6.4) An Application of
1. SIT. The handler and dog stop with the dog sitting at heel. When the dog is sitting, the handler cues the dog to heel forward.
 START START SIT 1. SIT. The handler and dog stop with the dog sitting at heel. When the dog is sitting, the handler cues the dog to heel forward. This is a static exercise. SIT STAND 2. SIT STAND. The
The CCR Model and Production Correspondence
 The CCR Model and Production Correspondence Tim Schöneberg The 19th of September Agenda Introduction Definitions Production Possiblity Set CCR Model and the Dual Problem Input excesses and output shortfalls
Helsinki Metropolitan Area Council
 Helsinki Metropolitan Area Council Current events at YTV The future of YTV and HKL On the initiative of 4 city mayors the Helsinki region negotiation consortiums coordinating group have presented that:
 Liite 6 / Appendix 6 Hallituksen valtuuttaminen päättämään yhtiön omien osakkeiden hankkimisesta Authorisation of the Board of Directors to decide on the repurchase of the Company's own shares Hallitus
Hallittu siirtymä Group Consolidationista FPM:ään sekä vuoden 2013 uudet IFRS muutokset
 A Basware Presentation Hallittu siirtymä Group Consolidationista FPM:ään sekä vuoden 2013 uudet IFRS muutokset Basware Käyttäjäpäivät 20.-21.9.2011 Rohkeus liiketoiminnan kehittämiseen Lahti Hallittu siirtymä
Winled Oy Ltd, Tilinpäätös Muut pitkävaikutteiset menot ,13 0,00. Koneet ja kalusto , ,67
 Winled Oy Ltd, 0806098-0 Tilinpäätös 1.3.2015-29.2.2016 TASE 29.2.2016 28.2.2015 VASTAAVAA PYSYVÄT VASTAAVAT Aineettomat hyödykkeet Muut pitkävaikutteiset menot 140 589,13 0,00 Aineettomat hyödykkeet yhteensä
2017/S Contract notice. Supplies
 Supplies 153936 2017 25/04/2017 S80 - - Supplies - Contract notice - Open procedure I. II. III. IV. VI. -: Medical equipments, pharmaceuticals and personal care products 2017/S 080-153936 Contract notice
Skene. Games Refueled. Muokkaa perustyyl. napsautt. @Games for Health, Kuopio. 2013 kari.korhonen@tekes.fi. www.tekes.fi/skene
 Skene Muokkaa perustyyl. Games Refueled napsautt. @Games for Health, Kuopio Muokkaa alaotsikon perustyyliä napsautt. 2013 kari.korhonen@tekes.fi www.tekes.fi/skene 10.9.201 3 Muokkaa Skene boosts perustyyl.
Vastaa kysymyksiin ympyröimällä oikea vastausvaihtoehto.
 Oulun yliopisto, OyKKK Mirjam Lehenkari 724207A RAHOIUSPÄÄÖKSE entti 2 (1. uusinta) 4.4.2016 entti koostuu 15 monivalinta- tai oikein/väärin tehtävästä. Jokaiseen tehtävään on ainoastaan yksi oikea (tai
VUOSI 2015 / YEAR 2015
 VUOSI 2015 / YEAR 2015 Kansainvälisen opetuksen ja tutkimustoiminnan kehittäminen Developing international teaching and research activities Rehtorin strateginen rahoitus vuosille 2014-2016 / Strategic
INTERIM REPORT 1 JANUARY 30 SEPTEMBER 2014
 INTERIM REPORT 1 JANUARY 30 SEPTEMBER 2014 This interim report is unaudited UPM interim report 1 January 30 September 2014 Q3 2014 compared with Q3 2013 Earnings per share excluding special items were
Network to Get Work. Tehtäviä opiskelijoille Assignments for students. www.laurea.fi
 Network to Get Work Tehtäviä opiskelijoille Assignments for students www.laurea.fi Ohje henkilöstölle Instructions for Staff Seuraavassa on esitetty joukko tehtäviä, joista voit valita opiskelijaryhmällesi
PROSPECTUS SUPPLEMENT NO. 1 DATED 25 JULY 2014 TO THE BASE PROSPECTUS DATED 2 JULY 2014 WARRANT AND CERTIFICATE PROGRAMME
 PROSPECTUS SUPPLEMENT NO. 1 DATED 25 JULY 2014 TO THE BASE PROSPECTUS DATED 2 JULY 2014 WARRANT AND CERTIFICATE PROGRAMME This Prospectus Supplement dated 25 July 2014 (the Prospectus Supplement or Prospectus
Valuation of Asian Quanto- Basket Options
 Valuation of Asian Quanto- Basket Options (Final Presentation) 21.11.2011 Thesis Instructor and Supervisor: Prof. Ahti Salo Työn saa tallentaa ja julkistaa Aalto-yliopiston avoimilla verkkosivuilla. Muilta
Accommodation statistics
 Transport and Tourism 2011 Accommodation statistics 2011, January Nights spent by foreign tourists in Finland increased by per cent in January The number of recorded nights spent by foreign tourists at
Ikärakennemuutos, tulot ja kulutus Reijo Vanne, Työeläkevakuuttajat TELA. Sisältö. Päälähteet
 Helsingin yliopisto Sosiaalitieteiden laitos Yhteiskuntapolitiikka Luentosarja: Suomi ikääntyy 2015 19.2.2015 Ikärakennemuutos, tulot ja kulutus Reijo Vanne, Työeläkevakuuttajat TELA Sisältö Käsitteitä:
Työsuojelurahaston Tutkimus tutuksi - PalveluPulssi 11.3.2016. Peter Michelsson Wallstreet Asset Management Oy
 Työsuojelurahaston Tutkimus tutuksi - PalveluPulssi 11.3.2016 Peter Michelsson Wallstreet Asset Management Oy Wallstreet lyhyesti Perustettu vuonna 2006, SiPa toimilupa myönnetty 3/2014 Täysin kotimainen,
Mawson Resources Limited
 www.mawsonresources.com SYYSKUU 2014 Disclaimer Some of the statements contained in the following material may be "forward-looking statements." All statements, other than statements of historical fact,
Tekes the Finnish Funding Agency for Technology and Innovation. Copyright Tekes
 Tekes the Finnish Funding Agency for Technology and Innovation DM 607668 03-2011 Expertise and networks for innovations Tekes services Funding for innovative R&D and business Networking Finnish and global
Erasmus Charter for Higher Education Hakukierros kevät 2013 Anne Siltala, CIMO
 Erasmus Charter for Higher Education 2014-2020 Hakukierros kevät 2013 Anne Siltala, CIMO 2/2009 Mikä on Erasmus-peruskirja? Erasmus-peruskirja (Erasmus Charter for Higher Education, ECHE) säilyy korkeakoulun
Vastuullisuusarviointi M&A hankkeiden evaluoinnissa ja due diligence prosessissa
 Petri Castrén CFO, Kemira DIF Directors Institute of Finland Tietopankkiaamiainen 30.5.2016 Vastuullisuusarviointi M&A hankkeiden evaluoinnissa ja due diligence prosessissa The first choice in chemistry
The role of 3dr sector in rural -community based- tourism - potentials, challenges
 The role of 3dr sector in rural -community based- tourism - potentials, challenges Lappeenranta, 5th September 2014 Contents of the presentation 1. SEPRA what is it and why does it exist? 2. Experiences
Accommodation statistics
 Transport and Tourism 2015 Accommodation statistics 2015, October Overnight stays at accommodation establishments increased by per cent in October The total number of overnight stays at Finnish accommodation
Sisävesidirektiivin soveltamisala poikkeussäännökset. Versio: puheenjohtajan ehdotus , neuvoston asiakirja 8780/16.
 Sisävesidirektiivin soveltamisala poikkeussäännökset Versio: puheenjohtajan ehdotus 13.5.2016, neuvoston asiakirja 8780/16. Artikla 2 1. This Directive applies to deck crew members, radio operators, liquefied
Supplies
 Supplies - 239236-2018 05/06/2018 S105 - - Supplies - Contract notice - Open procedure I. II. III. IV. VI. Finland-Seinäjoki: Wheelchairs 2018/S 105-239236 Contract notice Supplies Directive 2014/24/EU
Meriliikenteen digitalisaatio MERIT. smart maritime industry
 Meriliikenteen digitalisaatio MERIT ulla.tapaninen@hel.fi smart maritime industry Meriliikenteen digitalisaatio 1. Vessel 2. Supply chain City of Helsinki 14.12.2016 2 Meriliikenteen digitalisaatio Älykäs
PROSPECTUS SUPPLEMENT NO. 2 DATED 4 NOVEMBER 2014 TO THE BASE PROSPECTUS DATED 2 JULY 2014 WARRANT AND CERTIFICATE PROGRAMME
 PROSPECTUS SUPPLEMENT NO. 2 DATED 4 NOVEMBER 2014 TO THE BASE PROSPECTUS DATED 2 JULY 2014 WARRANT AND CERTIFICATE PROGRAMME This Prospectus Supplement dated 4 November 2014 (the Prospectus Supplement
Notes to the balance sheet
 Notes to the balance sheet Group Group Parent company Parent company Non-current assets Intangible rights Intangible assets Acquisition cost as at 1 Jan 7,499 4,137 2,600 2,590 Increases 300 273 231 16
Supplies
 Supplies - 239150-2018 05/06/2018 S105 - - Supplies - Contract notice - Open procedure I. II. III. IV. VI. Finland-Oulu: Medical equipments 2018/S 105-239150 Contract notice Supplies Directive 2014/24/EU
Rotarypiiri 1420 Piiriapurahoista myönnettävät stipendit
 Rotarypiiri 1420 Piiriapurahoista myönnettävät stipendit Ø Rotarypiiri myöntää stipendejä sille osoitettujen hakemusten perusteella ensisijaisesti rotaryaatteen mukaisiin tarkoituksiin. Ø Stipendejä myönnetään
AYYE 9/ HOUSING POLICY
 AYYE 9/12 2.10.2012 HOUSING POLICY Mission for AYY Housing? What do we want to achieve by renting apartments? 1) How many apartments do we need? 2) What kind of apartments do we need? 3) To whom do we
Toimitusketjun vastuullisuus ja riskien hallinta
 Toimitusketjun vastuullisuus ja riskien hallinta Fibs PRO koulutus Tapahtumatalo Bank, Unioninkatu 20 1 SAFER, SMARTER, GREENER Toimitusketjun vastuullisuus ja riskien hallinta 1. osa: Toimitusketjun vastuullisuuden
Tuloksia ja kokemuksia / results and experiences
 EUROPEAN REGIONAL DEVELOPMENT FUND INTERREG IVC 2007-2013 interregional cooperation across Europe Tuloksia ja kokemuksia / results and experiences Interreg IVC/ Interreg Europe 26 May 2015, Helsinki INTERREG
THE MORTGAGE SOCIETY OF FINLAND SUPPLEMENT NO. 1 / FOR THE PROGRAMME FOR THE ISSUANCE OF NOTES 1,500,000,000 euros
 SUPPLEMENT NO. 1 DATED 17.11.2015 THE MORTGAGE SOCIETY OF FINLAND SUPPLEMENT NO. 1 / 17.11.2015 FOR THE PROGRAMME FOR THE ISSUANCE OF NOTES 1,500,000,000 euros This supplement (the Supplement) comprises
Social and Regional Economic Impacts of Use of Bioenergy and Energy Wood Harvesting in Suomussalmi
 Social and Regional Economic Impacts of Use of Bioenergy and Energy Wood Harvesting in Suomussalmi Green Cities and Settlements 18.2.2014 Ville Manninen Writers Project group Sirpa Korhonen, Anna Mari
Tutkimuslääkkeiden GMP. Fimea Pirjo Hänninen
 Tutkimuslääkkeiden GMP Fimea 17.1.2017 Pirjo Hänninen Kliinisiä lääketutkimuksia koskeva EU:n asetus Regulation (EU) No 536/2014 Hyväksytty 16.4.2014 (voimaan 28.5. 2016) Kumoaa nykyisen lääketutkimusdirektiivin
Accommodation statistics
 Transport and Tourism 201 Accommodation statistics 201, May Nights spent by foreign tourists in Finland up by 11 per cent in May 201 Overnight stays by foreign tourists continued increasing at Finnish
Cleantech Invest Oyj
 Cleantech Invest Oyj Malminrinne 1 B 00180 Helsinki Legal domicile: Helsinki Company-ID: 2005438-0 ANNUAL REPORT 1.1.2014-31.12.2014 This annual report must be stored until 31.12.2024 Financial statements
Smart specialisation for regions and international collaboration Smart Pilots Seminar
 Smart specialisation for regions and international collaboration Smart Pilots Seminar 23.5.2017 Krista Taipale Head of Internaltional Affairs Helsinki-Uusimaa Regional Council Internationalisation
Technische Daten Technical data Tekniset tiedot Hawker perfect plus
 Technische Daten Technical data Tekniset tiedot Hawker perfect plus PzS-Zellen Hawker perfect plus, mit Schraubverbindern, Abmessungen gemäß DIN/EN 60254-2 und IEC 254-2 Serie L PzS-cells Hawker perfect
Notes to the balance sheet
 Notes to the balance sheet 4,137 273-6 3,094 7,498 3,734 62 2,590 15-6 2,5 2,526 62-1 1 2,590-2,306 0-122 -2,427 NON-CuRRENT ASSETS Intangible assets Intangible rights impairment losses as at 1 Jan Accumulated
Osavuosikatsaus tammi syyskuu 2002
 Osavuosikatsaus tammi syyskuu 2002 Tulostiedotus 3/2002 Vantaa, 22.10.2002 Jyri Luomakoski, talousjohtaja Osavuosikatsaus tammi syyskuu 2002 Liikevaihto toimialoittain 1-9 Change 1-9 1-12 MEUR 2002 Y/Y
Accommodation statistics
 Transport and Tourism 2013 Accommodation statistics 2012, December Nights spent by foreign tourists in Finland up by 45 per cent in December 2012 The number of recorded nights spent by foreign tourists
Suomen JVT- ja Kuivausliikkeiden Liitto ry The Association of Finnish Damage Restoration Companies
 Suomen JVT- ja Kuivausliikkeiden Liitto ry The Association of Finnish Damage Restoration Companies PL 3 00721 Helsinki www.vahinkopalvelut.net info@vahinkopalvelut.net +358-40-900 9856 TUVASA Turvallinen
Organisaation kokonaissuorituskyvyn arviointi
 Organisaation kokonaissuorituskyvyn arviointi Aila Järveläinen, 13.3.2018 aila.jarvelainen@trafi.fi Responsible traffic. Courage and co-operation. Hallintojärjestelmä CMS + SMS CMS SMS 29.3.2018 Finnish
Accommodation statistics
 Transport and Tourism 2015 Accommodation statistics 2015, September Nights spent by foreign tourists in Finland up by 5.0 per cent in September The number of recorded nights spent by foreign tourists at
Vastuuvelan markkina-arvon määrittämisestä *
 Vastuuvelan markkina-arvon määrittämisestä * 13.10.2008 Markku Miettinen * Market Value of Liabilities for Insurance Firms, CRO Forum, July 2008 1 Eri lähestymistapoja / periaatteita vastuuvelan parhaan
CASE POSTI: KEHITYKSEN KÄRJESSÄ TALOUDEN SUUNNITTELUSSA KETTERÄSTI PALA KERRALLAAN
 POSTI GROUP CASE POSTI: KEHITYKSEN KÄRJESSÄ TALOUDEN SUUNNITTELUSSA KETTERÄSTI PALA KERRALLAAN TIINA KATTILAKOSKI POSTIN TALOUDEN SUUNNITTELU Mistä lähdettiin liikkeelle? Ennustaminen painottui vuosisuunnitteluun
GOOD WORK LONGER CAREER:
 Juhani Ilmarinen, Ville Ilmarinen, Pekka Huuhtanen, Veikko Louhevaara, Ove Näsman GOOD WORK LONGER CAREER: WORK WELL-BEING IN FINNISH TECHNOLOGY INDUSTRIES 2010-2015 Background Collective agreement between
Accommodation statistics
 Transport and Tourism 2014 Accommodation statistics 2014, October Nights spent by foreign tourists in Finland decreased by 1. per cent in October The number of recorded nights spent by foreign tourists
Accommodation statistics
 Transport and Tourism 2013 Accommodation statistics 2013, July Nights spent by foreign tourists in Finland up by 1.9 per cent in July 2013 The number of recorded nights spent by foreign tourists at Finnish
A special dividend is included in the index as a net amount and it is calculated as follows: ) = - ( 0.1761 EUR * 844 452 759) = - 148713280,75 EUR
 = - ( 0.1761 EUR * 844 452 759) = - 148713280,75 EUR") Exchange Notice April 25, 2007 Series 18/07 OMXH25 STOCK INDEX SPECIAL DIVIDEND ADJUSTMENT: TIETOENATOR OYJ The AGM of TeliaSonera AB has approved a dividend of EUR 0.6849 per share which will be effective
Exchange Notice April 25, 2007 Series 18/07 OMXH25 STOCK INDEX SPECIAL DIVIDEND ADJUSTMENT: TIETOENATOR OYJ The AGM of TeliaSonera AB has approved a dividend of EUR 0.6849 per share which will be effective
Horisontti 2020 ajankohtaisinfo
 Horisontti 2020 ajankohtaisinfo Hanna Vuorinen Kustannusasioiden NCP 1.12.2016 Aiheet Uusi malliavustussopimus ja kommentoitu avustussopimus Malliavustussopimuksen muutokset Art. 4.2. Budjettisiirrot Art.
SUPPLEMENT TO LISTING PROSPECTUS
 May 10, 2016 SUPPLEMENT TO LISTING PROSPECTUS This document is a supplement to the listing prospectus (the Listing Prospectus ) of Nokia Oyj ( Nokia or the Company ), approved by the Finnish Financial
Sisällysluettelo Table of contents
 Sisällysluettelo Table of contents OTC:n Moodlen käyttöohje suomeksi... 1 Kirjautuminen Moodleen... 2 Ensimmäinen kirjautuminen Moodleen... 2 Salasanan vaihto... 2 Oma käyttäjäprofiili... 3 Työskentely
Accommodation statistics
 Transport and Tourism 2014 Accommodation statistics 2013, December Nights spent by foreign tourists in Finland up by 5.5 per cent in December 2013 The number of recorded nights spent by foreign tourists
THE MORTGAGE SOCIETY OF FINLAND SUPPLEMENT NO. 2 /
 SUPPLEMENT NO. 2 DATED 18.8.2016 THE MORTGAGE SOCIETY OF FINLAND SUPPLEMENT NO. 2 / 18.8.2016 FOR THE PROGRAMME FOR THE ISSUANCE OF SENIOR UNSECURED NOTES, SUBORDINATED DEBENTURES AND COVERED BONDS 1,500,000,000
Equality of treatment Public Services
 Equality of treatment Public Services Providing high-quality Public Services in Europe based on the values of Protocol 26 (TFEU), Warsaw 12.10.2012 Kristian Siikavirta, Doctor of Law 18.10.2012 1 University
Supplies
 Supplies - 361595-2018 18/08/2018 S158 - - Supplies - Contract notice - Open procedure I. II. III. IV. VI. Finland-Turku: Office machinery, equipment and supplies except computers, printers and furniture
Accommodation statistics
 Transport and Tourism 201 Accommodation statistics 201, July Nights spent by resident tourists increased by 3.7 per cent in July 201 Overnight stays by resident tourists increased by 3.7 per cent in July
Internet of Things. Ideasta palveluksi IoT:n hyödyntäminen teollisuudessa. Palvelujen digitalisoinnista 4. teolliseen vallankumoukseen
 Internet of Things Ideasta palveluksi 17.4.2015 IoT:n hyödyntäminen teollisuudessa Palvelujen digitalisoinnista 4. teolliseen vallankumoukseen We are where our clients are CGI in Finland and globally Close
7. Product-line architectures
 7. Product-line architectures 7.1 Introduction 7.2 Product-line basics 7.3 Layered style for product-lines 7.4 Variability management 7.5 Benefits and problems with product-lines 1 Short history of software
National Building Code of Finland, Part D1, Building Water Supply and Sewerage Systems, Regulations and guidelines 2007
 National Building Code of Finland, Part D1, Building Water Supply and Sewerage Systems, Regulations and guidelines 2007 Chapter 2.4 Jukka Räisä 1 WATER PIPES PLACEMENT 2.4.1 Regulation Water pipe and its
EUROOPAN PARLAMENTTI
 EUROOPAN PARLAMENTTI 2004 2009 Kansalaisvapauksien sekä oikeus- ja sisäasioiden valiokunta 2008/0101(CNS) 2.9.2008 TARKISTUKSET 9-12 Mietintöluonnos Luca Romagnoli (PE409.790v01-00) ehdotuksesta neuvoston
Taiteen edistämiskeskus Porin toimipiste c/o Satakunnan ELY-keskus Valtakatu 12 B, Pori
 Taiteen edistämiskeskus Porin toimipiste c/o Satakunnan ELY-keskus Valtakatu 12 B, 28100 Pori Saapumispäivämäärä Ankomstdatum Dnro Rn Avustukset kulttuurisen moninaisuuden edistämiseen ja rasismin vastaiseen
Returns to Scale II. S ysteemianalyysin. Laboratorio. Esitelmä 8 Timo Salminen. Teknillinen korkeakoulu
 Returns to Scale II Contents Most Productive Scale Size Further Considerations Relaxation of the Convexity Condition Useful Reminder Theorem 5.5 A DMU found to be efficient with a CCR model will also be
On instrument costs in decentralized macroeconomic decision making (Helsingin Kauppakorkeakoulun julkaisuja ; D-31)
") On instrument costs in decentralized macroeconomic decision making (Helsingin Kauppakorkeakoulun julkaisuja ; D-31) Juha Kahkonen Click here if your download doesn"t start automatically On instrument costs
On instrument costs in decentralized macroeconomic decision making (Helsingin Kauppakorkeakoulun julkaisuja ; D-31) Juha Kahkonen Click here if your download doesn"t start automatically On instrument costs
THE MORTGAGE SOCIETY OF FINLAND SUPPLEMENT NO. 1 /
 SUPPLEMENT NO. 1 DATED 29.4.2016 THE MORTGAGE SOCIETY OF FINLAND SUPPLEMENT NO. 1 / 29.4.2016 FOR THE PROGRAMME FOR THE ISSUANCE OF SENIOR UNSECURED NOTES, SUBORDINATED DEBENTURES AND COVERED BONDS 1,500,000,000
Improving advisory services through technology. Challenges for agricultural advisory after 2020 Jussi Juhola Warsaw,
 Improving advisory services through technology Challenges for agricultural advisory after 2020 Jussi Juhola Warsaw, 22.2.2018 ProAgria in a nutshell Provides farm-and-agriculture entrepreneurs with services
A special dividend is included in the index as a net amount and it is calculated as follows:
 Exchange Notice March 20, 2007 Series 14/07 OMXH25 STOCK INDEX SPECIAL DIVIDEND ADJUSTMENT: RAUTARUUKKI OYJ The AGM of Rautaruukki Oyj has approved a dividend of EUR 2.00 per share which will be effective
Interim report January June July 2014 FINNLINES Q2
 Interim report January June 2014 29 July 2014 FINNLINES Q2 FINNLINES PLC, INTERIM REPORT JANUARY JUNE 2014 (unaudited) Stock Exchange Release 29 July 2014 at 14:00 JANUARY JUNE 2014: Result for the period
Tarua vai totta: sähkön vähittäismarkkina ei toimi? 11.2.2015 Satu Viljainen Professori, sähkömarkkinat
 Tarua vai totta: sähkön vähittäismarkkina ei toimi? 11.2.2015 Satu Viljainen Professori, sähkömarkkinat Esityksen sisältö: 1. EU:n energiapolitiikka on se, joka ei toimi 2. Mihin perustuu väite, etteivät
Ostamisen muutos muutti myynnin. Technopolis Business Breakfast 21.8.2014
 Ostamisen muutos muutti myynnin Technopolis Business Breakfast 21.8.2014 Taking Sales to a Higher Level Mercuri International on maailman suurin myynnin konsultointiyritys. Autamme asiakkaitamme parantamaan
Accommodation statistics
 Transport and Tourism 2015 Accommodation statistics 2015, July Nights spent by foreign tourists in Finland up by.5 per cent in July The number of recorded nights spent by foreign tourists at Finnish accommodation
Interim report January March May 2014 FINNLINES Q1
 Interim report January March 2014 6 May 2014 FINNLINES Q1 FINNLINES PLC, INTERIM REPORT JANUARY MARCH 2014 (unaudited) Stock Exchange Release 6 May 2014 at 12.15 JANUARY MARCH 2014: Strong start to the
SolarForum. An operation and business environment development project
 SolarForum An operation and business environment development project Dr. Suvi Karirinne, project manager, Head of the Environmental Engineering Degree Programme Solar Energy Finland -???? Approximately