JAAKKO KEMPPAINEN DESIGNING USER EXPERIENCE OF AN APPLICATION FOR LIVE ICE HOCKEY GAME CONTEXT. Master s thesis
|
|
|
- Ilmari Hiltunen
- 3 vuotta sitten
- Katselukertoja:
Transkriptio
1 JAAKKO KEMPPAINEN DESIGNING USER EXPERIENCE OF AN APPLICATION FOR LIVE ICE HOCKEY GAME CONTEXT Master s thesis Examiner: professor Kaisa Väänänen Examiner and topic approved by the Faculty Council of the Faculty of Computing and Electical Engineering on
2 i TIIVISTELMÄ Jaakko Kemppainen: Käyttökokemuksen suunnittelu jääkiekkosovellukseen Tampereen teknillinen yliopisto Diplomityö, 64 sivua, 21 liitesivua Helmikuu 2018 Tietotekniikan diplomi-insinöörin tutkinto-ohjelma Pääaine: User Experience Tarkastaja: Professori Kaisa Väänänen Avainsanat: Käyttökokemus, jääkiekko, mobiilisovellus, suunnittelu Mobiilisovelluksista on ajan myötä tullut eräs yleisimmistä tavoista tarjota digitaalista sisältöä käyttäjille. Eräs sovellusala on urheiluaiheiset sovellukset. Tämä diplomityö kuvaa urheiluaiheisen sovelluksen suunnittelua ja siihen liittyvää tutkimusta, sekä tutkimuksen tuloksia. Sovelluksen pääasiallinen tarkoitus on parantaa jäähallilla tapahtuvaa yleisökokemusta. Tärkein tutkimustavoite sovellukselle on käyttökokemustarpeiden kartoittaminen tässä kontekstissa. Toinen tutkimustavoite on varmistaa toteutetun sovelluksen onnistuminen käyttäen kyselytutkimusta. Tässä työssä käytetään useita käyttökokemussuunnittelun menetelmiä. Ensiksi esitellään kirjallisuuskatsaus aiheeseen liittyvään tutkimustietoon. Sen jälkeen esitellään SWOT viitekehyksen avulla toteutettu kilpailija-analyysi. Käyttäjien tarpeita kartoitetaan haastattelujen ja prototypoinnin avulla. Näiden tutkimuslöydösten perusteella suunnittelun tueksi esitellään persoonat, kokemustavoitteet sekä kontekstiskenaariot. Tutkimuksen perusteella käyttäjien tarpeet Suomalaisessa jääkiekkokatsontakulttuurissa tukevat olemassa olevaa SPEX-viitekehystä, sekä Fairleyn tekemiä havaintoja: jääkiekon katsominen jäähallilla on enemmän kuin pelkkää passiivista viihteen seuraamista: se on sekä sosiaalinen viitekehys, että rituaalinomainen tapahtuma itsessään. Katsojat käyvät peleissä viettääkseen aikaa ystävien ja perheensä kanssa. Jääkiekkoa enemmän seuraavat katsojat haluavat enemmän informaatiota jääkiekosta, ja kaiken tämän informaation keskittämistä yhteen, helposti löydettävään paikkaan. Tämän tueksi esitellään sovellusratkaisu. Toteutetun sovellusratkaisun pohjalta toteutetun palautekyselyn suurin löydös voidaan kiteyttää seuraavasti: sovellus on käyttäjille mielenkiintoinen, mutta Älykiekko-järjestelmän tuottamasta datasta haluttaisiin yksityiskohtaisempaa. Sekä aiemman, että tässä tutkimuksessa esitetyn teoriatiedon pohjalta voidaan todeta, että käyttäjät kaipaavat katsontakokemukselta yhteiselämyksiä. Tarvitaan uutta tutkimustietoa siitä, kuinka sovellus voisi toimia työkaluna tällaisten kokemusten luomisessa. Lisäksi toteutetun sovelluksen sisällöstä voidaan sanoa, että käyttäjät kaipaavat sinne videomateriaalia pelitilainteiden kertauksen tueksi.
3 ii ABSTRACT JAAKKO KEMPPAINEN: Designing user experience of an application for live ice hockey game context Tampere University of Technology Master of Science Thesis, 64 pages, 21 Appendix pages February 2018 Master s Degree Programme in Information Technology Major: User experience Examiner: Professor Kaisa Väänänen Keywords: User experience, ice hockey, mobile application, design Mobile applications are becoming the norm of digital content. One recently emerged application area is sports. This thesis describes a study and design conducted for an ice hockey themed application. The application s main objective is to enhance the spectator experience of ice hockey fans. The main research objective of this thesis is finding out what kind of user experience needs are there in a live spectating setting for a mobile application. Secondly, based on these findings, a design is proposed and the success of this design is validated using a questionnaire. This study uses several methods for creating the application design. First, a literature review for existing theory is conducted. Using SWOT analysis, a competitor analysis is performed. User research is conducted using interviews and prototype evaluations. Based on these findings, information guiding the application design is constructed in form of personas, experience goals and context scenarios. User needs in the application context corroborate previous research: watching ice hockey is more than passive entertainment. Spectators view the game as a social event. They want to meet friends and family. Avid fans of ice hockey wish to know more detailed information of the game and its events. They also want a centralized location to fetch this data from. For this, this thesis presents a technological solution. The main finding regarding the created solution is that while the solution has potential and arouses users interest, there is a want for more detailed data. Further research should be done in the direction of creating an application that spectators can use as a tool for creating co-experiences. Spectators are also interested in seeing the play situations in more detail, and for this, the proposed solution should incorporate video material of the plays delivered to the spectators phone.
4 iii PREFACE In the words of Donald Norman: It is not enough that we build products that function that are understandable and usable, we also need to build joy and excitement, pleasure and fun, and yes, beauty to people s lives. I would like to thank my co-designer Lauri Inkeroinen for providing help with the project when. I would also like to thank my supervisor Kaisa Väänänen for providing invaluable feedback and guidance for this thesis work. Special thanks go to screen names Z, wd17 and my girlfriend Emma Tolonen for providing me support when I most needed it. In Tampere, Jaakko Kemppainen
5 iv CONTENTS 1. INTRODUCTION Background and motivation Research objectives Structure of the thesis USER EXPERIENCE DESIGN Experience Definition of user experience Usability Co-experience User experience goals Creation, evaluation and analysis methods for user experience design SWOT Analysis Personas Context scenarios Affinity diagram User Experience Questionnaire Summary LIVE ICE HOCKEY GAME AS AN EXPERIENCE CONTEXT Ice hockey Venue Spectatorship Summary RESEARCH PROCESS Competitor review User research Recruitment procedure and participants Interview and prototyping sessions Research data consolidation Design validation RESULTS Competitor review Summary of competitor review User research Experience goals Personas Context scenarios Resulting implementation Design validation results SUMMARY AND CONCLUSIONS Summary of the results... 61
6 6.2 Validity of the results Future work REFERENCES APPENDIX 1: BACKGROUND QUESTIONNAIRE APPENDIX 2: INTERVIEW QUESTIONS APPENDIX 3: STRUCTURE OF THE PROTOTYPING SESSION APPENDIX 4: IMAGES OF THE CONSTRUCTED AFFINITY WALL APPENDIX 5: WRITTEN OUT AFFINITY NOTES APPENDIX 6: EXPERIENCE GOALS OF SPECTATORS v
7 1 1. INTRODUCTION This thesis has been done in collaboration with Bitwise while working as an user experience (UX) designer in a mobile application project for the Finnish ice hockey team Tappara. The aim of the project was to design a solution that could create a better viewing experience in live settings. Even though this project involves some novel technological solutions at least in Finnish context, this thesis focuses on the user experience design for the project. This chapter explains the background for this project and presents the goals of this thesis work. At the end of this chapter, the structure of this thesis is explained. 1.1 Background and motivation The amount of mobile applications has soared during the recent years. Applications range from purely functional to pure entertainment. This trend has found its way also into sports. For example, every National Hockey League team has their own application, specifically targeted for their fans. It is not unusual for major events to have their own applications. For example, the Olympics have their own application providing interesting information and schedules about the event. The company this thesis work was written for had access to smart ice hockey tracking technology that could provide accurate positional data about players, and experiments with tracking the puck real time were also on way. This created a possibility to create something novel in the field of ice hockey. The name of the technology and project was called Älykiekko (Finnish for Smart puck or Smart hockey ). Enriching spectatorship with technological solutions has been a topic of several scientific studies, but so far not in the context of ice hockey. Shirazi et al. developed a social media platform for connecting remote viewers together during the soccer world cup event [1]. They developed a system for sharing opinions and reactions in real time through a mobile application. Their study suggests that even though users were watching a game in a group, they still wanted to communicate with other users in remote locations. The users reported higher enjoyment when they were able to share their opinions. Esbjörnsson et al. also studied spectating, and developed an application to help rally spectators socialize with each other and to support an active viewing experience. [2] Their proposed solution was a mobile application where users could take pictures of cars and tag them for others to see. Their main finding was that spectatorship is an active experience, and that solutions automating parts of the spectatorship experience will not necessarily enhance the overall
8 2 viewing experience. Hallberg et al. created an early augmented reality solution for enriching events with media content in the context of cross-country skiing. [3] Their solution equipped cross country skiers with heart rate sensors and GPS locators and displayed the data in for spectators in a mobile application. Their findings argue that in their context viewers experiences were enhanced by added data. Even though different sports create different needs for spectators, the underlying motivations and basic needs carry across different sports. The context of a live sport event provides an interesting challenge for design. Designers want to maximize users enjoyment of the experience, at the same time providing them services that enhance the experience. An ice hockey arena packed full of fans provides an interesting and challenging design problem. The project that this thesis addresses, also works with an exciting technological solution Älykiekko. Smart wearable technology is implemented into players gear and equipment in the ice hockey rink to provide intricate locational data about the events in game. The data can then be analysed and presented in a form of a service. This creates possibility for novel solutions in at least the Finnish ice hockey scene. When designed and implemented correctly, with user experience in mind, these kinds of solutions have great potential in adding value to users. In the context of ice hockey, complementary applications can provide a more effortless and interesting stadium experience for people who do not frequently visit hockey games or do not even know much about the game. For avid fans, the application could present useful information that could strengthen the viewers connection with the game. For hockey team and stadium owners an application could increase revenue by attracting more customers, or by presenting existing customers with new services. Ice hockey teams could also be interested about the smart data provided by the Älykiekko system because of its possibilities in coaching. The motivation behind this thesis is to generate more knowledge about spectatorship in a new kind of context. Do existing findings about spectatorship fit into ice hockey context? Can something valuable to users be generated with the technological solutions that this project has access to? 1.2 Research objectives The main objective of this thesis project was to research user experience for a new mobile application that would make viewing ice hockey games in the arena more interesting for spectators. The project was initially ideated based on possible technological solutions, and the technology was used as a basis for generating the idea for the solution. As the author of this thesis joined the project as an UX designer, ideation and back end implementation had already taken place. Author s role was to conduct research to validate the idea and to guide the project in a direction that would generate tangible value for users.
9 3 This thesis aims to answer the following questions: 1. What are the user needs that affect experience design for a mobile application for ice hockey spectators in the arena? 2. Does the implemented service affect the spectatorship experience? Research question 1 is answered partly by literature review, examining existing solutions and conducting user interviews and prototype testing. The existing solutions are researched using a SWOT framework analysis. User interviews and early prototype testing were used to gather qualitative data. Prototype testing was done early on in the design to minimize wasted resources. Research question 2 was addressed by releasing software to users, and gathering feedback through a questionnaire. The questionnaire asked respondents for open feedback and also used a scientifically validated method for UX review. In the development process, the thesis worker s role was UX and UI design. UX work consisted of planning and executing user studies and interpreting the acquired data. UI design went hand in hand with UX research, and consisted of drawing wireframes and finalized designs for new features. In the beginning of the project, thesis worker was in charge of this role alone, but in July 2017, designer Lauri Inkeroinen joined the project and the rest of the UX design was done in collaboration. In the development process there were a total of 11 employees involved. Most of the other employees focused on programming, with the exception of the project manager and the UX designers. 1.3 Structure of the thesis The rest of the thesis is structured as follows. In Chapter 2, the domain of user experience is introduced and explained. The chapter also introduces design methods for user experience. This chapter also introduces the methods used in this thesis. In Chapter 3, the domain sport of ice hockey is introduced, as well as existing theory of spectatorship. Chapter 4 presents the research process and timeline of this thesis. Chapter 5 presents the results of the done user research and design, as well as the results of design validation. Chapter 6 summarizes the results of the studies and discusses the results validity, as well as need for future work.
10 4 2. USER EXPERIENCE DESIGN As software development has matured, user experience has become a trend and a major selling point when considering information systems. Two sub categories of user experience that are crucial to understanding user experience are presented in their own subchapters: usability and experience. Because of the social nature of spectatorship (more of this in Chapter 3), concept of co-experience is introduced. Concept of user experience goal is also introduced. Lastly, a selection of design methods for user experience are listed and examined using existing theory. 2.1 Experience User experience is a subset of all experience, and it would be difficult to define UX without first understanding general experience. In his book Art as Experience [4], Dewey proposes two categories for experience: general experience, and an experience. General experience is something that we are engaged all the time, since we experience life. An experience is a term that is more meaningful when designing interactive systems and considering user experience. An experience is something that has a distinct beginning and a distinct end. An experience consists of successive smaller experiences that blend into each other seamlessly. Experiences differ in their perceived significance. According to Dewey, a distinction has to be made between ongoing experiences, and when interpreting experiences in retrospect. When an experience is occurring, it is felt emotionally, but after an experience, the final product is intellectual. Applying Dewey s work to modern design work, in the context of user experience and user interface design, finding a route to the nearest pharmacy would be an experience. It consists of a series of tasks, such as opening the application on your phone, evaluating the user interface, choosing a way to on how to find pharmacies, and finally physically arriving to the destination. Bakhtin [5, 6] examines experience from a different perspective. In his theory, he considers personal qualities, such as commitment, loyalty, identification and trust. His theory focuses on people s interpretation of experiences in context of their day to day lives, on their selves and on their culture. His theory does not try to describe the first-hand experience of experiencing (that could be described with terms such as absorbing, irritating or captivating), instead it tries to see the practical effects of experience. Wright et al [7 p. 45] give a good example about Bakhtin s theory: One might find a web site absorbing during my first visit, but if it would not be integrated into my life (if it would not fit my sense of self), it would likely become less absorbing during subsequent visits.
11 5 Wright et al. proposed a more practical, holistic view for experience [7]. Their framework consists of two parts: describing experience, and how sense is made of experience. According to their theory, experience consists of four parts, or threads : a compositional thread, a sensual thread, an emotional thread and a spatio-temporal thread. Compositional thread is the narrative inside experiencer s mind considering action possibility, consequences and explanations of actions. According to Wright et al., thinking of questions such as what would happen if I clicked here?, what does this mean? are analysing the compositional thread of experience. The sensual thread is the sensory feeling of a situation or object. Feeling of tranquillity when entering a garden or feeling of uneasiness in a conversation are examples of sensual parts of experience. The sensual component of experience may sometimes be difficult to describe and distinguish. In everyday speech, it could be described as the gut feeling. The emotional thread is the emotional part of experience, consisting of feelings such as anger, satisfaction, fun etc. According to Wright et al. we can relate to other peoples experiences emotional threads through empathy. Experience s spatio-temporal thread means the perceived time and space during an experience. For example, the speed of perceived time may accelerate or decelerate, or when feeling anxious, we may perceive some spaces as smaller, as if the walls were caving in. Sense-making is proposed [7] to consist of several different processes which are not necessarily linearly successive. They are: anticipating, connecting, interpreting, reflecting, appropriating and recounting. Users carry certain expectations and possibilities with them when they encounter new experiences. According to the theory, they also revise their anticipations seamlessly when engaging in a new experience, creating new expectations and shaping the experience. By connecting, the theory means the first, pre-linguistic impression we get from the experience. This could be, for example, feeling thrilled when seeing a bright red sports car come around the corner, but when looking at it more closely, you see it s old, rusty and nearly breaking down. By interpreting, the theory proposes, the experiencer gives meaning to the compositional and emotional threads. Experiencer breaks down the narrative in compositional thread (what might happen next, what has happened) and compares their narrative with their expectations and the feelings evoked in the emotional thread. Experiencers may adjust their expectations based on their feelings. Reflecting means making judgements and evaluating the value of the experience as we are experiencing it, or after experiencing. Appropriating means evaluating the experience against past and future experiences, and assimilating it into our sense of self, as a part of our experience. It is also possible for the experience to change our sense of self and make us accommodate our self-image accordingly. Recounting means remembering the experience afterwards, and telling it to others in some way. According to Wright et al., because users make sense of their experiences themselves, designers cannot design an experience, only design for experience.
12 6 Using these theories, it may be said that experience itself is a complex, fleeting concept that is hard, if not impossible, to measure objectively and accurately. Recounting an experience as it happened is a difficult task. Designers have to carefully think how experience could be best measured for given context. 2.2 Definition of user experience User experience is a complex concept, consisting of many sub-concepts. User experience as a field of study is relatively young. Because UX is a merge of multiple fields of study, there is not one singular accepted definition for user experience. One of the most often referred definitions in literature is the ISO standard [8]. It defines user experience as a person's perceptions and responses that result from the use or anticipated use of a product, system or service. The standard lists following subcategories as part of user experience: user s feelings, beliefs, preferences, psychological and physical responses, behaviours and results that are formed before, during and after the use of system or service. According to another widely referenced standard, ISO [9], user experience consists of two parts: experience of the user, and usability of the system or the service. Chesnut and Nichols [10] define three distinctive attributes to user experience: usefulness, usability and desirability. By being useful, solution provides users with content and functions that are in line with the needs of the user. Being usable means intuitiveness and ease of use. Desirability means that the content of the solution is provided to the user in an engaging and interesting way. In their book, Chesnut and Nichols break user experience down to 5 components [10]: Information architecture Content strategy Interaction design Usability Visual design Information architecture considers the smaller modules of information systems, which are navigation, content organization, visual priority of page elements (where things are located physically on the screen) and interaction design. By content strategy, Chesnut and Nichols mean that all content should have a purpose. The time, place and topic of the content should be thought out in such a way that it assists the user in performing the task at hand. By visual design, the authors mean the aesthetical aspects, such as colours and imagery. Chesnut and Nichols emphasize that visual design should come second to good usability, since poor usability weighs more when factoring the overall pleasure of use [10, 11]. Law et al. conducted a survey to see, whether the ISO standard (more precisely, draft of the standard at that time) would align with the views of user experience professionals. In
13 7 their research, Law et al. suggest that the term user experience to be scoped to products, systems, services, and objects that a person interacts with through a user interface [12]. This definition, which can be seen in Figure 1, would exclude such things as human to human interaction and art from the scope of UX. According to the survey conducted by Law et al., user experience was seen as dynamic, subjective and dependent on the context. Figure 1. Scope of user experience. [12] As the study of Law et al. states, user experience is a sub set of all experience. It is dependent on context and the user, and the exact definition is under discussion. This thesis uses the definitions of ISO standards and Because the complexity of human experience (examined in previous chapter), it is sometimes difficult to distinguish experience from user experience when in context of real world applications. This is why laboratory conducted studies try to isolate environment variables from the usage of product. However, when using a product, there is always context of some kind. This dilemma, whether to study usage in real world context and add unknown variables, or to study in isolated environment, and lose a part of the experience, creates difficulties when designing study settings for UX studies. 2.3 Usability Usability is defined in the ISO-standard as the usefulness and purposefulness of a product or service, specifically as the extent to which a product can be used by specified users to achieve specified goals with effectiveness, efficiency and satisfaction in a specified context of use. [13] On-line dictionary Merriam-Webster defines efficiency as an effective operation as measured by a comparison of production with cost (as in energy, time, and money). Efficiency in the usability context is usually measured as time con-
14 8 sumption of a specified task. By effectiveness, the standard means the rate of goal completion; whether users can do what they set out to do. By satisfaction, the standard means the users feeling of the ease of use of the product. Usability is contextual. For example, even if some product would be highly usable for ITprofessionals, handing over the same systems for novices in computer use would most likely not yield good results. When considering usability, following things should be considered: the users of the system, the goals of the users and the context of use. 2.4 Co-experience Battarbee & Koskinen note that some experiences and situations are only possible, when there is interaction between multiple people and a product [14]. Battarbee & Koskinen define co-experience as user interaction that is created in social interaction. Co-experience in context of user experience, by the definition of user experience [8] could not exist without a product or system being present. Battarbee & Koskinen present three dimensions that can be used for understanding the nature of co-experience [14]. These dimensions are explorative-organized, synchronousasynchronous and creation-interpretation. Explorative experiences are not planned in advance, whereas organized are. Organized experiences have a distinct beginning and end, while explorative experiences flow spontaneously from one to another. Synchronousasynchronous axis considers the form of communication happening during the experience. For example, in an intense viewing situation, a remark may be answered after the play situation is diffused or maybe even after the period has ended. Creation-interpretation are the ways the experiencers create meaning for each other for the particular experience. Forlizzi and Battarbee use three categories to represent user experience: experience, an experience and co-experience. Two of the former are explained previously, but especially interesting in the scope of this thesis is co-experience, since arena experience is a social event. The model suggests that the meaning of some experiences is only interpreted in social, rather than personal, context. In ice-hockey context this could for example mean that a roughing penalty for the team the spectator is rooting for could either be seen as a display of fighting spirit or as a game losing mistake, depending on how co-viewers interpret it. Even loss of your own team can theoretically be turned positive, if the community chooses to interpret it that way. According to Forlizzi & Battarbee, the expression of emotion is different when in company versus alone, social norms dictate how you can portray emotion in a given social situation. [15]
15 9 2.5 User experience goals An experience goal has been defined as an intended momentary emotion or the emotional relationship that a person has with a service [16]. An user experience goal focuses on emotional aspects of experience and it states the wanted experience concisely [17]. UX goals can be derived from different sources: brand, theory, empathy, technology and vision. [17] Brand creates and unified product vision between sibling products. Theory uses existing research to as basis for defining UX goals. By using empathy, designers can envision the users mindset as basis for design. Technology enables and creates challenges for products UX. Vision uses other domains as inspiration for UX goals. Kaasinen et al. argue that using multiple of these approaches may reveal conflicting goals. Also, similar UX goals may be revealed by the different approaches, thus revealing their importance. [17] Table 1. Benefits and challenges of the approaches to defining UX goals [17] Approach Benefits Challenges Brand Theory Empathy Technology Vision Pre-defined easy to share vision of UX Evidence based on scientific research for UX goals Supports decision making beyond goal-setting phase UX goals support the adoption of technology UX goals support creating something new The UX goals have to be interpreted for new products Which theory to choose It may be difficult to gain deep enough perspective of users Chosen technology may not fit all needs of use User acceptance of new vision Cooper [24] presents also goals that reveal the motivations behind the use of the system: life goals, end goals and experience goals. Life goals mean who the user wants to be. End goals consider the usefulness of the service: what the user wants to do. If the end goals are not met, product is not worth the time and money invested in the use. Cooper defines experience goals as what the user wants to feel. Cooper argues that in most cases, end goals are the most important to consider when designing a new service.
16 Creation, evaluation and analysis methods for user experience design As UX has matured as a part of the software development business a multitude of methods for designing have been developed. Since no universal template for design has emerged, methods have to be decided based on case in hand and by software development method. In this section, a selection of design methods is introduced. First, an overview of possible design methods are presented. Then, the methods important for this work are discussed in their own sections. Michailidou et al. present a method toolkit for user experience design (UXD) [18]. In the toolkit they list methods, the phases of design they are appropriate, their benefits for user experience design and the authors recommendations for use. Michailidou et al. divide design into three parts: analysis (A), creation (C) and evaluation (E). Analysis means gathering data and processing it into usable format. Creation is what is usually seen as the actual design work, creating the design idea for solution. Evaluation means examining whether the design idea is successful or not. The methods gathered by Michailidou et al. can be seen in Table 2.
17 11 Table 2. Creation, evaluation and analysis methods for UXD [18] Method Phase Benefits for UXD Recommendations for UXD Mood board [19] A, (E) Visualizing the vision for the development project in a comprehensive way. Use of mood boards to visualize the brand image and first development direction, extended by a narration. Storytelling [20, 21] A Collecting user insights with focus on their underlying motives and needs. Use of Storytelling to collect user insights and documentation/ structuring as story elements [19]. SWOT analysis [22] A Analysing different dimensions of a topic and defining development goals. Intensive Strength & Opportunity Analysis to define UX-chances (starting points for new positive UX). Persona [23, 24] A, (E) Giving data and statistics a human face. Creation of market-specific customer profiles based on real data on usage, environment and emotional behaviour Metaphor/Analogy design[25] C Anticipating experiences and communicating their emotional impact. Use of Emotional Mental Models [24] and image-based metaphor representations. Use scenarios [23, 27] A, C, E Promote holistic understanding, derive requirements and insure design targets. Creating UX Stories, because of their special characteristics which go beyond use scenarios [19, 26]. Requirements list [29] A, E Creating measures for the design success. Extension of requirements list by a UX story visualized as Storyboard [26] and use of Kano-model [27]. TRIZ principles [30] C Overcoming contradictions and/or getting inspired by principles and patterns. Use of UX Principles [29] derived from successful experiences descriptions as inspiration for UXD. Experience prototypes [32] Function modelling [29] C, E Making the essence of UX visible. A, C Structuring the product in manageable parts and exploring their relations. Use of experience prototypes during the whole process, combine different forms (e.g. hardware with UX story). Use of user-oriented and relationoriented function modelling extended by emotional effects. Design structure matrix [33] A Manage complexity, explore relations, and create function clusters. UX-related domains, mapping between functions and UX-elements
18 SWOT Analysis SWOT analysis (acronym of terms strengths, weaknesses, opportunities, threats ), is a tool for strategic analysis. It is a low cost method for market analysis. SWOT can also be used for decision making in UX problems [34]. SWOT s benefit is the low cost and speed in aiding the decision making process. [35] As its name suggests, SWOT analysis maps company s strengths and weaknesses as well as the existing markets opportunities and threats as basis for decision making. Figure displays the division of internal and external factors, and the components of the SWOT analysis. The components of SWOT analysis can be seen in Figure 2. Figure 2. SWOT analysis model Internal factors address the organization, which is performing the project, whereas external factors address the situation of the existing market (competitors). The competitors that are analysed can either be direct or indirect. Direct competitors have the same user end problem that they try to solve, and may share users. Indirect competitors have some overlap in the user base and functionality. [36] Strengths are organizational qualities that have a positive effect on the company s development and its ability to compete in the market. Weaknesses of the company are the opposite of strengths: the aspects of an organization that have a negative effect on the de-
19 13 velopment and competitive capabilities. Opportunities mean the possibilities the organization has considering the market situation. Threats are the external factors that may hinder organizations strategy s success. [37] Probert presents a framework for using the SWOT model. First identify the strengths of the company, then the weaknesses. After that focus on the external factors and identify opportunities and threats. After identifying these factors, establish a strategy. [35] When developing a software idea, the SWOT method may help in understanding you applications market fit, avoiding fails in the design phase and in revealing strengths and opportunities for the application. [34] A number of questions can be asked to determine the strengths, weaknesses, opportunities and threats for an application idea. SWOT is best used in the early development phase, before implementation takes place to save wasted resources. A list of example questions can be found in Table 3 [37]. Table 3. A question set for SWOT in software development. [37] Strengths What advantages does your idea or business have? What unique selling proposition do you have? What does your app do better than anyone else? Are there any unique resources you can draw upon? What is the final goal that you define as a sale? Opportunities What trends and technologies can you implement? What weaknesses of your competitors can you use? What opportunities can you get when scaling your idea? Weaknesses Threats What improvements could you bring? What should you abandon? What do your users consider as weakness? What characteristics of your product do negatively affect your sales? What are difficulties you might face? How do your competitors overcome threats? How do quality standards influence your mobile app or idea? Will your mobile app be ready for changing technologies? Have you made sure that you will not have funding problems?

20 14 SWOT analysis gathers information about a competitor in one easily glanceable table. The method can be also used to conduct UX research. An example table for a mobile application competitor analysis using SWOT can be seen in Figure 3. Figure 3. Example of SWOT used for UX analysis for a mobile application [34] According to criticism, because of the descriptive nature of the model, it does not provide any concrete directions for the decision-making process. Because the process does not include prioritization of factors, users of the process may end up focusing on factors that are not important. This may lead to time waste and loss of resource. [37] Some information generated by the SWOT process may also prove useless [34] Personas Personas are a tool for analysis and evaluation phase for user experience design. When enough data is gathered, researchers look for patterns in the data. Based on this data, a consolidated archetype of a user group, presented in form of one single user, is constructed. This is called a persona. The use of personas is to create a humanized example of an abstract user group for developers, and this way provide meaningful direction for development. [38, 39] Personas are useful in determining necessary requirements and behaviours of a product. Personas are useful when communicating the product vision with stakeholders, and also help in keeping the design and implementation focused on real users. Personas can be used for quickly evaluating the viability of new product ideas. [40] Personas should always be based on user research. [40] By personifying an abstract user group, personas invoke empathy. This helps stakeholders and engineers think about user as a real human being Subsequently this helps them become more interested about the experience of the user. [40]

21 15 Personas are usually concise enough to be fit in one sheet of paper. Personas usually include the following: a name, photo, narration of user s life situation, their goals and important behaviours related to the design [38, 41, 42]. The persona may be presented in text form, but some aspects may also be visualized with graphs or images. The maximum number of personas per project should be limited, for example five personas, to avoid targeting outlier groups. A goal is to find a single, primary persona, to whom target the design, and whose goals can be satisfied with the design. Secondary personas, whose needs mainly are covered by the primary persona but may contain some additional needs, may be identified. [43] Tools, such as the affinity diagram, may be useful when constructing personas. [40] Personas are a method of communication, and they should be on open display to the designers and development team to aid discussion. They may also be used as justification when communicating with stakeholders. An example of a persona can be seen in Figure 4. Figure 4. An example persona [43] Cooper et al. suggest using three levels of user goals when creating personas. These levels of goals are life goals, end goals and experience goal. When creating personas, these goals must always, directly or indirectly, have something to do with the usage of the product. Cooper et al. propose end goals make up the majority of useful goals when considering persona creation. Consumer products usually benefit more from taking life goals into
22 16 consideration when compared with enterprise products. Usually one experience goal is enough per persona. [40] Experience goals describe how users want to feel while using a product. End goals are users motivations for performing the underlying task by using the product. Life goals are users long term wants and needs, which explain users end goals. [40] Cooper proposes an eight-stage process for constructing personas. [40 p. 81] 1. Group interview subjects by role 2. Identify behavioral variables 3. Map interview subjects to behavioral variables 4. Identify significant behavior patterns 5. Synthesize characteristics and define goals 6. Check for redundancy and completeness 7. Designate persona types 8. Expand description of attributes and behaviors Context scenarios Scenario, as the concept is known in HCI today, originates from the 1990s. Carroll describes these scenarios as a way to describe how users accomplish tasks, and according to him, context scenarios goal is to help guide and coordinate the design project. Carroll describes these scenarios through an abstract character he calls agent or actor, a vague abstraction of user. The actor is often named and characterized using a work title or other fitting high-level abstraction. [44] Scenarios are a method for analysing, evaluating and creating design. Cooper et al. built their framework using the same idea as Carroll, but they replaced abstract actors with actual representation of users, personas. Cooper et al. call these scenarios context scenarios, differing from Carroll s scenarios by grounding the intended design to a tangible representation of the user. Context scenarios are a tool used to breach the gap between design intentions and actual implementation, and also as a way to communicate early stage ideas. As context scenarios use narration as a story telling method, they are also a powerful tool for guiding imagination, thus helping create new, innovative solutions. Context scenarios have to be based on data gathered from user research to ensure that design efforts are guided towards solving actual users actual problems. Cooper summarizes context scenarios as concise narrative descriptions of one or more personas using a product or service to achieve specific goals. [40 p. 102] Cooper et al. present three types of persona based scenarios. Context scenarios describe how the product could satisfy the personas needs in the best way possible. After the design process has evolved to the point, where products data elements and functional elements are constructed, context scenarios are revised. The scenario is modified to describe the users interaction with the product in greater detail. These scenarios are called
23 17 key path scenarios. Validation scenarios are more vaguely described scenarios, which are used during development to see if the developed features still fit the need of personas. [40] Scenarios should be used to extract design requirements. A meaningful context scenario narrates a persona s interaction with the designed product, taking into account the environment, motivations, needs and goals. Context scenarios describe the moments when the persona typically interacts with the system. Describing persona s interactions in context scenarios should be kept high-level, focusing on the user perspective. The focus of the context scenarios should be in the future: how would the system ideally work in the viewpoint of the user. [40] Cooper provides an example list of the questions context scenarios address [40 p. 113]: What kind of settings the product will be used in? How long is the usage time? Are there interruptions in use? Are there multiple users on the device? Are there other products used at the same time? What are the primary activities the persona needs to perform to accomplish his/her goals. What end result persona is expecting? Scenarios are presented in writing and remain at high level of abstractions to focus more on the user rather than details of the solution Affinity diagram Affinity diagram is an analysis tool used for a variety of purposes, which include consolidation of contextual inquiry data and interview data [45, 46], idea generation [47, 48] and consolidating usability test data [47, 38]. When constructing an affinity diagram based on contextual inquiry or interview data, all meaningful findings (approximately from a single contextual inquiry) are typed on separate post-its. Notes, with several themes are divided to multiple notes so that every note contains only one theme. If notes share a theme (for example, problem or an affinity), they are grouped together, and labelled based on the common theme. Groups are given a label based on the common theme. After this initial grouping, these first level groups may be further grouped into larger themes if necessary. During this process, notes may also be move do another category, if it is seen as better fit. [45, 38] Figure 5 depicts a typical hierarchy in an affinity diagram.
 Affinity wall is usually constructed on large sheets of papers to maximize the portability of the wall. Post-it s are typically used, as they are easy to rearrange.")
24 18 Figure 5. Example hierarchy of an affinity diagram (Image: Affinity wall is usually constructed on large sheets of papers to maximize the portability of the wall. Post-it s are typically used, as they are easy to rearrange. The wall should be documented when it is finished. Photographing the wall is a common solution User Experience Questionnaire User experience questionnaire (UEQ) is an analysis tool. It is a question set for gathering quantitative data about a service s user experience [49]. Typical use cases for the questionnaire are comparing user experience of two existing products, testing a products user experience or finding out where an existing product could be improved. The questionnaire consists of semantically differential questions regarding different aspects of user experience, called scales. It uses Different scales can be seen in Table 4. Other scientifically validated questionnaires exists. One widely used UX questionnaire is AttrakDiff, which measures a product s pragmatic and hedonic quality and the product s attractiveness [50]. Table 4. Scales of the User Experience Questionnaire [49] Scale Attractiveness Efficiency Stimulation Perspicuity Dependability Novelty Description Overall feel of the product. Whether product is liked or disliked. How efficiently can the user solve tasks with the solution? Is the solution exciting? How easy the product is to use. How well user feels in control of the solution? Is the product new and creative? Does it catch the interest of users?

25 19 The scales have altogether 26 questions. The order of the questions is randomized among categories, and the order of the axes in individual questions is randomized. All questions have a 7-stage scale. If certain scales are deemed not useful, they can be left out of the questionnaire [51]. The scales must be excluded in whole, and no individual questions should be left out to preserve the validity of the test. When used online, the answerers of the questionnaire may include persons, who do not answer seriously. This phenomenon can be addressed by looking at answers within a scale, and determining if they are at least somewhat similar. If multiple scales have high distances between answers, it can be deducted that the user has been answering randomly. [51] The UEQ provides a data analysis tool, which calculates mean, variance and standard deviation for individual scales. Figure 6 depicts example results for an example product. Values between 0.8 and -0.8 represent a neutral result, while higher values are positive and lower negative. Values range from very good (3) to very bad (-3), but because of the answering tendencies it is extremely unlikely to see values over 2 or under -2 [51]. Figure 6. Example result figure of UEQ data analysis [51] The UEQ data analysis tool provides a benchmarking. The benchmark consists of answers from 246 studies and over 9000 individual answers. An example figure for the benchmark is depicted in Figure 7.
![20 Figure 7. Results for an imaginary solution using the UEQ benchmark. [51] The benchmark assigns a category for each scale. The meaning of these categories are explained in Table 5.](/docs-images/114/209008383/images/26-0.jpg "Table 5.")
26 20 Figure 7. Results for an imaginary solution using the UEQ benchmark. [51] The benchmark assigns a category for each scale. The meaning of these categories are explained in Table 5. Table 5. Categories for UEQ benchmark [51] Category Excellent Explanation In the range of top 10% of the results Good 10% in the benchmark set are better, 75% worse Above average 25% in the benchmark set are better, 50% worse Below average 50% in the benchmark set are better, 25% are worse Bad In the range of worst 25% of the results 2.7 Summary In the context of this work, the experience in an arena consists of two things: the usage of the application (user experience), as well as the experience at the arena itself (an experience). As previous research suggests, the application should not stand in the way of the experience of the spectatorship, instead it should concentrate on enhancing it. As the viewing is often done with friends or acquaintances, creating co-experiences is possible. The explorative-organized and creative-interpretative aspects of an ice hockey game are
27 21 especially interesting when designing for an ice hockey match: can we make the organizing of the event easier? Can we support users communal creativity? Älykiekko also provides a way to present novel smart data to support spectators knowledge of the game. The methods presented in this chapter provide a toolset for gathering data about the nature of the viewing experience and the needs of users, creating a design supporting these findings and evaluating the success of the design. The main focus of the presented toolset is to be practical. The tools listed are also usable with a small development team. SWOT analysis is a low cost method. Data analysis using an affinity wall and constructing scenarios and personas provide good means of communication for passing it through to the rest of the development team.
28 22 3. LIVE ICE HOCKEY GAME AS AN EXPERIENCE CONTEXT This chapter describes ice hockey from the point of view of a spectator. First, general introduction to the game is presented. The rules of ice hockey are covered to an extent which is deemed to give a reasonable understanding of ice hockey as a spectator sport for the reader of this thesis. Then, spectatorship as a phenomenon explored using existing theory. 3.1 Ice hockey Ice hockey is a fast-paced team sport. It is the most popular sport in Finland [52], with over amateur players and over licensed player, over 10 different leagues operate within Finland [53]. Ice hockey is a wide spread sport that is mostly played in the Nordic countries and in northern America. National hockey league, NHL, is a north American institution, and the arguably the most prestigious league in the world. The franchise based on NHL include a popular video game series, collector card series and clothing. Competitively, ice hockey is played in indoor arenas, but amateur games may take place in outdoor arenas as well. The sport is played on ice, where players wear skates. The players try to score goals by moving the puck inside the opponent s goal using their sticks. The sport is played with 6 players on the rink from each team: 5 regular players and 1 goaltender. A typical game has 3 periods of 20 minutes, with 15 minute intervals between. Body checking (slamming your own body against the opponents) is allowed, and injuries are not uncommon in games. Tensions run high between players, and fistfights between players sometimes break out during matches. The game events happen quickly, and especially plays around goals may be hard to perceive (Figure 8).

29 23 Figure 8. A typical ice hockey play situation Even though there are is no universal set of rules for hockey, there are two widely used sets of rules, which cover most professional ice hockey games: the National Hockey League (NHL) rulebook and the International Ice Hockey Federation (IIHF) rulebook. The rules for official ice hockey are a complex document of over 100 pages and 226 different rules. Even though the rule sets are vast and may differ, main structure of the game remains similar everywhere it s played. The game consists of 3 periods of 20 minutes, possible overtime and a possible shoot-out contest. Between the periods are breaks that vary in length depending on the rule set used. In this chapter, rules for SM-liiga [54], which differ in some respects from the IIHF rules are used as an example. The game starts with a face off, where players compete of the possession of the puck with their sticks, after the referee drops the puck onto the ice. This is called a face off, and it s repeated every time there is a stoppage in the game. Both teams try to put the puck into the opponent s goal with their sticks. The team with most scored goals after the game is the winner. A goal is considered valid, when the puck has gone completely over the goal line inside the goal. If there is an unclear situation about whether the puck going inside the goal, the referees may consult a video recording of the play. The video recording may be used only for resolving situations considering scoring. No other plays may be reviewed by the referees, they have to make the best judgement possible from what they have seen during
30 24 the actual play. The decision made by the referee are final during the game. They cannot be attenuated even after the game, but they may be made harsher by an expert review. One of the most important rules to know when spectating ice hockey is the offside rule. An offside is called, when a player is in the opponent s defence area before the puck. This rule is placed to prevent opponents from waiting around opponent s goal for long passes, since it would make gameplay uninteresting to spectate. The referees may sentence players to penalties. For minor offenses, such as tripping another player or having too many players on ice, the referee may sentence a two-minute penalty, called a minor penalty. For more serious offenses a double minor penalty, four minutes, may be sentenced. For more serious offenses that may physically harm another player, such as checking (body slamming) a player from behind, a game misconduct penalty may be sentenced. The rules are complex to learn, and especially learning how to observe them in real time is difficult in such a fast-paced sport. 3.2 Venue The event itself takes place in a special venue. High profile games draw a lot of spectators. For example, the largest indoor arena in Helsinki seats over 13,000 spectators and the largest arena in Tampere 7,300 spectators. Tampere is currently building a new, larger arena to facilitate around 11,000 viewers. Official games are most often played in indoor conditions, but sometimes show matches are played in outside rinks as well. The IIHF rulebook does specify if the arena should have a roof or not, as long as the condition of the ice, boards and markings on ice are as specified [54]. Because the surface of the rink has to stay frozen, temperatures in an indoor arena in the vicinity of the rink may be as low as -5 degrees Celsius, but further away from the ice, the temperatures rise, to around 10 degrees Celsius [55]. Viewers have to dress accordingly or have to move to generate heat to stay warm during the whole game. Visibility to rink depends on the location of the seating. Some arenas feature terraces, areas stripped of seats, where the game is viewed standing up. Usually the seating in the stadium is constructed so that the seats further away from the rink are higher up to allow visitors to see over the persons in front of them. Thus, seats closer to the rink get closer to action, but it may be harder to see to the events at the other end of the rink. The seats higher up in the stadium get a better overall view of the game, but especially to viewers with poor eyesight, it may be hard to see all the details of the events. The rink is enclosed with boards that are approximately 1 meter high [54], and especially if sitting further away from the boards, covers some of the action happening near the boards. The teams change sides between periods, so that they play on the same side at least two periods of the game [54]. This may affect the preferred seating of spectator, if they would like to sit
 Some stadiums have restaurants or kiosk s where snacks and beverages can be bought.")
31 25 at the end of the rink and see for example their preferred team attack closer up. As can be seen in Figure 9, it is difficult to see the events clearly on the other side of the rink. Figure 9. Hakametsä ice hockey arena (Photo by Roopeank, CC BY-SA 4.0, Some stadiums have restaurants or kiosk s where snacks and beverages can be bought. Some of these restaurants are only open between periods, and may experience a rush of customers during this short, minute period. If the restaurant serves alcohol, Finnish legislation forbids taking the alcoholic drink away from the restaurant premises. Venues differ in the level of equipment they have and services they provide. Some venues provide narration of the game through a public audio system. Some arenas have a display that shows a scoreboard and may have screens to display additional visual information. For example, as can be seen in Figure 10, in Hakametsä ice hockey arena, the score and the remaining time of the game is displayed, along with video material of selected match events. The video material includes replays of the events in the game, as well as team and player introductions before the game.
 During intermissions of play (between periods), some ice hockey teams arrange entertainment or competitions for viewers.")
32 26 Figure 10. The video screen of Hakametsä ice hockey arena (Picture by Nataspop, CC BY-SA 3.0, During intermissions of play (between periods), some ice hockey teams arrange entertainment or competitions for viewers. These can include things such as cheerleader dance shows and competitions for audience. The competitions vary greatly, from raffles in the form of roulette displayed on the video screen to games where the audience members have to get the puck through a small hole in a board that s covering the goal. In Hakametsä arena, these events are announced through the loudspeakers when an intermission starts. 3.3 Spectatorship Ludvigsen et. Al [56] studied the nature of spectatorship. They argue that spectatorship is an active, rather than a passive experience. Crawford [57] also supports this thinking. Ludvigsen et al. argue that sport spectatorship consists of three elements: the sport, the event and a social aspect. The model, called SPEX, can be seen in Figure 11.
![27 Figure 11. SPEX-model of spectatorship [56] The sport itself consists of ongoing and previous events of the game and the team, the viewer s previous knowledge.](/docs-images/114/209008383/images/33-0.jpg "The event itself consists for example of eating and drinking, the viewers traditions regarding the event.")
33 27 Figure 11. SPEX-model of spectatorship [56] The sport itself consists of ongoing and previous events of the game and the team, the viewer s previous knowledge. The event itself consists for example of eating and drinking, the viewers traditions regarding the event. Spectatorship also consists of the social aspect regarding viewing the game: fan culture, viewing the game with family and friends. There is also overlap between these three elements. Forlizzi & Battarbee s co-experiences (presented in Section 2.4) also plays a role in the social aspect of spectatorship [58]. Ludvigsen et al. argue that since the sport itself is only one part of the whole spectator experience, creating a solution that only provides data about the sport may be useful to some spectators, but rather there is a need for applications that address other elements of spectatorship also, mainly the social aspect. They argue that these kinds of solutions have the potential to enhance shared experiences between spectators [56]. Ludvigsen argues that the most engaging level of social interaction is collective action, where people work towards a shared goal [59]. The ritual of spectatorship spans on a longer time period than the viewing event itself. Fans dress up in merchandise before leaving for the match, follow broadcasts, news and gossip around the teams and converse about the upcoming match. [57] Fairley argues that the social relationship between spectators is a bigger motivator than the sports match itself [60]. The social atmosphere of the arena has been noted as one of the motivating factors for going through the trouble of going to an arena to spectate a game [57]. Some spectators
34 28 also want to be active creators of the social atmosphere on the arena, and that way participate in the sport. [61, 62] Spectators also want to chant, sing and celebrate during events [63]. The experiment conducted by Ludvigsen et al. also suggest that users are more likely to engage in external activities, such as games, when the intensity of the game is low. This can be interpreted so that in a live spectating situation, users usually choose to pay attention to the game rather than something else that tries to grab their attention [56]. Esbjörnsson et al. also describe spectating as an active event where user socialize with each other, and try to place the events they witness into a larger story. In ice hockey, an example could be a player initiating a fight with a player, who had body checked him in a previous game. The study also notes the social aspect of spectatorship. Spectators want to converse about what they see. The study also notes that technological solutions designed for spectators should not isolate viewers from this important social interaction, but rather try to make the event more social [2]. 3.4 Summary The studies presented in this chapter reveal that spectatorship consists of much more than passive viewing of the spectated sport. It is an active, social phenomenon. For spectators, ice hockey match is a social context, where they can get together with their friends and family, eat and drink, catch up with each other or discuss about the events happening before them. The sport, social aspect and the event all intersect in form of cheering at the sport with fellow fans and displaying enthusiasm with various equipment. The resulting solution should take into account that for some fans, the social element may weight more than the sport itself, and the solution should try to support this social aspect of spectatorship. If possible, the solution should be designed so that it can be used during the low intensity periods of the game. The spectators also wish to place the events happening in game into larger context. Ice hockey also has complex rules that may be difficult to learn and follow, especially for novice viewers. Some game events may be hard to perceive because of location of seating or because of the fast nature of the game.
35 29 4. RESEARCH PROCESS The research goals for this thesis were to research the characteristics of good user experience for a mobile application for ice hockey spectators, and also to test if the implemented design would provide value for ice hockey spectators. First this chapter introduces the timeline of the process. The phases of the project are divided in the sections of this chapter. These sections include the overall description of the phase and the related methodology. The project was initiated in February The idea was pitched by one of the design engineers, and based on that, decision was made to start working on the project. During this initial phase, the team consisted of an UI designer (freelancer), two design engineers and a project manager. The idea was to produce a functioning product, and deliver it to a client, who would function as a pilot testing platform. Before the author of this thesis joined the project, initial mock-ups of the idea and sketches of the UI were drawn. Idea was then presented to a potential customer, who agreed to be a pilot team for the application. When the author of this thesis joined the project, some UI-pictures existed, along with written and unwritten ideas about the project. When the author of this thesis started working on the project, in early May 2017, some of the back-end implementation had already taken place and features for the front end were more or less decided upon. There was a somewhat functional, interactive invision prototype that was used as basis of design. The design idea was communicated to the author of this thesis mostly verbally and through examining the interactive prototype. To guide the project to better fit actual user needs, user centered design approach was introduced to the project. In the middle of May 2017, more software developers were allocated to the project, and the speed of implementation began rapidly increasing. In the end of July 2017, the team consisted of 11 members. The aim for the project was to have a minimum viable product for closed testing by the 11 th of August 2017, when the first official games of the season of would be played, and the system could be tested in a real environment for the first time. Before any front-end implementation took place, a competitor analysis was conducted. Shortly after the front-end development had begun, an user study with interviews was conducted using a high-fidelity prototype. In July 2017 the first user study was planned, and in July participants were recruited and test times were scheduled. The maximum user study sessions was 3 per day. After user studies, during late July and August user studies were analysed together with fellow UX designer, Lauri Inkeroinen, who joined the development team in late July. During august, personas were created based on the study results
36 30 and an affinity wall was constructed based on the findings from interviews. In January 2018, around 3 months after the launch of the application, validation of the success of the design was conducted. The timeline of the process is illustrated in Figure 12. Figure 12. Timeline of the research process The focus of the user research was to gather data about the experience in the ice hockey arena and users relationship with ice hockey and their reasons for watching it, and how
37 31 to enhance the experience with a digital solution. Secondary focus of the interview was also to validate the applicability of the SPEX-model to Finnish ice hockey fans. Research data consolidation focused on creating usable tools to aid development. Design validation was conducted to measure the success of the applications user experience. 4.1 Competitor review Services chosen for the competitor review were chosen in collaboration with the development team. When creating the idea for the service, there were no direct competitors to Älykiekko. There were no findings of others using similar technology solutions to provide data for spectators. However, multiple indirect competitors were found. During competitor review, user tests were not yet carried out, so this thesis worker researched competitors based on the features ideated for the application. These features included food and drink ordering in the stadium, ticket purchases, smart data about the game using Älykiekko, general statistics about SM-liiga, ice hockey team related news and team member introductions. Based on these features, three indirect competitors were found. HIFK application provides general information about the Finnish ice hockey team HIFK. The application features video interviews of players, ticket purchasing, team member introductions and statistics about SM-liiga. Yonoton is a food and drinks ordering solution, spesifically meant for stadium usage. The main feature of the Yonoton is the mobile application, where users can order food to be picked up from different restaurants at the arena. Users can choose their desired delivery time. At the checkout, Yonoton shortens the queuing time by letting users scan a QR code delivered on their phone, thus reducing the time usually spent for paying. Wolt is a widely used application for ordering food from restaurants. Users can choose between ordering in, picking up the order from the restaurant or eating in. Wolt employs couriers, who deliver the food without the restaurant having to employ extra personnel. These three competitors were analysed using SWOT. The analysis was done by the thesis worker, the results were then discussed within the development team and the findings were used as justification for including or excluding new features. 4.2 User research To gather data from users needs and the context of ice hockey spectating, user research was conducted. The research consisted of a background questionnaire, interview, prototype test, and after prototype test a short interview about the prototype. This thesis uses the term user research to reference this phase of development.
38 32 Because of the time limits for the project, there were a total of eight participants were recruited for user research. There were three persons present when the research was conducted: the participant, and two team members. One of the team members focused solely on interviewing and moderating the situation, and the other was responsible for video recording of the situation and note taking. There were no convenient ways of having observer in different rooms or otherwise not visible for the user. The observer was located in the same room, visible for the participant. Before the interview began, users were asked not to pay any attention to the member, and they were told of his role as a quiet observer. At first, there were 17 interview questions. After the first interview, which was considered to be a pilot interview, 4 questions were dropped out and some questions were modified. The questions that were left out were either providing duplicate data or they were deemed unnecessary. As the first session lasted for nearly 60 minutes, the team decided that due to constraints of time, the sessions should be made shorter. In the end, the length of the interviews ranged from 25 minutes to 60 minutes, an average being around 40 minutes Recruitment procedure and participants Recruitment for user research was done two ways: asking for volunteers from inside the company, and from acquaintances of the researchers through social media. Table 6 shows the participant characteristics. Five out of eight participants were working for Bitwise at the time of testing. These participants were neither working for the project, nor had explicit knowledge about the features of the project. All the participants knew about the theme of the solution being developed and the target customer Tappara. The test subjects recruited from inside the company were chosen because of convenience and also as a method to introduce user-centered design methods to other developers. Table 6. Participants of the user research Participant code P1 P2 P3 P4 P5 P6 P7 P8 Gender m m m f m m m m Age Employee of Bitwise x x x x x Games watched live last season ( ) Games watched from TV last season ( )
39 33 The users amount of games visited and age was confirmed verbally or in instant message services before recruiting them to the test to ensure that all segments would be represented. Before recruiting others, one participant was recruited to function as an initial test, and to see if the test would function as wanted, and if there would be need to modify the structure of the user research setting. After the initial test, rest of the participants were recruited. The participants were chosen based on two variables: age and fandom, which was measured by the amount of live games visited last season. The aim was for the participants to be of different segments regarding age (young-old) and fandom, which was measured by the games visited last season. In total, eight participants were recruited, two from each combination of age and fandom. Some interviewees had viewed only a couple of games live, whereas some had watched every game of Tappara during the ongoing season. four interviewees had only viewed a couple of games, and the rest were deemed as fans, who had participated in at least five live games last season. This division created a sample size of two participants per group (Table 7). Table 7. Different categories of interviewees YOUNG OLD AVID FAN Young avid fans Old avid fans NOVICE VIEWER Young novice viewers Old novice viewers Avid fans had visited over 7 hockey games live on last season of play ( ). Young users were aged years old, and old users age ranged from 28 to 40. The initial hypothesis was that there are different needs for users who are avid fans of hockey, compared to those who visit the games occasionally. Furthermore, it was hypothesized that young users have different needs and use cases for the application than old users Interview and prototyping sessions The sessions with users consisted of a background questionnaire to gather demographic data about users, an interview session and a prototype testing session. The prototype session was conducted using think aloud method and using an invision prototype on iphone. The length of the sessions varied from 25 minutes to 60 minutes. The sessions were all filmed. All interviewees signed a contract agreeing for filming the test and that the results would be used for commercial purposes and as material for the thesis. There were a maximum of 3 interviewing sessions per day, and all interviews were conducted within 2 weeks.
40 34 Before the test, user background data was gathered by asking the users to fill a short questionnaire. Aim of the questionnaire was to gather data about the nature of the users relationship with ice hockey, and about their habits when watching a game and when visiting a stadium. As there were multiple persona hypotheses, it was necessary to gather quantitative data about users fandom to be able to single out different user groups. Users were asked to evaluate their interest and fandom using the Likert scale [64]. Other questions were multiple choice, and focused on gathering quantitative data about viewing habits when watching an ice hockey game live. Questionnaire in whole can be found in Appendix 1 and interview questions in Appendix 2. In the sessions, there were two researchers present. One acted as the interviewer, and the other researcher operated the camera and took notes. Before testing began, interviewees were instructed not to pay attention to the camera operator, and to act like he was not present in the room. First the users filled out a background questionnaire. Then the interview was conducted. After the interview, the users were explained the think aloud method and how to act in the prototyping session. Also, after the pilot session, it was deemed necessary to instruct the users about limitations of the prototype. Since the prototyping was conducted using a smart phone, the pilot user tried to perform gestures that the prototype was unable to perform. After the prototyping session, the users were given time to give feedback about the session while the camera was turned off. The interviewees, who were not employers of Bitwise were rewarded with a movie ticket for participating. The interview and prototyping data was all consolidated right after the session to avoid problems caused by human memory, and parts that were unclear were confirmed from the video recording. Before testing, design team made a hypothesis about the personas based on existing domain knowledge. The hypothesis was made based on best guesses about ice hockey fans, and to act as a validation tool after the interviews were made. Four types of personas were assumed. First hypothesized persona was an older man, who has been an ice hockey fan for decades. He strongly identifies as a fan of Tappara. He has a smartphone which he uses mostly for calling and sometimes looking up information on the internet. He does not use a lot of applications, and does not want to spend time learning about functionalities. Interesting features for him was hypothesized to be ordering food and checking match results in real time. Second assumed persona was a younger person, who is a native smart phone user. He goes to the games once in a while, mostly to spend time with his/her friends. Most interesting features for him were hypothesized to be buying tickets beforehand, ordering food and participating in stadium games to compete against his/her friends.

41 35 The third type of persona assumed was an avid ice hockey fan between years old. design. This group was thought of being the most likely user group. It was also hypothesized that the most interesting feature of the application would be seeing intricate data about game situations and deepen the knowledge about the game he/she is watching. The application was tested using a high-fidelity prototype. Prototyping method, high fidelity instead of low fidelity, was chosen based on the state of the project, available resources and because high fidelity testing fit Nielsen Norman Group s checklist (Figure 13) [65] for choosing the form of prototype. Figure 13. Checklist for deciding prototype fidelity [64] All list items were thought satisfied when comparing to our prototype. Most importantly, list item 6, the importance of testing the flow of the application was deemed important, since initially the ease of navigation was deemed a high priority. This was because of a
42 36 study suggesting that users should not be distracted from the actual viewing experience with applications [2]. The prototyping session consisted of 6 assignments given to user on sheets of paper. The assignments can be seen in Table 8. Table 8. Assignments used in the prototyping session Assignments used in the prototyping session 1. Register to the application 2. Order 12 pieces of wings with hotness setting hot 3. Find the overall amount of points player Aleksi Elorinne made this season 4. Find the score of ongoing game Kärpät-HIFK The testing was conducted using think-aloud method [66]. Before the actual test, users were first informed about the limitations of the prototype and think-aloud method was explained. After that, the users started completing the given assignments. After completion of the final task, users were supposed to arrive to a certain view. Had users failed the task, they would ve been moved to that view. The last view that resulted, was then explained in further detail. The explanation was deemed necessary, since the dynamic nature of the data was impossible to present due to limitations of the prototype. After the prototyping session, a small interview of 6 questions was conducted concerning the prototype. 4.3 Research data consolidation The interviews produced a large amount of research data, and the results were analysed with the help of constructing an affinity wall. The interview notes were printed, and cut up in sentences that encapsulated some form of finding. The notes were then grouped together based on similarities and categorized. Then a second round of grouping was done, and the categories from the first grouping round were grouped and labelled. If there were notes that fit better in categories that emerged later in the grouping process, the notes were moved to the category that fit them best. If the sentence was deemed to represent multiple different ideas, it was duplicated and placed in multiple categories. If there were some notes that contradicted others, they were added next to the notes they contradicted and the contradiction was marked using a lightning shaped arrow. Initial notes from the sessions can be seen as white, first level categories as yellow, second level
43 37 categories as bright yellow and third level categories as pink. An example of the groups that were gathered can be seen in Figure 14. Figure 14. An example of the grouped-up affinity notes. The images of the grouped up notes can be seen in the appendixes. Because of poor readability, the categories were typed up. The notes can be seen in Table 4. After each category, a number was added to represent the amount of notes that were initially grouped up in that category. This number represents the weight of the category when compared to other categories. There were some categories that did not get a lot of notes, but still were perceived important by the researchers. Contradicting notes were emphasized with red colour, and notes concerning television or internet broadcast viewers were emphasized with blue colour.
44 Design validation Design validation was done using an internet questionnaire which gathered demographic data of the users, open feedback of the application and it used the UEQ to gather quantitative data about the usability of the application. The participants were recruited from Tappara fan page on Facebook 1. The UEQ was chosen because of the convenience and because it provides a benchmarking tool to compare results against. It is quick to fill out, average case takes approximately 10 minutes, so it suits well for gathering data online. 1
45 39 5. RESULTS The priority of this research was to gather user data to aid development of an application to support ice hockey spectators live viewing experience. This section presents the results of the conducted research. Section 5.1 presents the results of competitor review using SWOT. In section 5.2, the results of the user research is discussed. In section 5.3 the implemented solution is presented. In section 5.4, process and results for the validation questionnaire are presented. The results are presented in the same chronological order as in they were performed in the development process. 5.1 Competitor review The results for the competitor review are presented application by application. A SWOT analysis was performed on three distinct competitors. All three are indirect competitors, and they share some of the core functionality and some user group for the proposed solution. Since no direct competitors using similar technology exist, the evaluations were performed on three applications that share some functionalities that the proposed design solution proposed to include. These applications were HIFK mobile application 1, Yonoton 2 and Wolt 3. The extent of evaluations was decided by the designer on case-by-case basis. Solutions were selected based on discussion between product management, development team and the judgement of the author of this thesis. First, a verbal description of the application is presented. Then, a SWOT strengths and weaknesses table is presented for every analysed solution. Then based on the strengths and weaknesses, opportunities and threats for the Tappara application are presented
46 40 HIFK is a Finnish ice hockey team that has released their own application for the team. HIFK application is available for both Android and ios operating systems. The application is constructed of 5 main views: front page (next upcoming game, feed of released news stories), matches (list of results of past games as well as listing of upcoming games, with links to ticket purchasing for games that are played in HIFK s home arena), HIFK TV (video interviews and video news stories), league table (rankings between teams for the ongoing season) and team (listing of players on HIFK roster, as well as individual players career information and their role in the team). The functionalities of the application indicate that it is meant to be used by the fans of HIFK. The application could be described as general ice hockey team fan application. The SWOT analysis for the application is presented in Table 9. Table 9. Strengths Mobile friendly navigation Easy access to news content Listing of upcoming games Links to ticket purchasing SWOT analysis for HIFK application Weaknesses Navigation model not consistent with material design guidelines Inconsistent information hierarchy Application has links that lead to external applications (browser) Video content Statistics for SM-liiga Information about the players Opportunities Make navigation clear by following guidelines Incorporate all functionalities inside the application Threats Content has to be presented well and be interesting to compete with standards created by competitor Adhere to guidelines and make information hierarchy and views of the application consistent Yonoton is a food and drink ordering service that operates on stadiums during various events, such as football games and concerts. The main value of the application is to make getting food and drinks more effortless for spectators. When launching the application, users are presented with a list of events Yonoton can be used on, your distance from the
47 41 venue and the time and date of the event. After choosing an event, users are prompted to choose the delivery method of the order. During the testing, only take-away orders were available. After choosing the delivery method, users have to choose the restaurant they want to order from, and after that the product catalogue for chosen restaurant is displayed. Users add products to shopping cart, and after paying by credit card, the order is placed to the selected restaurant. Users can choose different delivery/pick up times for the order, such as immediately or next intermission. At the check-out counter users present a QR code they received in the application when placing the order, display it to a code reader and a cashier gives them their order. The results for SWOT analysis on Yonoton can be seen in Table 10. Table 10. Strengths Mobile friendly navigation Novel solution in Finland Already in use in stadiums SWOT analysis for Yonoton Weaknesses No additional functionality besides food ordering Users have to install application only for the food ordering function Mobile purchasing Eliminates queuing Easy to keep track of the status of the order Presents directions to restaurants Ability to order food to your seat or to pick up Ability to change the time of pick up of order (immediately or at half time) Opportunities Provide interesting additional content besides food ordering Interesting content can make users download the application Threats Existing user base, market penetration may be difficult Good overall user experience Wolt is a mobile application designed for ordering food. Wolt s business model also includes delivery agents who pick up and deliver the purchased goods to users. Users may
48 42 choose between eating in the restaurant, ordering take away or to order the food to their location. Users are onboarded with a 6 screen tutorial that teaches the basics of the user interface. After the last screen of the tutorial, users are prompted to login. Logging in is required to continue to the actual application. On the front page users are presented with a card view of suggested restaurants. Users can browse restaurants based on the delivery method. Users order the food using a credit card and after payment is complete, users can check the status of their order and receive notifications when their order advances in the process. If the selected delivery method was order in, users can track the location of the delivery person through the application. The results for the SWOT analysis for Wolt can be seen in Table 11.
49 43 Table 11. Strengths SWOT analysis for Wolt application Weaknesses Mobile friendly navigation One of the market leaders in mobile food ordering services Great onboarding No additional functionality besides food ordering, users have to install application only for the food ordering function Delivery to the stadium requires stepping out of the arena during the game Suggestions for popular restaurants and menu items Customizable orders Magic link makes registering easy Visually pleasing Great interactions Trustworthy impression Following the status of order adds to sense of security that order was successfully received Map view of restaurants makes choosing a restaurant easy Opportunities Delivery to your seat or pick up from the restaurants inside Add delivery times that are suitable for the ice hockey game context Additional content besides food ordering Threats Users familiar with the solution Service is easy to learn Outstanding user experience Vendors already using the service Summary of competitor review All of the reviewed solutions are applications that have been designed primarily for mobile use. The competitors applications have adequate or good user experience. The solutions are already implemented and have a existing user base. Competing with Yonoton
50 44 means that the application has to provide a service with similar functionality with some extra functionalities that make arenas use our solution instead of theirs. HIFK application presents team related news and the statistics of SM-liiga in an easily accessible way. Wolt has created a high standard for user experience standard in mobile food ordering solutions. These analyzed competitors' weakness and strength at the same time is that they cater to one specific need. This creates an opportunity. If our solution caters to multiple needs at once, it is easier for users to use just a single application. Ice hockey teams may also be more interested in one-in-all solution. With Älykiekko, our solution can provide interesting data no competitors can provide at the moment. Competitors also create threats. Existing services in the desired marketplace may prevent upscaling. Users are accustomed to existing solutions good UX. The application has to have enough interesting content to keep users using the application 5.2 User research This section presents the results gathered in the user research phase. The user research included a background questionnaire, interview and a prototype testing session. The results are presented in their own sub sections in the order which they were completed during the design process. First, experience goals are presented, then created personas and lastly the context scenarios created based on the personas Experience goals This section presents the experience and end goals of users. Experience and end goals were constructed based on the findings from interviews and prototyping sessions. The goals are based on theory (literature review, user research), empathy (user research) and available technology. Cooper suggests that end goals and experience goals are the most important when designing a new service. Therefore, experience goals and end goals of spectators are presented. The derived goals were used in constructing personas to function as their motivation. The summarized experience goals are presented in Tables 12 and 13. The full list of experience goals can be found in Appendix 6.
51 45 Table 12. Summarized experience goals of spectators Summarized experience goals of spectators Occasional visitor Avid fan Home viewer Wants to have a good time at the arena Wants to feel the atmosphere of the arena Wants to spend time in company of friends and family Wants the errands he has to run at the arena to cause no hassle Wants to know everything about the game Wants to feel the rush of winning Wants to focus on the game Wants to be part of the (fan) community Wants to follow games with as little effort as possible Wants a comfortable viewing environment Table 13. Summarized end goals of spectators Summarized end goals of spectators Occasional visitor Avid fan Home viewer Wants to spend time with family and friends Wants to eat and drink at the arena Wants to find the services in the arena (menus and locations of the restaurants) Wants to know what to follow in game Does not want to miss (important) game events Wants statistical data about their favorite team Wants to support his/her favorite team Wants to cheer on their favorite team Wants to control what he/she focuses on when viewing the game Wants information about the ongoing game s events Wants to engage in other activities while following the game (does not mind if misses some game events) Does not want to follow games that already seem lost Wants to hide the end result of the game until can view the game
52 Personas Three personas were constructed based on the data gathered during user research. The found personas were in line of the initial persona hypothesis. The aim was to construct the personas so that they could be easily glanced through, and that they would benefit the design team. The finalization of the personas was done after the author of this thesis left the project, and the finalized persona images were constructed by designer Lauri Inkeroinen [67]. The personas include a general description of the depicted person, their needs, technological skills and goals. The personas can be seen in Figures 15, 16 and 17.

53 Figure 15. Persona of an avid fan [67] 47
54 Figure 16. Persona of an occasional visitor [67] 48
![49 5.2.3 Context scenarios Figure 17. Persona of a home viewer [67] For every persona, a context scenario was written in collaboration with the thesis author and Lauri Inkeroinen.](/docs-images/114/209008383/images/55-0.jpg "The goal of constructing scenarios was to invoke empathy towards users in the design and development teams.")
55 Context scenarios Figure 17. Persona of a home viewer [67] For every persona, a context scenario was written in collaboration with the thesis author and Lauri Inkeroinen. The goal of constructing scenarios was to invoke empathy towards users in the design and development teams. Occasional visitor While getting home from work, Kalle remembers that he has not been in touch with his friend Jukka for a while. When they were younger, they used to watch ice hockey together and hang out. Using the Tappara application, he sends Jukka an invitation for next week s Tappara-Ilves match and starts preparing dinner for his wife and his child. Next day while at work, Kalle gets a notification saying that Jukka has accepted his invitation. The system automatically reserves tickets for both of them.
56 50 Three hours before the game, the application notifies Kalle of the fastest route to Hakametsä, and suggests a parking area, which is reserved only for customers who bought the ticket in advance from the application. Kalle decides he wo not take the car today, and instead boards the bus that the application suggests. While in the bus, Kalle calls Jukka and asks if he is hungry. They both agree that it would be nice to eat something, and Kalle says he ll take care of ordering food. From the application, Kalle decides to order a set of wings and a beer for both of them. He places an eat in order, and chooses for the food to be ready before the game. Kalle sees Jukka at Hakametsä, and takes a look at the application. It tells Kalle that their order is ready to pick up from Siipikellari. Kalle is not sure where the restaurant is nowadays. The notification for the order displays also a map displaying the location of the restaurant. When getting near the gates of the arena, Kalle and Jukka both get a notification asking, to display the tickets. Both of them accept, and show the ticket to the reader at the gates and get in. When getting in to the restaurant, Kalle and Jukka go to the self-check out lane, which has no queue at all. They display the code for their purchase to the reader. The cashier checks their ID because of alcoholic beverage purchase, and accepts the order when seeing that it is all in order. Both of them get a receipt to their phone. After the games start, Kalle is a bit unsure about the team composition nowadays. He checks the application for up to date rosters and sees that his favourite player is on the starting line-up. The application gives out pointers for hot players for Kalle to follow during the game. At the game Kalle and Jukka start talking about what has been going on with their lives, and get into an intense discussion. Meanwhile, there has been a major incident involving an injured player and the game has been stopped. Jukka and Kalle check Kalle s phone for replays, and get video feed of the incident.
57 51 A Tappara-fan This evening Tappara faces off Ilves and Tero would not miss this classic Tampere match up for the world. Him and his friends have a seasonal pass for Tappara games, and he s pretty sure they will be at the match also. One hour before the game the application gives a notification: tonight s game s rosters have been publisher, and Tero is pleased to see upcoming rookie Ville Lehtikäinen is on the line-up again after an injury. At Hakametsä, Tero greets his friends and sits to their usual spots. They chat about the upcoming game and about Lehtikäinen s return. After the game starts, they all focus on the game intensively, not saying much to each other during plays. During an intermission in the game, Tero and his friends chat about the progress of the game. They are appalled that Tappara is down 2-0. Tero s friend Juha suggests that it s because Tappara s defence formation is not correct. From the application, they check the number of shots on goal, and see indeed that Ilves took twice as much shots on goal as Tappara during the first period. The also check the locations of the shots taken, and see that the left defence is leaking. During the period break, Tero and his friends go over some of the plays that happened during the first period using the applications position tracking, and they see that the left defender Lauri Hotakainen has not been tagging his man during defence situations. Tero says he will keep an eye on Hotakainen during the two remaining periods, and hopes that coach will notice the same thing and give Hotakainen some advice for the rest of the game. On second period, Tappara scores, and Tero and his friends raise their phones up in the air: the application plays the sound of a horn as a sound of victory. Other fans do this as well, and the arena is illuminated by flashing screens and sounds of horns. During the second period break, Tero briefly checks what his favourite players have been writing on social media. He s interested to see that two important players are going to have children this season, and wonders with his friends if this will affect their performance. After the game, Tero checks the statistics for this evenings game, and can see that even though they lost, statistically the game was really even. Considering the shots taken, he s impressed with Tappara s goaltenders performance. He s sure, next time Tappara will win.
58 52 Home viewer Kimmo knows that Tappara has a game tonight, and he invited a couple of his friends over. Both of them had other plans for tonight, so Kimmo thinks he ll spend the night by himself, watching ice hockey and cooking. While first period starts, Kimmo watches the game, while browsing internet on his mobile phone. While he attends to cooking in the kitchen, he checks the scores of ongoing matches in SM-liiga. He stays up to date on every game without having to switch to tekstitv on his television. As Tappara is winning 5-1, Kimmo decides that the game is over and no longer worth watching. In case of a miracle, he however turns the application s notifications on for the game. The unexpected happens, and Kimmo gets 4 notifications on his phone in a row: Ilves is now tied with Tappara with only 2 minutes remaining on the clock. Kimmo gets the remote and tunes in for the most exciting part of the game. After the game, Kimmo checks the videos of the goals from the application to get a better understanding on how Ilves managed to tie the game. 5.3 Resulting implementation This section presents the resulting Tappara application 1 that was launched in October The launched application includes statistical match calendar and ticket purchasing (Figures 19 and 20), player information (Figure 21), news content about SM-liiga & Tappara (Figure 22), statistics of SM-liiga (Figure 23), previews and reports of games (Figure 4 and 25), Älykiekko data of players performance on ice (Figure 26), and food ordering at the stadium (Figure 27). The images presented have been fetched in February 2018, but no major updates in applications functionalities been made between October 2017 and February Table 14 presents the functionalities and the UX goals they support. 1
59 53 Functionality Table 14. Match calendar & Ticket purchasing Statistics of SM-liiga News of SM-liiga & Tappara Älykiekko data of players Food ordering at stadium Previews and reports of games Functionalities and UX goals they support Supported UX goals Wants to follow games with as little effort as possible, wants the errands he has to run at the arena to cause no hassle Wants to know everything about the game, wants statistical data about their favorite team Wants to be part of the (fan) community, wants to know everything about the game Wants statistical data about their favorite team, wants to know everything about the game, wants information about the ongoing game s events Wants to have a good time at the arena, wants the errands he has to run at the arena to cause no hassle, wants to eat and drink at the arena Wants to know what to follow in game, wants to know everything about the game, wants to follow games with as little effort as possible The navigation hierarchy of the application is presented in Figure 18. When users open the application, they land on the news view. Users can move between screens only through routes portrayed with arrows. If an user is deeper in the navigation hierarchy (level two or higher), they need to return to level one to be able to switch between level one views. Users can move between level 1 screens by navigating from the bottom navigation bar. Inside navigation levels, users can navigate through sibling views by using tabs on the top of the screen. The sibling views inside a navigation level are portrayed in blue (Figure 18).

60 54 In matches view, users first select a match from the match calendar. After that, they can view a single match. If the match is upcoming, users can purchase tickets for the match, display the match line-up or read a match preview article. If the match has already been played, users can view the game events of the match and read a report article. In the shop, users first choose their desired products and add them to the shopping cart. Then they can review and modify their order in the shopping cart. After reviewing the order, users move to the checkout where they choose a desired pick up time for the order and pay the order. Figure 18. Navigation hierarchy of Tappara application


61 55 Figure 19. Ticket purchasing Figure 20. Match calendar Figure 21. Player information


62 56 Figure 22. News view Figure 23. SM-liiga statistic Figure 24. Game previews (not yet published) Figure 25. Match report
.")

63 57 Figure 26. Älykiekko data of players performances Figure 27. Food ordering 5.4 Design validation results This section presents the results of the online questionnaire that was used to validate the success of the implementation (presented in Section 5.3). Three of the users who answered the questionnaire had used the application two to five times, seven of the users six to ten times and 13 had used the application over ten times. Two of the answerers had used the application within 5 hours of filling out the questionnaire, four had used it during the same day, seven within 3 days and the had used it longer ago. Data about the last time of use was gathered for determining the accuracy of UEQ, since it is most accurate when used immediately after using the service the questionnaire tests [51]. Five of the users had spectated one to five ice hockey games live last season ( ), seven users had spectated six to fifteen games and eleven users more than fifteen games. Most answerers have used the application enough to have formed an opinion about the usage. The answerers range from fans watching a lot of live games to occasional visitors, but weighing on the fan side. This was expected, as the site from which answerers to questionnaire were gathered, is focused on fandom of Tappara.
64 58 In Figures 28 and 29 the influence of the application in the overall experience and the areas of improvement are displayed according to questionnaire s answers. Most answerers (12 out of 23) said that as is, the application did not influence their experience. Two answerers said that it was exciting and three answerers said that Älykiekko statistics were interesting. Four out of 23 answerers wanted more specific Älykiekko data and three out of 23 answerers wanted Älykiekko data visible even if they are not present in the arena. How did the usage of the application influence your experience of the ice hockey match? Food ordering was useful Had a positive effect It was novel or exciting Älykiekko-statistics were interesting It did not influence my experience Figure 28. Tappara application s influence on the overall experience of the hockey match How could the application be improved? Possibility to pre order drinks Notifications about content updates Real time älykiekko data Too complex navigation Seating maps More content Älykiekko data viewable even if you are not in the arena Show if puck was offside or in goal (confirm referee calls) Toggle whether you want notifications about goals or not More information about players Add video interviews Include fan shop in application More specific Älykiekko data Älykiekko data about every game Figure 29. Areas of improvement in the Tappara application The second part of the questionnaire used the UEQ to map the current user experience of the application. Figure 30 depicts the calculated means of the individual scales gathered by the user experience questionnaire.
65 Figure 30. Results from the UEQ data analysis tool As can be seen from Figure 15, novelty has no score. Novelty scale was left out because it was decided within development team that novelty should not be a factor and instead, actual usability and experience enhancing was prioritized. It was also left out to shorten the questionnaire to avoid deterring users from finishing answering the questionnaire. The gathered data was also compared against a benchmark provided within the UEQ toolbox. The results can be seen in Table 15 and Figure 31. Table 15. Results against UEQ benchmark. Scale Mean Comparisson to benchmark Attractiveness 1,18 Above average Perspicuity 1,55 Above Average Efficiency 0,93 Below Average Dependability 1,10 Below Average Stimulation 0,98 Below Average
66 60 2,50 2,00 1,50 1,00 0,50 0,00-0,50-1,00 Excellent Good Above Average Below Average Bad Mean Figure 31. Results against UEQ benchmark. As can be seen from figures, the test results are mainly average within the benchmark dataset, with the exception of perspicuity (ease of use), which is ranked higher than average.
67 61 6. SUMMARY AND CONCLUSIONS In this chapter, first the results of the user research phase are summarised. Then, validity of the results is discussed. Last, future work regarding the project is suggested. 6.1 Summary of the results For creating a solution to enhance the ice hockey viewing experience of spectators, literature review of existing theory was performed, competitors were researched using SWOT analysis, user research through interviewing and prototype testing was performed and experience goals, personas and contexts were constructed based on user research data. Then implemented solution was presented and validated using the User Experience Questionnaire. The results produced by the user research gave out two kinds of results. First, qualitative knowledge about the nature was acquired. Secondly, qualitative data about desired features and success of the designed ones was gathered. Results of the validation questionnaire provided qualitative open feedback data about the existing implementation, as well as quantitative data about the impressions when using the application. User research results corroborate with the SPEX model [56]. The spectatorship is heavily focused on the atmosphere and social interaction. For spectators that are not avid fans of hockey, the event itself provides an opportunity to spend time with friends. The hockey game is seen as a form of entertainment and a possibility to spend time with friends and family. The most important results from the interviews and prototype testing can be divided into 4 categories. The categories and findings supporting those statements can be found in Table 16. The findings are gathered from the user research phase: interviews, prototype tests and the validation questionnaire. These findings also answer to research question 1: What are the user needs that affect experience design for a mobile application for ice hockey spectators in the arena?.
68 62 Social nature of the viewing experience Table 16. Categorized user needs that affect experience design Nearly all visitors prefer watching games in company of others The game is a socializing event, where majority of the users socialize with their friends and family Viewers come to the arena to feel the unique atmosphere The atmosphere depends on the company Helping novice viewers get into the sport Novice viewers want help on directing their attention. They necessarily do not know what game events are important Additional information of the ongoing game Creating an effortless viewing experience Viewers, who know a lot about hockey would like to confirm referees calls with Älykiekko data Viewers would like (slow motion) video material from multiple angles from important game events Heavy users want to read reports and statistics of the game after it has ended Heavy users would like to see additional data about the individual performances of players Viewers would like to get information about new, interesting players I want to tie the game into a bigger picture Viewers want the arena experience to be as effortless as possible. This includes getting to the arena, buying tickets, finding seats, ordering food and finding services in the arena. Viewers do not want to waste time by queueing to restaurants or other services The user experience questionnaire for the existing application yielded similar results. Avid fans are more interested in the statistical data of ice hockey, and would like a singular place where they could go to fetch their data. During feedback gathering, there was significant desire for more detailed and more interesting Älykiekko data.
69 63 Novice viewers and avid fans alike both described the atmosphere of the arena as a big reason for viewing games live. Both groups also described keeping up social relationships as on reason of spectating games live with company. To answer the second research question, 23 participants answered the validation questionnaire. Second research question was Does the implemented service affect the spectatorship experience?. The validation questionnaire results indicate that at the moment, design has a minor positive impact. In open feedback the application was described as interesting and having potential, but requiring additional content and functionalities to actually provide a meaningful impact to the stadium experience. The UEQ yielded similar results, and the Tappara application was rated slightly above average the benchmark as it is at this moment. 6.2 Validity of the results The results of the interviews give similar results about viewership as the SPEX model [56]. Spectators view the ice hockey match as a social event besides enjoying the sport. Spectators meet friends and fellow fans during matches. Atmosphere of the arena is an important factor when choosing whether to view the match from home or at the arena. Spectators also want to eat and drink when they spend an evening at the arena, just like they would in a bar or in a restaurant. Avid fans want to deepen their knowledge about the sport itself. Spectators also want to tie the events in game into a bigger picture. This small scale study corroborates SPEX model s applicability for Finnish ice hockey fans. The found need for socializing during the event, and wanting to fit a single game or a play into a bigger picture were also found on Esbjörnsson s earlier study [2]. The validity of the user research may suffer from factors regarding the sample of participants. The sample was relatively small (8 interviewees), and 5 of the interviewees were employees of Bitwise, the company the product was being developed for. Where it is not likely that answers would be skewed because of the employer, all the interviewees work for an IT company, and may not give best representation for example of the smart phone usage skills or mindset of the target audience. The validation questionnaire was constructed using the UEQ, which has been tested in various countries and with various different projects. The questionnaire was however translated to Finnish by the author of this thesis. While the general translation was verified by peers, there might be slight errors in the nuances of the descriptive words of the UEQ. The sample size for the validation was 23 responses, which should be large enough to yield reliable results. The test users were however recruited through a social media fan page of Tappara. The respondents may therefore be more likely to know about ice hockey, and therefore have different needs for the application, than an average occasional visitor. Also, the questionnaire gives most reliable results, if it is filled right after using the researched solution. This was not the case for majority of the respondents. However, most
70 64 of the answerers had used the application during the same day as they answered the questionnaire. 6.3 Future work At the moment, the application does not create other possibilities for co-experiences besides experiencing ice hockey and eating and drinking together. There may be a need to put more emphasis on creating a features that brings fans together. The Älykiekko data presented by the application was described as interesting and having potential. Studying what the system is capable of and displaying that data in an interesting format will be a challenge for the future. Also, if possible, the Älykiekko data should be presented in real time. Video material was also a widely requested feature, and might be worth looking into in the future.
71 65 REFERENCES [1] A. Sahami Shirazi, M. Rohs, R. Schleicher, S. Kratz, A. Müller, A. Schmidt, Real-time nonverbal opinion sharing through mobile phones during sports events, Proceedings of the SIGCHI Conference on human factors in computing systems, ACM, pp [2] M. Esbjörnsson, B. Brown, O. Juhlin, D. Normark, M. Östergren, E. Laurier, Watching the cars go round and round, Proceedings of the SIGCHI Conference on human factors in computing systems, ACM, pp [3] J. Hallberg, S. Svensson, A. Ostmark, P. Lindgren, K. Synnes, J. Delsing, Enriched media-experience of sport events, Sixth IEEE Workshop on Mobile Computing Systems and Applications, IEEE, pp [4] J. Dewey, Art as Experience, The Berkeley Publishing Group, [5] M.M. Bakhtin, Toward a Philosophy of the Act, University of Texas Press, [6] M.M. Bakhtin, M. Holquist, V.W. McGee, V.W. McGee, Speech Genres and Other Late Essays, University of Texas Press, Austin, [7] P. Wright, J. McCarthy, L. Meekison, Making Sense of Experience, in: M.A. Blythe, K. Overbeeke, A.F. Monk, P.C. Wright (ed.), Funology: From Usability to Enjoyment, Springer Netherlands, Dordrecht, 2005, pp [8] ISO DIS :2008. Ergonomics of human system interaction - Part 210: Humancentred design for interactive systems, 2010, pp [9] ISO , (2010). Ergonomics of human-system interaction - Part 210: Human-centred design for interactive systems. International Standard. [10] D. Chesnut, K. Nichols, Chapter 1 - Defining UX and the Process, in: Anonymous (ed.), UX for dummies, [11] Is beautiful really usable? Toward understanding the relation between usability, aesthetics, and affect in HCI, in: Computers in Human Behavior, 2012, pp [12] E. Law, V. Roto, M. Hassenzahl, A. Vermeeren, J. Kort, Understanding, scoping and defining user experience, Proceedings of the SIGCHI Conference on human factors in computing systems, ACM, pp [13] ISO :1998: Ergonomic requirements for office work with visual display terminals 1998, 1-22 p. [14] K. Battarbee, Defining co-experience, Proceedings of the 2003 international conference on designing pleasurable products and interfaces, ACM, pp [15] J. Forlizzi, K. Battarbee, Understanding experience in interactive systems, Proceedings of the 5th conference on designing interactive systems, ACM, pp [16] V. Roto, Y. Lu, Towards meaning change, Proceedings of the 8th Nordic Conference on human-computer interaction, ACM, pp
72 66 [17]. E. Kaasinen, V. Roto, J. Hakulinen, T. Heimonen, J.P.P Jokinen, H. Karvonen, T. Keskinen, H. Koskinen, Y. Lu, P. Saariluoma, H. Tokkonen, T. Markku, Defining user experience goals to guide the design of industrial systems: Journal of Behacviour & Information Technology, 2015, Volume 34, Issue 10, pp [18] I. Michailidou, C. von Saucken, S. Kremer, U. Lindemann, A User Experience Design Toolkit, in: A. Marcus (ed.), Design, User Experience, and Usability. Theories, Methods, and Tools for Designing the User Experience: Third International Conference, DUXU 2014, Held as Part of HCI International 2014, Heraklion, Crete, Greece, June 22-27, 2014, Proceedings, Part I, Springer International Publishing, Cham, 2014, pp [19] D. McDonagh, I. Storer, Mood boards as a design catalyst and resource: researching an under-researched area, Design Journal, The, Vol. 7, Iss. 3, 2004, pp [20] W. Quesenbery, K. Brooks, Storytelling for user experience, Rosenfeld Media, Brooklyn, NY, [21] I. Michailidou, U. Lindemann, C. von Saucken, Extending the product specification with emotional aspects: Introducing User Experience Stories, 2013, ICED, Seoul, Korea. [22] J.L. Thompson, Strategic management, Chapman and Hall, London, [23] T. Adlin, J. Pruitt, The Essential Persona Lifecycle: Your Guide to Building and Using Personas, 1st ed. Morgan Kaufmann, Burlington, Mass, [24] A. Cooper, R. Reimann, D. Cronin, About face 3, [3. ed.], completely rev. and updated ed. Wiley, Indianapolis, IN, [25] Metaphor design for user interfaces, Conference Summary on Human Factors in Computing Systems, 1998, ACM. [26] C. von Saucken, I. Michailidou, U. Lindemann, Emotional mental model, 2013 IEEE International Conference on Industrial Engineering and Engineering Management, IEEE, pp [27] J.M. Carroll, Scenario-based design: Envisioning work and technology in system development, in: Anonymous (ed.), Wiley, New York, 1995, pp [28] I. Michailidou, C. von Saucken, U. Lindemann, How to create a user experience story, Springer, pp [29] U. Lindemann, Methodische Entwicklung technischer Produkte, 3 ed. Springer, Berlin, 2009, 309 p. [30] G.S. Altschuller, Erfinden - Wege zur Lösung technischer Probleme, in: Anonymous (ed.), Verl. Technik, Berlin, [31] C. von Saucken, J. Reinhardt, I. Michailidou, U. Lindemann, Principles for User Experience Design Adapting the TIPS Approach for the Synthesis of Experiences 2013, pp [32] Buchenau, M., Suri, J.F, Experience prototyping. In: Proceedings of the 3rd Conference on Designing Interactive Systems: Processes, Practices, Methods, and Techniques. [33] U. Lindemann, T. Braun, M. Maurer, Structural complexity management, Springer, Berlin, 2009.
73 67 [34] Why Does your Mobile App Idea Need a SWOT Analysis? (Accessed January ) [35] 50MINUTES.COM, 50 minutes, The SWOT Analysis : Develop strengths to decrease the weaknesses of your business, Primento Digital, Brussels, [36] S. Khan How to check out the competition, (Accessed January ) [37] T. Hill, R. Westbrook, SWOT analysis: It's time for a product recall, Long Range Planning, Vol. 30, Iss. 1, 1997, pp (Accessed January ) [38] B. Martin, B. Hanington, Universal Methods of Design, 1. publ. ed. Rockport, Beverly, MA, [39] A. Cooper, The inmates are running the asylum, 1. print. Sams, Indianapolis, Ind, [40] A. Cooper, About Face, 4. ed., Wiley, Indianapolis, IN, [41] A. Cooper, R. Reimann, D. Cronin, About face 3, 3rd ed., Wiley, Indianapolis, IN, [42] John S. Pruitt, Tamara Adlin, The Persona Lifecycle, 1st ed., Morgan Kaufmann Publishers Inc, US, [43] A. Cakir How To: Create A User Persona, (Accessed July ) [44] J.M. Carroll, Making use, MIT Press, Cambridge, Mass., [45] H. Beyer and K. Holtzblatt, Contextual Design: Defining Customer-Centered Systems. San Francisco (Calif.): Morgan Kaufmann, [46] K. Holtzblatt, J.B. Wendell, S. Wood, Rapid contextual design, Elsevier, Amsterdam, [47] D. Cox, S. Greenberg, Supporting collaborative interpretation in distributed Groupware, Proceedings of the 2000 ACM conference on computer supported cooperative work, ACM, pp [48] F. Geyer, U. Pfeil, A. Höchtl, J. Budzinski, H. Reiterer, Designing reality-based interfaces for creative group work, Proceedings of the 8th ACM conference on creativity and cognition, ACM, pp [49] B. Laugwitz, T. Held, M. Schrepp, Construction and Evaluation of a User Experience Questionnaire, in: Anonymous (ed.), HCI and Usability for Education and Work, Springer Berlin Heidelberg, Berlin, Heidelberg, 2008, pp [50] Hassenzahl M., Burmester M., Koller F. (2003) AttrakDiff: Ein Fragebogen zur Messung wahrgenommener hedonischer und pragmatischer Qualität. In: Szwillus G., Ziegler J. (eds) Mensch & Computer Berichte des German Chapter of the ACM, vol 57. [51] M. Schrepp User experience questionnaire handbook, (Accessed January )
74 68 [52] Suomen jääkiekkoliitto, (Accessed August ) [53] Finnish ice hockey leagues, (Accessed August ) [54] I. Suomen Jääkiekkoliitto ry: Jääkiekon virallinen sääntökirja , (Accessed August ) [55] R. Laukkanen Suomesta oppia maailman jäähalleihin, (Accessed August ) [56] M. Ludvigsen, R. Veerasawmy, Designing technology for active spectator experiences at sporting events, Proceedings of the 22nd Conference of the Computer-Human Interaction Special Interest Group of Australia on computer-human interaction, ACM, pp [57] G. Crawford, Consuming sport, 1. publ. ed. Routledge, London, [58] K. Battarbee, Co-experience: the social user experience, CHI '03 Extended Abstracts on human factors in computing systems, ACM, pp [59] M. Ludvifgsen, Designing for Social Use in Public Places a Conceptual Framework of Social Interaction, Proc., pp [60] S. Fairley, In search of relived social experience: Group-based nostalgia sport tourism, Journal of sport management, Iss. 17, 2003, pp [61] R.E. Rinehart, Players all, Indiana Univ. Press, Bloomington, [62] J. Clarke, Football and working class fans: traditions and change, Ingham, R. (Ed.), Iss. Football Hooliganism: The wider context, 1978, pp [63] S. Redhead, Post-fandom and the Millennial Blues: Transformation of Soccer Culture, Routledge, [64] R. Likert, Aœ technique for the measurement of attitudes, Univ, New York, [65] K. Pernice UX Prototypes: Low Fidelity vs. High Fidelity, [66] J. Nielsen Thinking Aloud: The #1 Usability Tool: (Accessed September ) [67] L. Inkeroinen, Personas for Tappara application, 2017.
75 69 APPENDIX 1: BACKGROUND QUESTIONNAIRE 1. Gender M F 2. Age [ ] [ ] [ ] [ ] [ ] 45+ [ ] 3. Occupation 4. How comfortable do you feel when using a smartphone? Very uncomfortable Comfortable During the last ( ) season, how many ice hockey games did you watch live in a stadium / outdoors? During the last ( ) season, how many ice hockey games did you watch from TV or online? On a scale from 1-5 from not interested to hardcore fan, how would you describe your relationship with ice hockey? Not interested Hardcore fan Do you feel you know fully, what s happening in the game when watching it live? Never All the time
76 How often do you purchase food/drinks at the stadium? Never Every game Have you used the previous TapparaApp mobile-application? [ ] Yes [ ] No 11. Have you participated in existing stadium games (such as Tapsupeli in Hakametsä ice hockey stadium)? [ ] Yes [ ] No If yes: Which games, where? 12. What of the following have you purchased from the stadium? [ ] Alcoholic beverages [ ] Beverages (non alcoholic) [ ] Food [ ] Fan items [ ] Tickets 13. What kind of methods have you used for buying your tickets? [ ] Online [ ] From the stadium when you go to the game [ ] From the stadium beforehand [ ] Other, what
77 71 APPENDIX 2: INTERVIEW QUESTIONS 1. (If has used the previous TapparApp) What do you think about the existing TapparApp? What is best, what could be improved? 2. Have you read/watched statistics about ice hockey games? (Do you do it often? When do you do it) 3. Why do you go to ice hockey games? (Do you go alone, what is the best feeling?) 4. Have you ever tried to acquire additional information during a live game? (Why? How did you do it?) 5. What are the things that you would ve wanted clarified (Depending on the answer to question about if they feel they know what s going on) 6. How do you feel about the ticket buying process? 7. How do you feel about purchasing food and beverages on the stadium? (What s good, what s bad, how could it be enhanced?) 8. What is best about the stadium experience? 9. What is worst about the stadium experience? 10. Does watching a game in company (friends, family, or such) affect the experience? How? 11. What do you do with your friends/company before or during watching the game? 12. What are the best things about watching a game together in company? 13. Are there some requirements for you to enjoy watching a game in company? (For example about the environment, about other viewers, additional services ) 14. How do you feel about the games in stadium environment, is there difference compared to watching from eg. tv? 15. Do you look at the video screen cube during games? What do you think about it? What is the most important information you get from the media cube?
78 16. Does anything else come to mind about the stadium experience? 72
79 73 APPENDIX 3: STRUCTURE OF THE PROTOTYPING SESSION Prototyping using invision prototype. Used on an iphone. User completes tasks using think-aloud method. 5. Register to the application 6. Order 12 pieces of wings with hotness setting hot 7. Find the overall amount of points player Aleksi Elorinne made this season 8. Find the score of ongoing game Kärpät-HIFK (Now were going to pretend someone just shot the puck really fast on the ice. Here you can see a what kind of notification you would get from the application. [Show screen]) Questions after test: 9. Would you be interested in seeing these kinds of notifications during a game? Why? Why not? 10. Do you feel these kinds of messages would be disruptive during the game? Why? 11. Do you feel this kind of application could enhance your stadium experience? Why? 12. What do you think is best in this application? Why? 13. What do you think was the worst about the application? Why? 14. Would you recommend this application for your friend?

80 APPENDIX 4: IMAGES OF THE CONSTRUCTED AFFINITY WALL 74
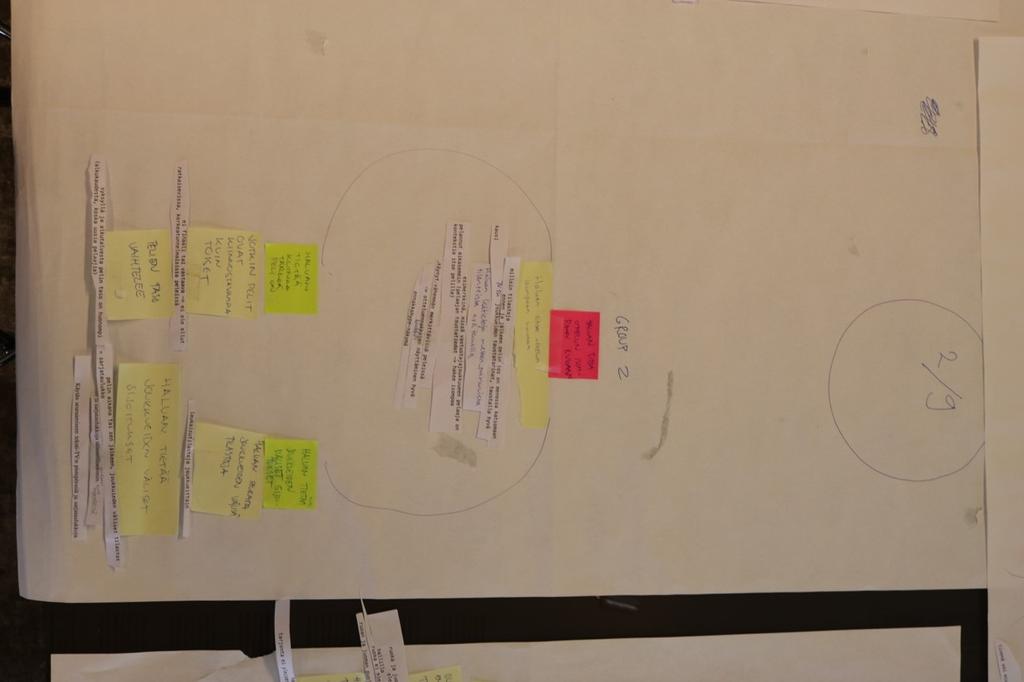
81 75
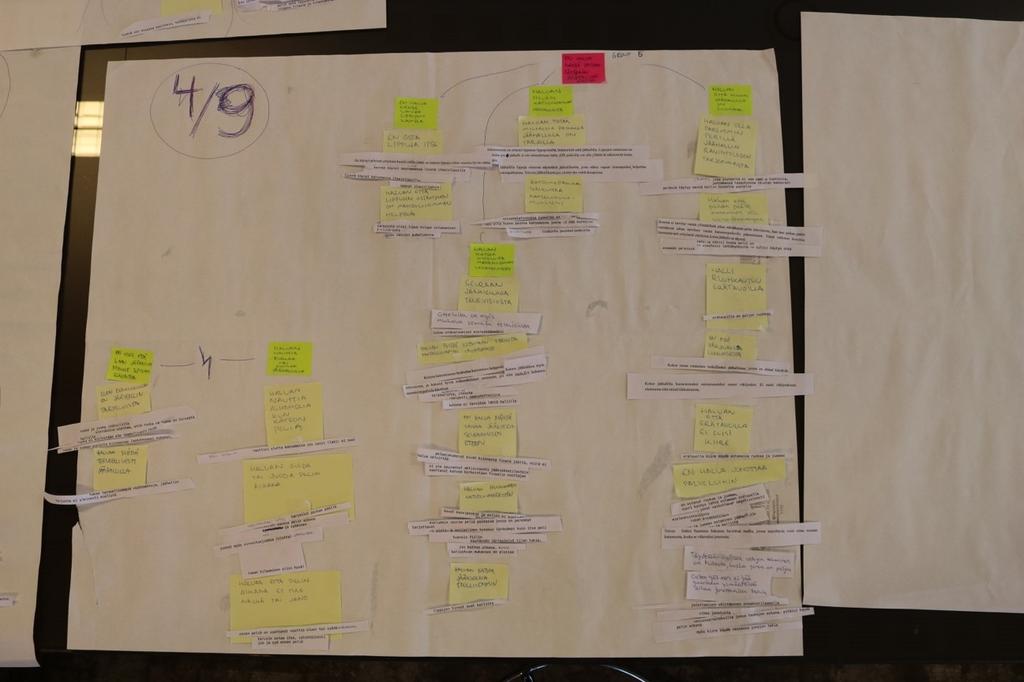
82 76
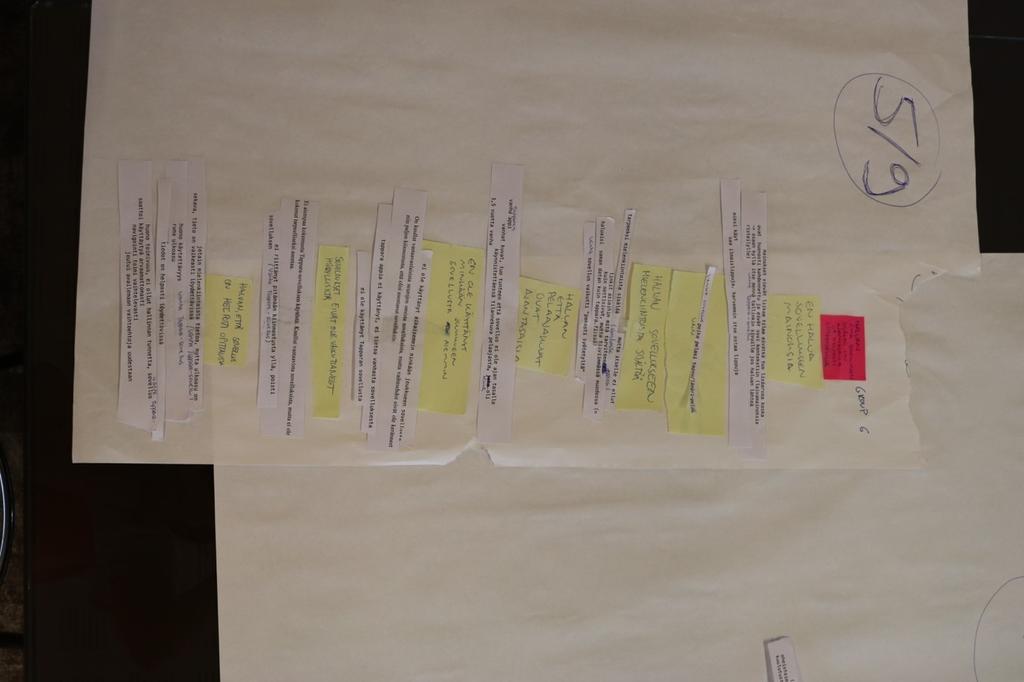
83 77
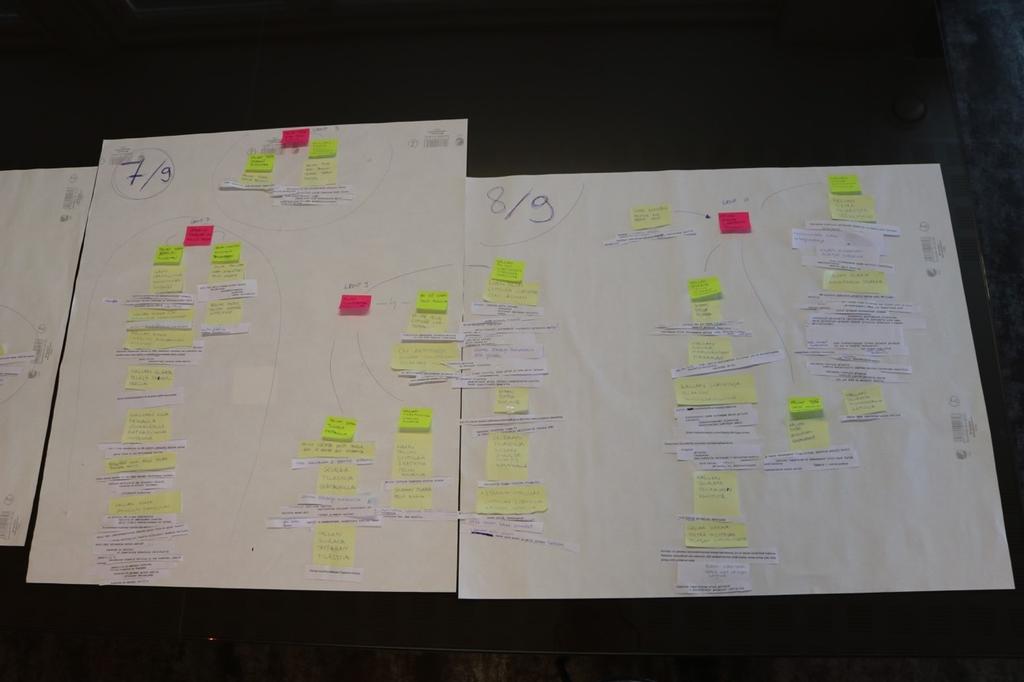
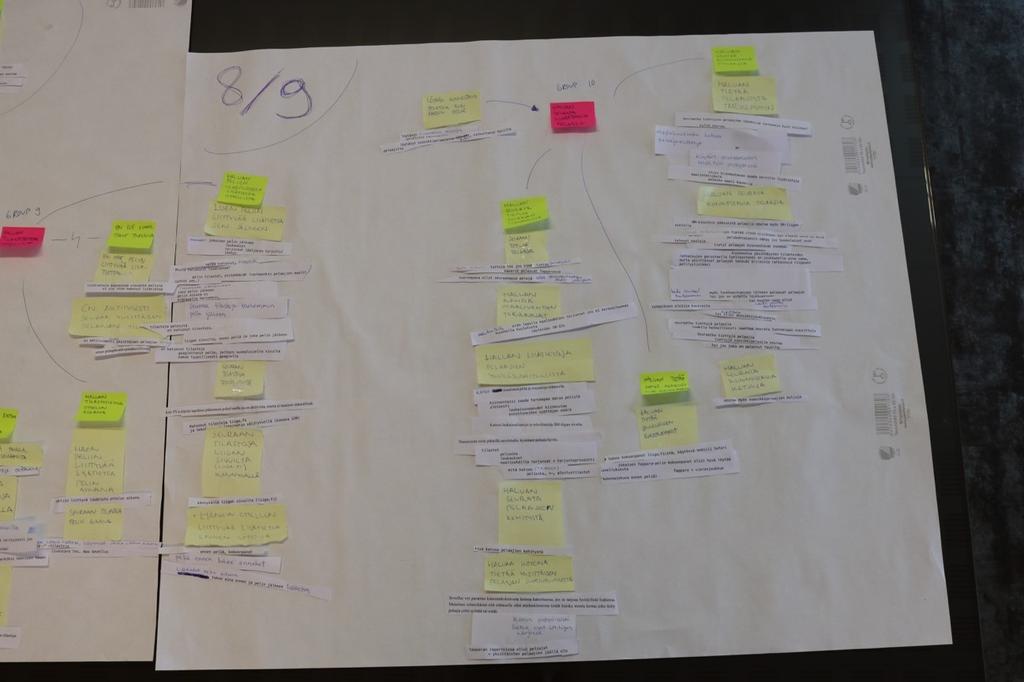
84 78
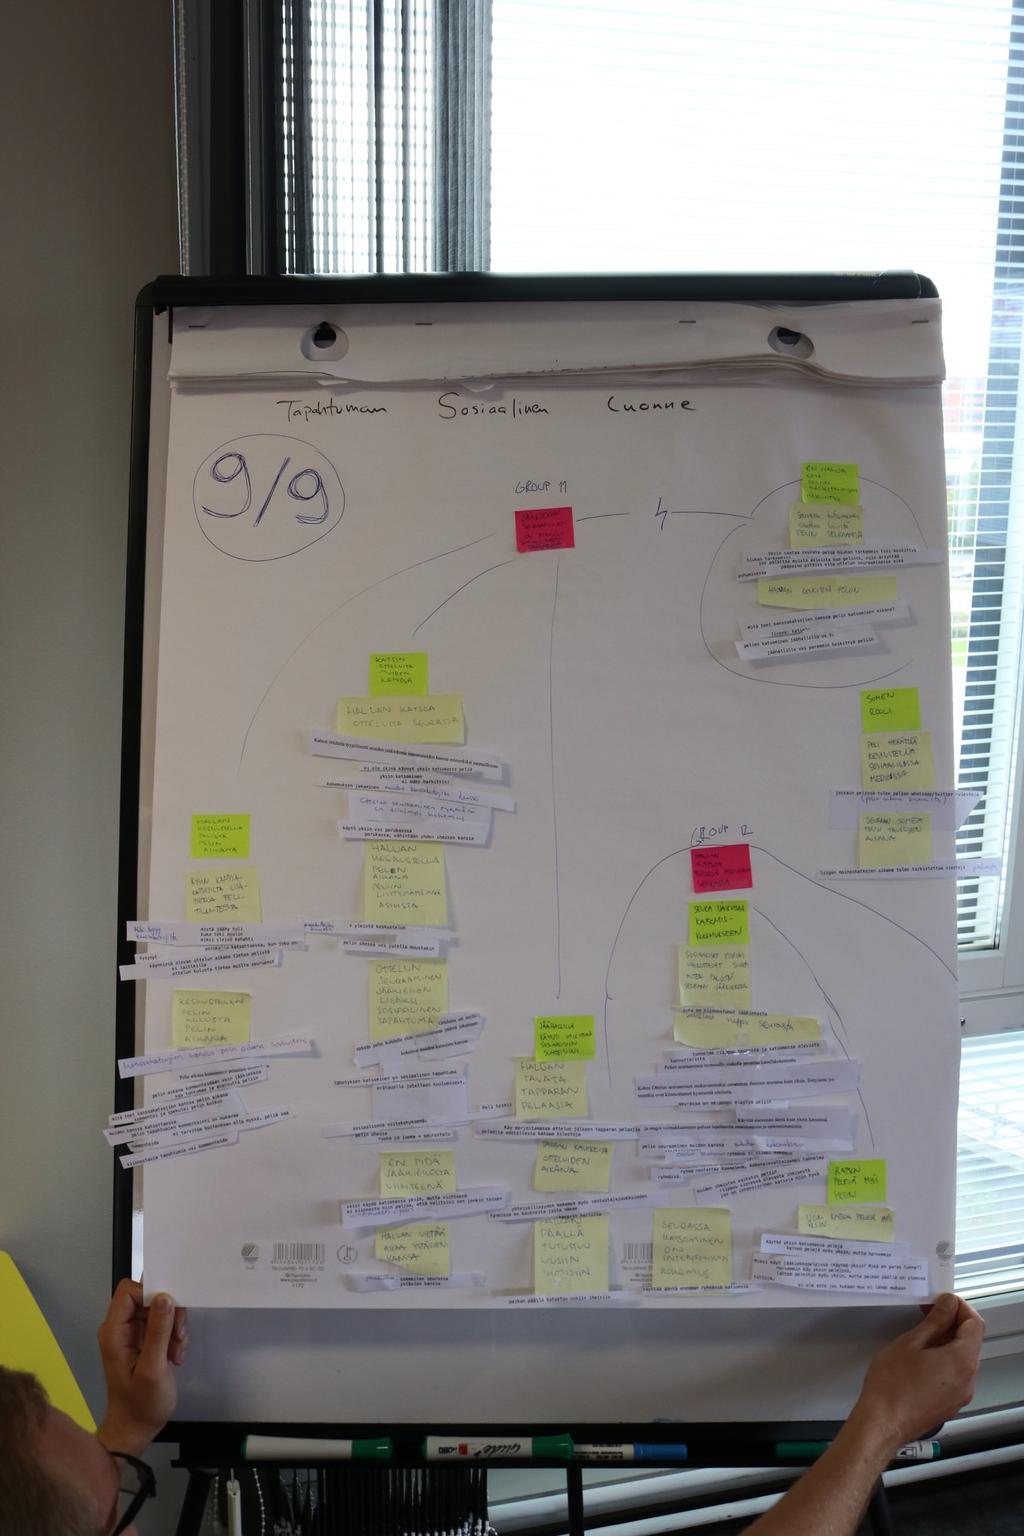
85 79
On instrument costs in decentralized macroeconomic decision making (Helsingin Kauppakorkeakoulun julkaisuja ; D-31)
") On instrument costs in decentralized macroeconomic decision making (Helsingin Kauppakorkeakoulun julkaisuja ; D-31) Juha Kahkonen Click here if your download doesn"t start automatically On instrument costs
On instrument costs in decentralized macroeconomic decision making (Helsingin Kauppakorkeakoulun julkaisuja ; D-31) Juha Kahkonen Click here if your download doesn"t start automatically On instrument costs
Capacity Utilization
 Capacity Utilization Tim Schöneberg 28th November Agenda Introduction Fixed and variable input ressources Technical capacity utilization Price based capacity utilization measure Long run and short run
Efficiency change over time
 Efficiency change over time Heikki Tikanmäki Optimointiopin seminaari 14.11.2007 Contents Introduction (11.1) Window analysis (11.2) Example, application, analysis Malmquist index (11.3) Dealing with panel
Information on preparing Presentation
 Information on preparing Presentation Seminar on big data management Lecturer: Spring 2017 20.1.2017 1 Agenda Hints and tips on giving a good presentation Watch two videos and discussion 22.1.2017 2 Goals
7. Product-line architectures
 7. Product-line architectures 7.1 Introduction 7.2 Product-line basics 7.3 Layered style for product-lines 7.4 Variability management 7.5 Benefits and problems with product-lines 1 Short history of software
On instrument costs in decentralized macroeconomic decision making (Helsingin Kauppakorkeakoulun julkaisuja ; D-31)
") On instrument costs in decentralized macroeconomic decision making (Helsingin Kauppakorkeakoulun julkaisuja ; D-31) Juha Kahkonen Click here if your download doesn"t start automatically On instrument costs
On instrument costs in decentralized macroeconomic decision making (Helsingin Kauppakorkeakoulun julkaisuja ; D-31) Juha Kahkonen Click here if your download doesn"t start automatically On instrument costs
Uusi Ajatus Löytyy Luonnosta 4 (käsikirja) (Finnish Edition)
 (Finnish Edition)") Uusi Ajatus Löytyy Luonnosta 4 (käsikirja) (Finnish Edition) Esko Jalkanen Click here if your download doesn"t start automatically Uusi Ajatus Löytyy Luonnosta 4 (käsikirja) (Finnish Edition) Esko Jalkanen
Uusi Ajatus Löytyy Luonnosta 4 (käsikirja) (Finnish Edition) Esko Jalkanen Click here if your download doesn"t start automatically Uusi Ajatus Löytyy Luonnosta 4 (käsikirja) (Finnish Edition) Esko Jalkanen
7.4 Variability management
 7.4 Variability management time... space software product-line should support variability in space (different products) support variability in time (maintenance, evolution) 1 Product variation Product
Constructive Alignment in Specialisation Studies in Industrial Pharmacy in Finland
 Constructive Alignment in Specialisation Studies in Industrial Pharmacy in Finland Anne Mari Juppo, Nina Katajavuori University of Helsinki Faculty of Pharmacy 23.7.2012 1 Background Pedagogic research
TIEKE Verkottaja Service Tools for electronic data interchange utilizers. Heikki Laaksamo
 TIEKE Verkottaja Service Tools for electronic data interchange utilizers Heikki Laaksamo TIEKE Finnish Information Society Development Centre (TIEKE Tietoyhteiskunnan kehittämiskeskus ry) TIEKE is a neutral,
Other approaches to restrict multipliers
 Other approaches to restrict multipliers Heikki Tikanmäki Optimointiopin seminaari 10.10.2007 Contents Short revision (6.2) Another Assurance Region Model (6.3) Cone-Ratio Method (6.4) An Application of
The role of 3dr sector in rural -community based- tourism - potentials, challenges
 The role of 3dr sector in rural -community based- tourism - potentials, challenges Lappeenranta, 5th September 2014 Contents of the presentation 1. SEPRA what is it and why does it exist? 2. Experiences
Augmented Reality (AR) in media applications
 in media applications") Augmented Reality (AR) in media applications Maiju Aikala, Tatu Harviainen, Pekka Siltanen & Caj Södergård VTT Technical Research Centre of Finland Research questions Is it possible to create more addictive
Augmented Reality (AR) in media applications Maiju Aikala, Tatu Harviainen, Pekka Siltanen & Caj Södergård VTT Technical Research Centre of Finland Research questions Is it possible to create more addictive
Collaborative & Co-Creative Design in the Semogen -projects
 1 Collaborative & Co-Creative Design in the Semogen -projects Pekka Ranta Project Manager -research group, Intelligent Information Systems Laboratory 2 Semogen -project Supporting design of a machine system
Network to Get Work. Tehtäviä opiskelijoille Assignments for students. www.laurea.fi
 Network to Get Work Tehtäviä opiskelijoille Assignments for students www.laurea.fi Ohje henkilöstölle Instructions for Staff Seuraavassa on esitetty joukko tehtäviä, joista voit valita opiskelijaryhmällesi
AYYE 9/ HOUSING POLICY
 AYYE 9/12 2.10.2012 HOUSING POLICY Mission for AYY Housing? What do we want to achieve by renting apartments? 1) How many apartments do we need? 2) What kind of apartments do we need? 3) To whom do we
Windows Phone. Module Descriptions. Opiframe Oy puh. +358 44 7220800 eero.huusko@opiframe.com. 02600 Espoo
 Windows Phone Module Descriptions Mikä on RekryKoulutus? Harvassa ovat ne työnantajat, jotka löytävät juuri heidän alansa hallitsevat ammatti-ihmiset valmiina. Fiksuinta on tunnustaa tosiasiat ja hankkia
DIGITAL MARKETING LANDSCAPE. Maatalous-metsätieteellinen tiedekunta
 DIGITAL MARKETING LANDSCAPE Mobile marketing, services and games MOBILE TECHNOLOGIES Handset technologies Network technologies Application technologies INTRODUCTION TO MOBILE TECHNOLOGIES COMPANY PERSPECTIVE
Innovative and responsible public procurement Urban Agenda kumppanuusryhmä. public-procurement
 Innovative and responsible public procurement Urban Agenda kumppanuusryhmä https://ec.europa.eu/futurium/en/ public-procurement Julkiset hankinnat liittyvät moneen Konsortio Lähtökohdat ja tavoitteet Every
EARLY LEARNING PLAN / ENGLANTI VARHAISKASVATUSSUUNNITELMA
 EARLY LEARNING PLAN / ENGLANTI VARHAISKASVATUSSUUNNITELMA JYVÄSKYLÄN KAUPUNKI Dear Family, Home and the family are the most important growth environment and community for the child. Alongside with home,
Skene. Games Refueled. Muokkaa perustyyl. napsautt. @Games for Health, Kuopio. 2013 kari.korhonen@tekes.fi. www.tekes.fi/skene
 Skene Muokkaa perustyyl. Games Refueled napsautt. @Games for Health, Kuopio Muokkaa alaotsikon perustyyliä napsautt. 2013 kari.korhonen@tekes.fi www.tekes.fi/skene 10.9.201 3 Muokkaa Skene boosts perustyyl.
ECVETin soveltuvuus suomalaisiin tutkinnon perusteisiin. Case:Yrittäjyyskurssi matkailualan opiskelijoille englantilaisen opettajan toteuttamana
 ECVETin soveltuvuus suomalaisiin tutkinnon perusteisiin Case:Yrittäjyyskurssi matkailualan opiskelijoille englantilaisen opettajan toteuttamana Taustaa KAO mukana FINECVET-hankeessa, jossa pilotoimme ECVETiä
MEETING PEOPLE COMMUNICATIVE QUESTIONS
 Tiistilän koulu English Grades 7-9 Heikki Raevaara MEETING PEOPLE COMMUNICATIVE QUESTIONS Meeting People Hello! Hi! Good morning! Good afternoon! How do you do? Nice to meet you. / Pleased to meet you.
Smart specialisation for regions and international collaboration Smart Pilots Seminar
 Smart specialisation for regions and international collaboration Smart Pilots Seminar 23.5.2017 Krista Taipale Head of Internaltional Affairs Helsinki-Uusimaa Regional Council Internationalisation
The CCR Model and Production Correspondence
 The CCR Model and Production Correspondence Tim Schöneberg The 19th of September Agenda Introduction Definitions Production Possiblity Set CCR Model and the Dual Problem Input excesses and output shortfalls
Informaatioteknologia vaikuttaa ihmisten käyttäytymiseen ja asenteisiin
 Infotech Seminar, Oulu, November 11, 2005 Informaatioteknologia vaikuttaa ihmisten käyttäytymiseen ja asenteisiin Prof. Harri Oinas-Kukkonen Dept. Information Processing Science University of Oulu Outline
1. SIT. The handler and dog stop with the dog sitting at heel. When the dog is sitting, the handler cues the dog to heel forward.
 START START SIT 1. SIT. The handler and dog stop with the dog sitting at heel. When the dog is sitting, the handler cues the dog to heel forward. This is a static exercise. SIT STAND 2. SIT STAND. The
Choose Finland-Helsinki Valitse Finland-Helsinki
 Write down the Temporary Application ID. If you do not manage to complete the form you can continue where you stopped with this ID no. Muista Temporary Application ID. Jos et onnistu täyttää lomake loppuun
MUSEOT KULTTUURIPALVELUINA
 Elina Arola MUSEOT KULTTUURIPALVELUINA Tutkimuskohteena Mikkelin museot Opinnäytetyö Kulttuuripalvelujen koulutusohjelma Marraskuu 2005 KUVAILULEHTI Opinnäytetyön päivämäärä 25.11.2005 Tekijä(t) Elina
Uusi Ajatus Löytyy Luonnosta 3 (Finnish Edition)
") Uusi Ajatus Löytyy Luonnosta 3 (Finnish Edition) Esko Jalkanen Click here if your download doesn"t start automatically Uusi Ajatus Löytyy Luonnosta 3 (Finnish Edition) Esko Jalkanen Uusi Ajatus Löytyy
Uusi Ajatus Löytyy Luonnosta 3 (Finnish Edition) Esko Jalkanen Click here if your download doesn"t start automatically Uusi Ajatus Löytyy Luonnosta 3 (Finnish Edition) Esko Jalkanen Uusi Ajatus Löytyy
Nuku hyvin, pieni susi -????????????,?????????????????. Kaksikielinen satukirja (suomi - venäjä) (www.childrens-books-bilingual.com) (Finnish Edition)
 (www.childrens-books-bilingual.com) (Finnish Edition)") Nuku hyvin, pieni susi -????????????,?????????????????. Kaksikielinen satukirja (suomi - venäjä) (www.childrens-books-bilingual.com) (Finnish Edition) Click here if your download doesn"t start automatically
Nuku hyvin, pieni susi -????????????,?????????????????. Kaksikielinen satukirja (suomi - venäjä) (www.childrens-books-bilingual.com) (Finnish Edition) Click here if your download doesn"t start automatically
toukokuu 2011: Lukion kokeiden kehittämistyöryhmien suunnittelukokous
 Tuula Sutela toukokuu 2011: Lukion kokeiden kehittämistyöryhmien suunnittelukokous äidinkieli ja kirjallisuus, modersmål och litteratur, kemia, maantiede, matematiikka, englanti käsikirjoitukset vuoden
Results on the new polydrug use questions in the Finnish TDI data
 Results on the new polydrug use questions in the Finnish TDI data Multi-drug use, polydrug use and problematic polydrug use Martta Forsell, Finnish Focal Point 28/09/2015 Martta Forsell 1 28/09/2015 Esityksen
Tarua vai totta: sähkön vähittäismarkkina ei toimi? 11.2.2015 Satu Viljainen Professori, sähkömarkkinat
 Tarua vai totta: sähkön vähittäismarkkina ei toimi? 11.2.2015 Satu Viljainen Professori, sähkömarkkinat Esityksen sisältö: 1. EU:n energiapolitiikka on se, joka ei toimi 2. Mihin perustuu väite, etteivät
Guidebook for Multicultural TUT Users
 1 Guidebook for Multicultural TUT Users WORKPLACE PIRKANMAA-hankkeen KESKUSTELUTILAISUUS 16.12.2010 Hyvää käytäntöä kehittämässä - vuorovaikutusopas kansainvälisille opiskelijoille TTY Teknis-taloudellinen
ProAgria. Opportunities For Success
 ProAgria Opportunities For Success Association of ProAgria Centres and ProAgria Centres 11 regional Finnish ProAgria Centres offer their members Leadership-, planning-, monitoring-, development- and consulting
National Building Code of Finland, Part D1, Building Water Supply and Sewerage Systems, Regulations and guidelines 2007
 National Building Code of Finland, Part D1, Building Water Supply and Sewerage Systems, Regulations and guidelines 2007 Chapter 2.4 Jukka Räisä 1 WATER PIPES PLACEMENT 2.4.1 Regulation Water pipe and its
Oma sininen meresi (Finnish Edition)
") Oma sininen meresi (Finnish Edition) Hannu Pirilä Click here if your download doesn"t start automatically Oma sininen meresi (Finnish Edition) Hannu Pirilä Oma sininen meresi (Finnish Edition) Hannu Pirilä
Oma sininen meresi (Finnish Edition) Hannu Pirilä Click here if your download doesn"t start automatically Oma sininen meresi (Finnish Edition) Hannu Pirilä Oma sininen meresi (Finnish Edition) Hannu Pirilä
BLOCKCHAINS AND ODR: SMART CONTRACTS AS AN ALTERNATIVE TO ENFORCEMENT
 UNCITRAL EMERGENCE CONFERENCE 13.12.2016 Session I: Emerging Legal Issues in the Commercial Exploitation of Deep Seabed, Space and AI BLOCKCHAINS AND ODR: SMART CONTRACTS AS AN ALTERNATIVE TO ENFORCEMENT
GOOD WORK LONGER CAREER:
 Juhani Ilmarinen, Ville Ilmarinen, Pekka Huuhtanen, Veikko Louhevaara, Ove Näsman GOOD WORK LONGER CAREER: WORK WELL-BEING IN FINNISH TECHNOLOGY INDUSTRIES 2010-2015 Background Collective agreement between
Miksi Suomi on Suomi (Finnish Edition)
") Miksi Suomi on Suomi (Finnish Edition) Tommi Uschanov Click here if your download doesn"t start automatically Miksi Suomi on Suomi (Finnish Edition) Tommi Uschanov Miksi Suomi on Suomi (Finnish Edition)
Miksi Suomi on Suomi (Finnish Edition) Tommi Uschanov Click here if your download doesn"t start automatically Miksi Suomi on Suomi (Finnish Edition) Tommi Uschanov Miksi Suomi on Suomi (Finnish Edition)
16. Allocation Models
 16. Allocation Models Juha Saloheimo 17.1.27 S steemianalsin Optimointiopin seminaari - Sks 27 Content Introduction Overall Efficienc with common prices and costs Cost Efficienc S steemianalsin Revenue
Norpe Winning Culture
 Norpe Winning Culture TEKES Ideat vaihtoon 2.4.2014 Mona Hokkanen Smarter retailing Elämykselliset ostokokemukset Yksilölliset myymäläkonseptit Alhaisimmat kokonaiselinkaarikustannukset Seite 2 Miksi?
Kokonaisarkkitehtuurin omaksuminen: Mahdollisia ongelmakohtia ja tapoja päästä niiden yli
 Kokonaisarkkitehtuurin omaksuminen: Mahdollisia ongelmakohtia ja tapoja päästä niiden yli Samuli Pekkola professori Tuotantotalouden ja tietojohtamisen laboratorio Tampereen (teknillinen) yliopisto Sisältö
Keskeisiä näkökulmia RCE-verkoston rakentamisessa Central viewpoints to consider when constructing RCE
 Keskeisiä näkökulmia RCE-verkoston rakentamisessa Central viewpoints to consider when constructing RCE Koordinaattorin valinta ja rooli Selection and role of the coordinator Painopiste: tiede hallinto
2 Description of Software Architectures
 2 Description of Software Architectures 2.1 Significance of architectural descriptions 2.2 Context of architectural descriptions 2.3 Levels of architectural descriptions 2.4 Viewpoints and types in architecture
RANTALA SARI: Sairaanhoitajan eettisten ohjeiden tunnettavuus ja niiden käyttö hoitotyön tukena sisätautien vuodeosastolla
 TURUN YLIOPISTO Hoitotieteen laitos RANTALA SARI: Sairaanhoitajan eettisten ohjeiden tunnettavuus ja niiden käyttö hoitotyön tukena sisätautien vuodeosastolla Pro gradu -tutkielma, 34 sivua, 10 liitesivua
Supply Chain Management and Material Handling in Paper Industry Case Tervakoski Oy
 Tampere University of Applied Sciences Paper technology International Pulp and Paper Technology Supply Chain Management and Material Handling in Paper Industry Case Tervakoski Oy Supervisor Commissioned
A new model of regional development work in habilitation of children - Good habilitation in functional networks
 A new model of regional development work in habilitation of children - Good habilitation in functional networks Salla Sipari, PhD, Principal Lecturer Helena Launiainen, M.Ed, Manager Helsinki Metropolia
Asiantuntijoiden osaamisen kehittäminen ja sen arviointi. Anne Sundelin Capgemini Finland Oy
 Asiantuntijoiden osaamisen kehittäminen ja sen arviointi Anne Sundelin Capgemini Finland Oy Urapolkumalli ja suorituksen johtaminen ovat keskeisiä prosesseja asiantuntijoiden ja organisaation kehittämisessä
Alternative DEA Models
 Mat-2.4142 Alternative DEA Models 19.9.2007 Table of Contents Banker-Charnes-Cooper Model Additive Model Example Data Home assignment BCC Model (Banker-Charnes-Cooper) production frontiers spanned by convex
CASE POSTI: KEHITYKSEN KÄRJESSÄ TALOUDEN SUUNNITTELUSSA KETTERÄSTI PALA KERRALLAAN
 POSTI GROUP CASE POSTI: KEHITYKSEN KÄRJESSÄ TALOUDEN SUUNNITTELUSSA KETTERÄSTI PALA KERRALLAAN TIINA KATTILAKOSKI POSTIN TALOUDEN SUUNNITTELU Mistä lähdettiin liikkeelle? Ennustaminen painottui vuosisuunnitteluun
anna minun kertoa let me tell you
 anna minun kertoa let me tell you anna minun kertoa I OSA 1. Anna minun kertoa sinulle mitä oli. Tiedän että osaan. Kykenen siihen. Teen nyt niin. Minulla on oikeus. Sanani voivat olla puutteellisia mutta
Peliosaamisen koulutuskokonaisuus
 Peliosaamisen koulutuskokonaisuus University of Tampere / SIS / TRIM Game Research Lab Frans Mäyrä, frans.mayra@uta.fi PhD, Professor of Hypermedia, esp. Digital Culture and Game Studies GameLab history
TU-C2030 Operations Management Project. Introduction lecture November 2nd, 2016 Lotta Lundell, Rinna Toikka, Timo Seppälä
 TU-C2030 Operations Management Project Introduction lecture November 2nd, 2016 Lotta Lundell, Rinna Toikka, Timo Seppälä Welcome to the course! Today s agenda Introduction to cases and schedule/ Timo Seppälä
Co-Design Yhteissuunnittelu
 Co-Design Yhteissuunnittelu Tuuli Mattelmäki DA, associate professor Aalto University School of Arts, Design and Architecture School of Arts, Design and Architecture design with and for people Codesign
JA CHALLENGE 18.-19.4.2013. Anna-Mari Sopenlehto Central Administration The City Development Group Business Developement and Competence
 JA CHALLENGE 18.-19.4.2013 Anna-Mari Sopenlehto Central Administration The City Development Group Business Developement and Competence 12.11.2014 Challenges of the City of Turku What kind of city you would
Gap-filling methods for CH 4 data
 Gap-filling methods for CH 4 data Sigrid Dengel University of Helsinki Outline - Ecosystems known for CH 4 emissions; - Why is gap-filling of CH 4 data not as easy and straight forward as CO 2 ; - Gap-filling
Transport climate policy choices in the Helsinki Metropolitan Area 2025
 Transport climate policy choices in the Helsinki Metropolitan Area 2025 views of transport officials and politicians Vilja Varho Introduction Experts have doubts about whether sufficiently effective policies
1. Liikkuvat määreet
 1. Liikkuvat määreet Väitelauseen perussanajärjestys: SPOTPA (subj. + pred. + obj. + tapa + paikka + aika) Suora sanajärjestys = subjekti on ennen predikaattia tekijä tekeminen Alasääntö 1: Liikkuvat määreet
Olet vastuussa osaamisestasi
 Olet vastuussa osaamisestasi Ohjelmistoammattilaisuuden uudet haasteet Timo Vehmaro 02-12-2015 1 Nokia 2015 Mitä osaamista tulevaisuudessa tarvitaan? Vahva perusosaaminen on kaiken perusta Implementaatio
WAMS 2010,Ylivieska Monitoring service of energy efficiency in housing. 13.10.2010 Jan Nyman, jan.nyman@posintra.fi
 WAMS 2010,Ylivieska Monitoring service of energy efficiency in housing 13.10.2010 Jan Nyman, jan.nyman@posintra.fi Background info STOK: development center for technology related to building automation
Jussi Klemola 3D- KEITTIÖSUUNNITTELUOHJELMAN KÄYTTÖÖNOTTO
 Jussi Klemola 3D- KEITTIÖSUUNNITTELUOHJELMAN KÄYTTÖÖNOTTO Opinnäytetyö KESKI-POHJANMAAN AMMATTIKORKEAKOULU Puutekniikan koulutusohjelma Toukokuu 2009 TIIVISTELMÄ OPINNÄYTETYÖSTÄ Yksikkö Aika Ylivieska
Ostamisen muutos muutti myynnin. Technopolis Business Breakfast 21.8.2014
 Ostamisen muutos muutti myynnin Technopolis Business Breakfast 21.8.2014 Taking Sales to a Higher Level Mercuri International on maailman suurin myynnin konsultointiyritys. Autamme asiakkaitamme parantamaan
BDD (behavior-driven development) suunnittelumenetelmän käyttö open source projektissa, case: SpecFlow/.NET.
 suunnittelumenetelmän käyttö open source projektissa, case: SpecFlow/.NET.") BDD (behavior-driven development) suunnittelumenetelmän käyttö open source projektissa, case: SpecFlow/.NET. Pekka Ollikainen Open Source Microsoft CodePlex bio Verkkosivustovastaava Suomen Sarjakuvaseura
BDD (behavior-driven development) suunnittelumenetelmän käyttö open source projektissa, case: SpecFlow/.NET. Pekka Ollikainen Open Source Microsoft CodePlex bio Verkkosivustovastaava Suomen Sarjakuvaseura
Palveluiden asiakastyytyväisyyskysely
 Palveluiden asiakastyytyväisyyskysely Yhteenvetoa (Summary in English, see below) Sakari Heikkilä Kehityspalvelut Kyselystä Henkilöstölle suunnattu kysely oli avoinna 2.3.-26.3. Uutista ja siihen liittyviä
WITNESS SUPPORT THE FINNISH EXPERIENCE
 WITNESS SUPPORT THE FINNISH EXPERIENCE T i i n a R a n t a n e n R e g i o n a l M a n a g e r, V i c t i m S u p p o r t F i n l a n d 17.6.2013 1 VS FINLAND S SERVICES Help line (nation wide) Mon - Tue
Suomen Talonpoikaiss Dyn Keskustelup Yt Kirjat, Issue 1... (Finnish Edition) Click here if your download doesn"t start automatically
 Click here if your download doesnt start automatically") Suomen Talonpoikaiss Dyn Keskustelup Yt Kirjat, Issue 1... (Finnish Edition) Click here if your download doesn"t start automatically Suomen Talonpoikaiss Dyn Keskustelup Yt Kirjat, Issue 1... (Finnish
Suomen Talonpoikaiss Dyn Keskustelup Yt Kirjat, Issue 1... (Finnish Edition) Click here if your download doesn"t start automatically Suomen Talonpoikaiss Dyn Keskustelup Yt Kirjat, Issue 1... (Finnish
Innovation Accelerator Program. 1
 Innovation Accelerator Program www.innotiimi-icg.fi 1 ACCELERATE YOUR STRATEGY WITH INNOVATION Too often is innovation not seen askey element of the companies' core strategy. The fact is however, it is
Infrastruktuurin asemoituminen kansalliseen ja kansainväliseen kenttään Outi Ala-Honkola Tiedeasiantuntija
 Infrastruktuurin asemoituminen kansalliseen ja kansainväliseen kenttään Outi Ala-Honkola Tiedeasiantuntija 1 Asemoitumisen kuvaus Hakemukset parantuneet viime vuodesta, mutta paneeli toivoi edelleen asemoitumisen
Land-Use Model for the Helsinki Metropolitan Area
 Land-Use Model for the Helsinki Metropolitan Area Paavo Moilanen Introduction & Background Metropolitan Area Council asked 2005: What is good land use for the transport systems plan? At first a literature
ENE-C2001 Käytännön energiatekniikkaa. Aloitustapaaminen 11.4.2016. Osa II: Projekti- ja tiimityö
 ENE-C2001 Käytännön energiatekniikkaa Aloitustapaaminen 11.4.2016 Osa II: Projekti- ja tiimityö Sisältö Projektityö Mitä on projektityö? Projektityön tekeminen: ositus, aikatauluhallinta, päätöksenteon
Hankkeiden vaikuttavuus: Työkaluja hankesuunnittelun tueksi
 Ideasta projektiksi - kumppanuushankkeen suunnittelun lähtökohdat Hankkeiden vaikuttavuus: Työkaluja hankesuunnittelun tueksi Erasmus+ -ohjelman hakuneuvonta ammatillisen koulutuksen kumppanuushanketta
Improving advisory services through technology. Challenges for agricultural advisory after 2020 Jussi Juhola Warsaw,
 Improving advisory services through technology Challenges for agricultural advisory after 2020 Jussi Juhola Warsaw, 22.2.2018 ProAgria in a nutshell Provides farm-and-agriculture entrepreneurs with services
Welcome to. Finland Lahti Wellamo Community College. 11 December 2007
 Welcome to Finland Lahti Wellamo Community College 11 December 2007 We operate in the premises of Lahti Adult Education Centre The building was inaugurated exactly 20 year ago and was built to serve university
Arkkitehtuuritietoisku. eli mitä aina olet halunnut tietää arkkitehtuureista, muttet ole uskaltanut kysyä
 Arkkitehtuuritietoisku eli mitä aina olet halunnut tietää arkkitehtuureista, muttet ole uskaltanut kysyä Esikysymys Kuinka moni aikoo suunnitella projektityönsä arkkitehtuurin? Onko tämä arkkitehtuuria?
Academic Opening. Opening - Introduction. In this essay/paper/thesis I shall examine/investigate/evaluate/analyze General opening for an essay/thesis
 - Introduction In this essay/paper/thesis I shall examine/investigate/evaluate/analyze General opening for an essay/thesis Tässä esseessä / tutkielmassa / opinnäytetyössä tutkin / tarkastelen / arvioin/
HUMAN RESOURCE DEVELOPMENT PROJECT AT THE UNIVERSITY OF NAMIBIA LIBRARY
 HUMAN RESOURCE DEVELOPMENT PROJECT AT THE UNIVERSITY OF NAMIBIA LIBRARY Kaisa Sinikara, University Librarian, Professor and Elise Pirttiniemi, Project Manager, Helsinki University Library Ellen Namhila,
TIETEEN PÄIVÄT OULUSSA 1.-2.9.2015
 1 TIETEEN PÄIVÄT OULUSSA 1.-2.9.2015 Oulun Yliopisto / Tieteen päivät 2015 2 TIETEEN PÄIVÄT Järjestetään Oulussa osana yliopiston avajaisviikon ohjelmaa Tieteen päivät järjestetään saman konseptin mukaisesti
Competitiveness with user and customer experience
 Competitiveness with user and customer experience MPD Workshop 10.6.2015 Results of the group works Eija Kaasinen VTT Technical Research Centre of Finland Group work In pairs: Discuss the ideas you have
Microsoft Lync 2010 Attendee
 VYVI MEETING Lync Attendee 2010 Instruction 1 (15) Microsoft Lync 2010 Attendee Online meeting VYVI MEETING Lync Attendee 2010 Instruction 2 (15) Index 1 Microsoft LYNC 2010 Attendee... 3 2 Acquiring Lync
ALOITUSKESKUSTELU / FIRST CONVERSATION
 ALOITUSKESKUSTELU / FIRST CONVERSATION Lapsen nimi / Name of the child Lapsen ikä / Age of the child yrs months HYVINKÄÄN KAUPUNKI Varhaiskasvatuspalvelut Lapsen päivähoito daycare center / esiopetusyksikkö
Fighting diffuse nutrient load: Multifunctional water management concept in natural reed beds
 PhD Anne Hemmi 14.2.2013 RRR 2013 Conference in Greifswald, Germany Fighting diffuse nutrient load: Multifunctional water management concept in natural reed beds Eutrophication in surface waters High nutrient
Voice Over LTE (VoLTE) By Miikka Poikselkä;Harri Holma;Jukka Hongisto
 By Miikka Poikselkä;Harri Holma;Jukka Hongisto") Voice Over LTE (VoLTE) By Miikka Poikselkä;Harri Holma;Jukka Hongisto If you are searched for a book by Miikka Poikselkä;Harri Holma;Jukka Hongisto Voice over LTE (VoLTE) in pdf form, then you have come
Voice Over LTE (VoLTE) By Miikka Poikselkä;Harri Holma;Jukka Hongisto If you are searched for a book by Miikka Poikselkä;Harri Holma;Jukka Hongisto Voice over LTE (VoLTE) in pdf form, then you have come
Enterprise Architecture TJTSE Yrityksen kokonaisarkkitehtuuri
 Enterprise Architecture TJTSE25 2009 Yrityksen kokonaisarkkitehtuuri Jukka (Jups) Heikkilä Professor, IS (ebusiness) Faculty of Information Technology University of Jyväskylä e-mail: jups@cc.jyu.fi tel:
LYTH-CONS CONSISTENCY TRANSMITTER
 LYTH-CONS CONSISTENCY TRANSMITTER LYTH-INSTRUMENT OY has generate new consistency transmitter with blade-system to meet high technical requirements in Pulp&Paper industries. Insurmountable advantages are
WP3 Decision Support Technologies
 WP3 Decision Support Technologies 1 WP3 Decision Support Technologies WP Leader: Jarmo Laitinen Proposed budget: 185 000, VTT 100 000, TUT 85 000. WP3 focuses in utilizing decision support technologies
ECSEL - Electronic Components and Systems for European Leadership
 ECSEL lyhyesti 2015 ECSEL - Electronic Components and Systems for European Leadership The Public-Private Partnership keeping Europe at the Forefront of Technology Development Electronic Components and
VUOSI 2015 / YEAR 2015
 VUOSI 2015 / YEAR 2015 Kansainvälisen opetuksen ja tutkimustoiminnan kehittäminen Developing international teaching and research activities Rehtorin strateginen rahoitus vuosille 2014-2016 / Strategic
Mat Seminar on Optimization. Data Envelopment Analysis. Economies of Scope S ysteemianalyysin. Laboratorio. Teknillinen korkeakoulu
 Mat-2.4142 Seminar on Optimization Data Envelopment Analysis Economies of Scope 21.11.2007 Economies of Scope Introduced 1982 by Panzar and Willing Support decisions like: Should a firm... Produce a variety
Kysymys 5 Compared to the workload, the number of credits awarded was (1 credits equals 27 working hours): (4)
: (4)") Tilasto T1106120-s2012palaute Kyselyn T1106120+T1106120-s2012palaute yhteenveto: vastauksia (4) Kysymys 1 Degree programme: (4) TIK: TIK 1 25% ************** INF: INF 0 0% EST: EST 0 0% TLT: TLT 0 0% BIO:
Tilasto T1106120-s2012palaute Kyselyn T1106120+T1106120-s2012palaute yhteenveto: vastauksia (4) Kysymys 1 Degree programme: (4) TIK: TIK 1 25% ************** INF: INF 0 0% EST: EST 0 0% TLT: TLT 0 0% BIO:
Data Quality Master Data Management
 Data Quality Master Data Management TDWI Finland, 28.1.2011 Johdanto: Petri Hakanen Agenda 08.30-09.00 Coffee 09.00-09.30 Welcome by IBM! Introduction by TDWI 09.30-10.30 Dario Bezzina: The Data Quality
Metal 3D. manufacturing. Kimmo K. Mäkelä Post doctoral researcher
 Metal 3D manufacturing Kimmo K. Mäkelä Post doctoral researcher 02.11.2016 Collaboration! 2 Oulun yliopisto Definition - What does Additive Manufacturing mean? Additive manufacturing is a manufacturing
UUSIA TAPOJA OPPIMISEN ARVIOINTIIN
 VOPE-seminaari 31.1.2014 UUSIA TAPOJA OPPIMISEN ARVIOINTIIN Mitä workshopissa tapahtuu? Osallistujat esittäytyvät Lämmittelykeskustelu: Mitä arviointi on? Erilaisia tapoja arvioida verkossa tapahtuvaa
Group 2 - Dentego PTH Korvake. Peer Testing Report
 Group 2 - Dentego PTH Korvake Peer Testing Report Revisions Version Date Author Description 1.0 Henrik Klinkmann First version Table of Contents Contents Revisions... 2 Table of Contents... 2 Testing...
Bounds on non-surjective cellular automata
 Bounds on non-surjective cellular automata Jarkko Kari Pascal Vanier Thomas Zeume University of Turku LIF Marseille Universität Hannover 27 august 2009 J. Kari, P. Vanier, T. Zeume (UTU) Bounds on non-surjective
Returns to Scale II. S ysteemianalyysin. Laboratorio. Esitelmä 8 Timo Salminen. Teknillinen korkeakoulu
 Returns to Scale II Contents Most Productive Scale Size Further Considerations Relaxation of the Convexity Condition Useful Reminder Theorem 5.5 A DMU found to be efficient with a CCR model will also be
Missä mennään BI? Mikko Kontio
 Missä mennään BI? Mikko Kontio Source: EMC - Big Data in 2020 % Business Intelligence Business Analytics set of theories, methodologies, architectures, and technologies that transform raw data into meaningful